


Services on Demand
Journal
Article
 English (pdf)
 Article in xml format
 Article references
 Send this article by e-mail
Indicators
-
 Cited by SciELO
 -
 Access statistics
Related links
-
 Cited by Google
 -
 Similars in
SciELO
Similars in
SciELO -
 Similars in Google
Share

 Permalink
Estudios Gerenciales
Print version ISSN 0123-5923
estud.gerenc. vol.25 no.113 Cali Oct./Dec. 2009
POTENTIAL DIVIDENDS AND ACTUAL CASH FLOWS IN EQUITY VALUATION. A CRITICAL ANALYSIS1
IGNACIO VÉLEZ-PAREJA*1, CARLO ALBERTO MAGNI2
1Master of Science en Industrial Engineering, University of Missouri, Estados Unidos. Profesor Asociado, Universidad Tecnológica de Bolívar, Colombia. Grupo de investigación Instituto de Estudios para el Desarrollo, IDE, Colombia. Dirigir correspondencia a: Universidad Tecnológica de Bolívar, Calle del Bouquet No 25-92, Manga, Cartagena, Colombia ivelez@unitecnologica.edu.co
2PhD in Mathematics applied to economic problems, University of Trieste, Italia. Associate Professor of Mathematical Methods for Economics, Actuarial and Financial Sciences, University of Modena and Reggio Emilia, Faculty of Economics, Italia. Grupo de investigación Instituto de Estudios para el Desarrollo, IDE, Colombia. magni@unimo.it
* Autor para correspondencia.
Fecha de recepción: 07-05-2009 Fecha de corrección: 20-11-2009 Fecha de aceptación: 26-11-2009
ABSTRACT
Practitioners and most academics in valuation include changes in liquid assets (potential dividends) in the cash flows. This widespread and wrong practice is inconsistent with basic finance theory. We present economic, theoretical, and empirical arguments to support the thesis. Economic arguments underline that only flows of cash should be considered for valuation; theoretical arguments show how potential dividends lead to contradiction and to arbitrage losses. Empirical arguments, from recent studies, suggest that investors discount potential dividends with high discount rates, which means that changes in liquid assets are not value drivers. Hence, when valuing cash flows, we should consider only actual payments.
KEYWORDS
Cash flow to equity, potential dividends, equity value.
JEL Classification: M41, G12, G31
RESUMEN
Dividendos potenciales y flujos de caja reales en valoración. Un análisis crítico.
Profesionales y la mayoría de los académicos de valoración incluyen los cambios en activos líquidos (dividendos potenciales) en los flujos de efectivo. Esta práctica generalizada y equivocada es incompatible con la teoría básica de finanzas. Se presentan argumentos económicos, teóricos y empíricos para apoyar esta tesis. Los argumentos económicos dicen que para la valoración sólo se deben considerar flujos de caja; los teóricos muestran cómo los dividendos potenciales conducen a contradicciones y a pérdidas de arbitraje. Los argumentos empíricos sugieren que los inversionistas descuentan los dividendos potenciales con altas tasas de descuento, lo que significa que el cambio en activos líquidos destruyen valor. Por tanto, al valorar los flujos de caja, se debería considerar sólo los pagos que en realidad ocurren.
PALABRAS CLAVE
Flujo de caja del accionista, dividendos potenciales, valor del patrimonio.
RESUMO
Potenciais dividendos e fluxo de caixa efetivo em valoração de patrimônio. Uma análise crítica
Profissionais e a maioria dos académicos trabalhando no campo da valoração incluem mudanças em ativos disponíveis (potenciais dividendos) nos fluxos de caixa. Esta prática comum e incorreta é inconsistente com a teoria financeira básica. Nós apresentamos argumentos econômicos, teóricos e empíricos para apoiar essa tese. Enquanto que os argumentos econômicos afirmam que apenas os fluxos de caixa deveriam ser considerados para objetivos de valoração, os argumentos teóricos mostram como a consideração de potenciais dividendos leva a contradições/discrepâncias e perdas em arbitragem. Argumentos empíricos em estudos recentes sugerem que os investidores tendem a descontar potenciais dividendos a elevadas taxas de desconto, o que significa que as mudanças em ativos disponíveis não são acionadores de valor. Por isso, apenas pagamentos reais deveriam ser considerados ao valorar fluxos de caixa.
PALAVRAS-CHAVE
Fluxo de caixa para valoração, potenciais dividendos, valoração de patrimônio.
INTRODUCTION
In this document, we give support to the idea that potential dividends that are not distributed (and are invested in liquid assets) should be neglected in firm valuation, because only distributed cash flows add value to shareholders. Hence, the definition of Cash Flow to Equity should include only the cash flow that is actually paid to shareholders (dividends paid plus share repurchases minus new equity investment). Although some authors warn against the use of potential dividends for valuing firms (DeAngelo and DeAngelo, 2006, 2007; Fernández, 2002, 2007; Tham and Vélez-Pareja, 2004; Vélez-Pareja, 1999a, 1999b, 2004, 2005a, 2005b); some respected authors (e.g. Benninga and Sarig, 1997; Brealey and Myers, 2003; Copeland,2 Koller and Murrin, 1994, 2000; Damodaran, 1999, 2006a, 2006b, 2008) and many practitioners seem to support the idea that the Cash Flow to Equity has to include undistributed potential dividends.3
To include undistributed potential dividends in valuation is admissible only if they are expected to be invested at the cost of equity capital, ke, i.e. the net present value (NPV) of those investments is zero from the point of view of current shareholders. If the latter assumption held, then changes in liquid assets could be indeed included in the Cash Flow to Equity, because they would be value-neutral (DeAngelo and DeAngelo, 2006; Magni, 2007). It should be noted that a definition of cash flow to equity is meant to be valid for all possible cases, and thus should not depend on a particular assumption about investment in liquid assets, otherwise the consequent definition of firm value would depend on a particular assumption about investment in liquid assets. Furthermore, this particular assumption violates Jensens (1986) agency theory. DeAngelo and DeAngelo (2006) claim that When MMs assumptions are relaxed to allow retention, payout policy matters in exactly the same sense that investment policy does (p. 293) and irrelevance fails because some feasible payout policies do not distribute the full present value of FCF to currently outstanding shares (p. 294). The zero-NPV assumption is not supported by the empirical data. Literature reports that holding liquid assets destroys value or at most does not create a significant amount of value. Schwetzler and Carsten (2003) report that in Germany persistent excessive cash holdings lead to a significant operating underperformance [italics added] ( ) in line with expectations of the agency theory (p. 25).
Harford (1999)4 finds that cash-rich bidder destroys seven cents of firm value [italics added] for every dollar of excess cash held (p. 1983) and says that the stock market appears to partially anticipate this behavior, as evidenced by the negative stock market reaction to cash stockpiling [italics added] (p. 1972). Finally, he says that one might expect that stockpiling cash would be greeted negatively by the market [italics added] (p. 1992). Opler, Pinkowitz, Stulz and Williamson (1999) say that holdings of liquid assets can make shareholders worse off [italics added] in some circumstances (p. 2) and In a world of perfect capital markets [italics added], holdings of liquid assets are irrelevant. If cash flow turns out to be unexpectedly low so that a firm has to raise funds to keep operating and invest, it can do so at zero cost. ( ) Hence, if a firm borrows money and invests it in liquid assets, shareholders wealth is unchanged (pp. 4-5). Finally, they write that investing in cash can therefore have an adverse effect on firm value. To put it another way, increasing firms holdings of liquid assets by one dollar may increase firm value by less than one dollar [italics added] (p. 11). Faulkender and Wang (2004) find that the marginal value of cash declines with larger cash holdings [italics added], higher leverage, better access to capital markets, and as firms choose to distribute cash via dividends rather than repurchases (p. 2) and they estimate that for the mean firm-year in the sample, the marginal value of cash is $0,96 [italics added] (p. 24).
On the other hand, Mikkelson and Partch (2003) conclude that persistent large holdings of cash and equivalents have not hindered corporate performance (p. 2), and that there is no evidence that large firms with lower insider stock ownership, higher inside board composition, or a controlling founder perform differently than other large cash firms (p. 20). Pinkowitz, Stulz and Williamson (2003) write: Strikingly, while a dollar of cash is worth roughly a dollar of firm value [italics added] in the U.S., in countries with poor institutions, a dollar of cash is consistently estimated to be worth less than 65 cents [italics added] (p. 6).
In addition, Pinkowitz, Williamson and Stulz (2007)s result point out that one dollar of increase in dividends creates about ten dollars in value while one dollar increase in cash creates about 29 cents of value for countries with poor shareholders rights countries. In high corruption countries one dollar increase in dividends creates more than 6,50 dollars of value and one dollar of cash and cash equivalent create 33 cents of value. In the non corrupt countries and with good protection to the shareholders one dollar of extra dividends creates near four dollars in value and one dollar in liquid assets creates about one dollar in value. On the other hand, Pinkowitz and Williamson (2002) report that, on the average, one dollar in cash is 1,25 dollars worth in value.
This article aims at reinforcing the arguments on the inconvenience of adding the change in liquid assets (undistributed potential dividends) as part of the cash flows to be used for firm valuation. The arguments used in this document to support our thesis are of three types: economic, logical, and empirical.
As for the economic reasons, they highlight that to include the change in liquid assets in the definition of Cash Flow to Equity means: (i) to confound stock with flows, (ii) to adopt the very particular assumption that the full present value of liquid assets (computed at the cost of equity) will be distributed to shareholders, (iii) to break consistency between cash flow and financial statements, (iv) to distort taxes, and (v) to refuse Jensens (1986) agency theory which implies that firms in real life tend to retain funds and invest them in low-return investments.
As for the logical arguments, we provide three formal proofs to show that a rational evaluator does not use undistributed potential dividends. The first proof relies on incompatibility of CAPM and the use of potential dividends for valuation. The second one shows the use of potential dividends is incompatible with the classical valuation theory (and therefore, with Modigliani and Millers approach). A third proof shows that investors including changes in liquid assets as value-creation factors fall prey to arbitrage losses.
As for the empirical argument, we analyze and work out some contributions in the recent literature, from which it can be inferred that investors value liquid assets much less than dividends. Also, the implicit discount rates for liquid assets are very high, which suggests that investors do not consider liquid assets as affecting a firms value.
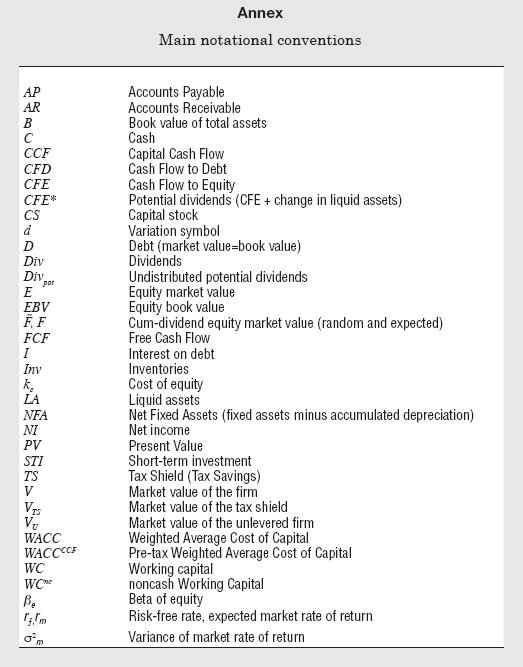
The document is organized as follows: section 1 shows that our definition of Cash Flow to Equity as dividends minus net capital contributions is consistent with basic finance, and, in particular, with Modigliani and Millers approach to valuation, whereas the definition widely used in many applied corporate finance textbooks and in real-life applications is not; this section also summarizes the different views advocated by several authors. Section 2 furnishes several economic reasons for supporting our thesis. Section 3 illustrates three logical arguments, and section 4 makes use of findings and information collected and analyzed by Pinkowitz et al. (2007) and other scholars to find indications of the irrelevance of liquid assets in value creation. Section 5 proposes a (theoretically correct) model to test the hypothesis that changes in liquid assets do not add value: the model proposed will be used in future researches. Some remarks conclude the document (main notational conventions are collected at the end of the document).
1. DEFINITION(S) OF CASH FLOW TO EQUITY
This section proposes a definition of Cash Flow to Equity consistent with Modigliani and Millers (1958, 1963) and Miller and Modiglianis (1961) approach to valuation.
According to the well known Clean Surplus Relation, change in equity book value is equal to change in capital stock plus net income (NI) minus dividends paid to shareholders (Div) as in eq. (1)

where EBV is the equity book value, and CSt+1 is the capital stock contributed by shareholders up to time t+1.
We use d,5 as the variation symbol, hence, dEBVt+1 = EBVt+1 –EBVt is the change in equity book value and dCSt+1 = CSt+1 – CSt is the net capital contributions made by shareholders in the year (i.e. dCSt+1 = new equity investment – shares repurchases). Therefore, we may rewrite equation (1) as:
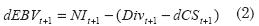
This is the cash flow that adds value to the equity. We define cash flow to equity (CFE) as:

As said above, our notion of CFE in eq. (3) is exactly what Miller and Modigliani (1961) use to calculate the firm value: their eq. (17) at p. 419 underscore the difference between dividends paid and net capital contributions. Using our symbols, the Miller and Modiglianis formula is
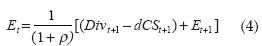
where Et is the equity market value at time t (and ρ is Miller and Modiglianis symbol for the cost of equity capital). It is worth noting that Miller and Modigliani propose the (equivalent) stream of earnings approach to valuation. Their eq. (9) is as follows:
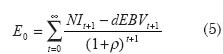
Inspecting the numerator, the reader may note that our eqs. (2) and (3) just imply, CFEt+1 = NIt+1 – dEBVt+1 so that:
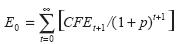
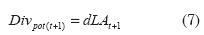
As a consequence, our approach is consistent with Miller and Modiglianis approach. By contrast, a large part of practitioners and some corporate finance scholars propose a different definition. For example, Damodaran (1999, 2006a, 2006b) proposes the use of cash flow available for distribution for valuing a firms equity, even if it will not be paid to the equity holder. The cash available for distribution is usually called potential dividends; the part of it which is not actually distributed is invested in liquid assets, i.e. cash and short-term investments such as market securities, certificate of deposit, CD, etc. Damodarans definition of cash flow to equity, which is widely adopted in applied corporate finance textbooks and practice, may be formalized as follows:

where Div pot(t+1) denote undistributed potential dividends. The latter are defined as the increase in liquid assets:
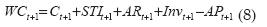
with LAt+1 = Ct+1 + STIt+1 (C=cash, STI=short-term investments).
We can express it in different terms: we divide the assets of the firm into two categories: fixed assets net of cumulated depreciation (NFA) and working capital (WC), defined as current assets (cash + short term investments + accounts receivable + inventories) minus current liabilities (accounts payable):
Then,
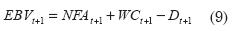
where D is the book value of the debt. From eq. (9), dEBVt+1 = dNFAt+1 + dWCt+1 – dDt+1. Hence, making use of eqs. (2)-(3), CFE may also be computed with the so-called indirect method:

where Investment in dNFAt+1 = NFAt+1 – NFAt = Fixed Assetst+1 –Depreciation t+1, and represents the socalled net capital expenditure.6
By contrast, a frequent definition in textbooks turns out to be:
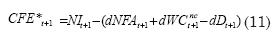
with WCnc being noncash (operating) working capital:
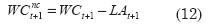
so that dARt+1 + dInvt+1 – dAPt+1 = dWCnct + 1 (see, for example, Damodaran, 1999, p. 128; Damodaran, 2006a, p. 79). In eq. (10) working capital is inclusive of undistributed potential dividends dLAt+1, whereas in eq. (11) working capital excludes dLAt+1. That is why the term in parenthesis in eq. (10) is greater than the term in parenthesis in eq. (11). As a result, is smaller than CFE*.
Damodaran (2006b) acknowledges the valuation deviations derived from using potential dividends rather than actual cash flows. He appropriately observes that
- when the FCFE is greater than the dividend and the excess cash either earns below-market interest rates or is invested in negative net present value assets, the value from the FCFE model will be greater than the value from the dividend discount model (p. 24).
And he admits that there is reason to believe that this is not as unusual as it would seem at the outset (p. 24).
Nevertheless, in his textbooks and documents he seems to contradict his very arguments, given that he favors the potential-dividends model over the other ones:
- Actual dividends (
) may be much lower than the potential dividends (that could have been paid out) (
) When actual dividends are less than potential dividends, using a model that focuses only on dividends will under state the true value [italics added] of the equity in a firm. (Damodaran, 2008, lide 106)
- (
) firms do not always pay out what they can afford to in dividends. A more realistic estimate of equity value may require us to estimate the potential dividendthe cash flow that could have been paid out as a dividend. (Damodaran, 2006a, p. 111)
Obviously, the fact that firms do not pay out what they have available for distribution is not a good reason for favoring potential dividends as opposed to actual cash flow. Quite the contrary, if firms do not pay out cash flows that is available, then value is affected; in principle, whatever the magnitude of potential dividends, if a firm pays out no dividend over the life of the firm, the equitys value is zero, as Miller and Modigliani correctly recognize (1961, p. 419, footnote 12). And this is true even if the company has invested in positive NPV projects (see also DeAngelo and DeAngelo, 2006).
Benninga and Sarig (1997) share Damodarans view:
- Free Cash Flow (FCF) [is] a concept that defines the amount of cash that the firm can [italics added] distribute to security holders (
) Cash and marketable securities are the best example of working capital items that we exclude from our definition of [change in net working capital], as they are the firms stock of excess liquidity adjustment. (p. 36)
When calculating free cash flow (and cash flow to equity) these authors do not subtract dLAt+1, which entails that they abide by eq. (11) above (they make use of the term net working capital while meaning operating net working capital, exclusive of change in liquid assets). If changes in liquid assets are not included in the working capital, then any increase in liquid assets is not listed as a reduction in the cash available (as is correctly done in eq. (10)), even if they are deposited in the bank or in an investment fund. Using the funds (a cash excess) for increasing liquid assets reduces the cash available for distribution; if that is not listed in the calculation of FCF, then the increase appears to be an amount available for distribution even if it is not, and hence the cash flows to investors (FCF or CFE) are overstated, as well as the consequent firm value.
Copeland, Koller and Murrins (1990, 1994, 2000) definition of free cash flow is consistent with Damodarans and Benninga and Sarigs: they define it as gross cash flow (NOPLAT plus depreciation) minus gross investment (increases in working capital plus capital expenditures) (Copeland et al., 2000, p. 138). Like with Benninga and Sarig, they employ the expression working capital but refer to operating working capital, as they explicitly state at p. 168. As a consequence, their definition of cash flow to equity does not exclude undistributed potential dividends:
Cash flow to equity = Dividends paid + Potential Dividends +Equity repurchases – Equity Issues
(see, for example, Copeland et al., 1994, p. 480, Exhibit 16.3; Copeland et al., 2000, Exhibit 21.2 at p. 430 and Exhibit 21.10 at p. 438). Admittedly, in the first edition of their book (Copeland et al., 1990) they seemed to be inclined to accept a strict definition of cash flow to equity as cash flow paid to shareholders: in their Exhibit 13.2 at p. 379 one finds, referred to equity,
Free Cash Flow = Dividends to equity
and they explicitly refer to free cash flow to shareholders, which is mathematically identical to dividends (p. 379). Yet, from the second edition of their book a radical shift toward potential dividends is consummated, albeit with no justification.
Brealey and Myers (2003) write that free cash flow is the amount of cash that a firm can pay out to investors after paying for all investments necessary for growth (p. 75). Therefore, while not being explicit, they seem to share the above mentioned authors point of view. Their notion of working capital is consistent with the above mentioned authors, who do not subtract the change in liquid assets: Working capital summarizes the net investment in short-term assets associated with a firm, business or project (...) Working capital = inventory + accounts receivable – accounts payable. (p. 126)7
While the practice of using potential dividends rather for valuing firms is a widespread one, there are some authors who consider it an error and correctly use only actual payments to shareholders for defining cash flow to equity. For example, Fernández (2002, p. 171) clearly states that the forecast equity cash flow in a period must be equal to forecast dividends plus share repurchases in that period and the ECF in a period is the increase in cash (above the minimum cash, whose increase is included in the increase in WCR) during that period, before dividend payments, share repurchases and capital increases (p. 172); considering the cash in the company as an equity cash flow when the company has no plans to distribute it (Fernández, 2007, p. 26) is a frequent error in real-life applications.
DeAngelo and DeAngelo (2007) argue that a firms equity is not given by potential dividends but by cash flow paid to shareholders. The former (they label them free cash flow) determines the investment value, the latter leads to the distribution value: Investment value is the discounted value of the FCF to the firm generated by its investment policy, which determines the firms capacity to make payouts. Distribution value is the discounted value of the cash payouts to currently outstanding shares, i.e., the cash flow paid to stockholders, which determines the market value of equity (p. 16, italics in original). They underline that value is generated for investors only to the extent that this capacity is transformed into actual payouts (DeAngelo and DeAngelo, 2006, p. 309, italics added).
Our stance is that nomina sunt omina:8 cash flow is a flow of cash and therefore: (i) stock items in the balance sheet should not be considered flows, and (ii) changes in stock items should be considered flow of cash only if they are paid to (or received from) shareholders. Hence, our definition of CFE as dividends minus net capital contributions (see eq. (3) above). If management keeps cash holdings instead of distributing it, shareholder wealth is affected unless the unpaid cash is invested in zero-NPV projects and distributed to shareholders over the life of the enterprise. But, usually in real life, as empirical evidence suggests, keeping cash holdings destroys value: the NPV of those invested funds is not zero (below zero).
2. ECONOMIC AND FINANCIAL ARGUMENTS
This section summarizes economic and financial reasons for including in the cash flow only what indeed is a flow of cash.
Cash flows and stocks. To consider as cash flow items that are listed in the balance sheet is to deny the basic concept in valuation: cash flows. And they are just that, flows of money, whereas items in the balance sheet are stocks. It is a contradiction to say that an item is at the same time a line (or part of it) in the balance sheet and a line in the cash flow. Furthermore, if one considered cash flow what it is such only potentially, then one should consistently consider any asset in the firm as potential dividends, because assets may be sold and the cash may be distributed to investors: but then one should consider assets in the firm as representing both stocks and flows, which is a contradiction.
Modigliani and Millers approach. Modigliani and Millers (1958, 1963) approach to firm valuation only takes account of cash flows paid to investors. There are no potential dividends in their articles. The same is true even in Miller and Modigliani (1961) where the irrelevance of dividends is proved. As DeAngelo and DeAngelo (2006) underline, in Miller and Modiglianis 1961 paper there are no retained funds, and the assumption is to mandate 100% free cash flow payout in every period (p. 293). Miller and Modigliani do not deal with potential dividends retained in the firms and invested in liquid assets. There are no investments in liquid assets in Miller and Modigliani (1961). Miller and Modiglianis thesis may be extended to the case of retention of FCF only if that investment is made at the opportunity cost of equity and provided that managers distribute the full present value of FCF (DeAngelo and DeAngelo, 2006, p. 303. See also Magni, 2007). Therefore, it is true that the unpaid dividends will be distributed at the terminal date, so that their value is captured in the terminal or continuing value. But it is never sufficiently stressed that irrelevance holds if and only if, a perfect market exists where cash excess not paid is invested at the opportunity cost of equity. In real life, excess cash is invested in liquid assets at some available rate that might be greater, equal or lower than the cost of equity. This means that the NPV of those undistributed funds can be greater, equal or less than zero.
Consistency between cash flows and financial statements. There should be a complete consistency between cash flows and financial statements. If one says that every dollar available belongs to the equity holders, then that fact should be reflected in the financial statement. That is, those funds should appear as effectively distributed. In a valuation where a finite planning horizon is considered, decisions on what to do with excess cash are reflected in the financial model. This implies that if management foresees to invest in marketable securities, that decision should appear in the financial statements. On the other hand, if cash holdings are invested in additional operating assets, that decision should be included in the analysis; if they are devoted to acquisitions or buyouts, again, that decision should be reflected in the cash flows with all the financial implications it has. After this finite planning horizon, one makes the assumption that all available cash is distributed to equity and debt holders; the finite planning horizon should cover the largest possible period and at the end, a continuing or terminal value should measure the value generated for perpetuity.
Tax distortion. When one includes in the CFE the excess cash invested in liquid assets, one does distort taxes. Instead of recording an explicit return (usually a low return) that is taxed and listed in the income statement, one creates a virtual return equivalent to the cost of equity, ke, which is not taxed in reality. Here, by virtual return we mean the return obtained implicitly when we distribute the cash flow to the owners (the debt and equity holders). This virtual and automatic return is one of the assumptions when we discount cash flows, as was recognized decades ago (see Lorie and Savage, 1955). When we assume that funds that are invested at a rate usually lower than the discount rate are part of the cash flow, we are assuming implicitly that those flows are reinvested at the same discount rate, but those returns are not listed in the income statement and not taxed, and go directly to the pocket of the owners. Here, it is important to take into account of this: cash flows for valuation are what goes out from the firm and is paid to the capital owners (debt and equity holders). When that cash flow is received by them, it is assumed that they invest those funds at their respective rates of return (cost of equity, ke). The problem arises when the firm does not pay out the cash flow and invests it in liquid assets. If the amounts appear in the cash flows, then it is as if the equity holder had received them, but in fact she has not, and when one discounts the cash flows at the cost of equity or at WACC, one is assuming that the investor is reinvesting it at the opportunity cost of equity rate, but it does not happen in reality because she has not received them (the funds are invested in cash and/or in marketable securities). It might sound paradoxical,9 but, actually, the greater the cash flow drawn out by debt and equity holders, the greater the firms value. The value of the firm is not in the funds that remain inside the firm, but in the funds that go out. Firm value increases if and only if cash is actually pulled out from the firm and distributed to the owners of debt or equity. Therefore, to consider potential dividends as actually pulled out by the firm is like trying to pull potential rabbits out of actual hats.
Zero-NPV assumption in real-life applications. One argument often used to justify the inclusion of cash holdings as a cash flow is that: the net present value of those investments is zero. We might agree on this assump tion as a conservative approach to avoid excessive optimism as well as the determination (in a forecast) of a very high return on those invested funds. However, in constructing pro forma financial statements (forecasting) one should look the history of the firm and estimate the historical returns on those funds, and forecast them accordingly to the historical average return. If the forecasted return is lower than the discount rate of the cash flows, the effect is that there is a destruction of value. If higher, a creation of value occurs. The idea of assuming without question that the NPV of the investment in market securities is zero implies that whatever the analyst or the management will do with those funds are of no concern to investors, because their funds do not contribute to value creation (they are value-neutral). Then, a simple conclusion could be drawn if one accepted the idea that the investment of cash excess does not affect the firm value: whether one keeps it in the safe box, in the bank, invested in an investment fund or whatever else, it will make no difference because the NPV is zero. This should lead many people and institutions to refrain from offering solutions for cash management purposes, such as the following.
No financial discipline is more important and yet more overlooked and misunderstood than the essential principles and practices of corporate cash and liquidity management. Any business success – from its long-term prospects to its short-term stability – depends on smart, efficient, and creative cash management solutions for handling cash inflows and outflows. The lesson is simple: Those companies that handle cash best thrive most (Cash Management Fundamentals, 2007).
A shareholder would not accept to be virtually paid with potential dividends that never go to her pocket; similarly, banks or, in general, debt holders would not accept that interest or principal payments should be paid with potential interest and principal payments. Will practitioners and teachers accept an invitation to tell their customers and students to disregard the importance of cash management? Will they spread the idea that keeping the excess cash in the bank account (with no interest) would mean the same in terms of value than investing it wisely? Obviously not. If managers do not or are not expected to fully distribute the cash available, one should not create cash flow where it is not. Certainly, there should be ways to avoid that managers waste the excess cash in bad investments. Jensen (1986) says it in a rather graphical manner: The positive market response to debt in oil industry takeovers ( ) is consistent with that additional debt increases efficiency by forcing organizations with large cash flows but few high-return investment projects to disgorge cash to investors. The debt helps prevent such firms from wasting resources on low-return projects (pp. 10-11). Further, he writes that Free cash flow is cash flow in excess of that required to fund all projects that have positive net present values when discounted at the relevant cost of capital. Conflicts of interest between shareholders and managers over payout policies are especially severe when the organization generates substantial free cash flow. The problem is how to motivate managers to disgorge the cash rather than investing it at below the cost of capital or wasting it on organization inefficiencies (p. 2) and Managers with substantial free cash flow can increase dividends or repurchase stock and thereby pay out current cash that would otherwise be invested in low-return projects or wasted (p. 3). Therefore, although corporate financial theory may conveniently employ the assumption of full distribution of cash generated, in practice this does not happen, as Jensen underlines, so there is a need for distinguishing between potential cash flow available for distribution and actual cash flow effectively paid out to equity and debt holders.10 The excess cash that managers refuse to pay to equity holders should not be included in the effective (actual) distributed cash flow. The fact that in theory firms should distribute the available cash does not imply that the analyst should assume that in the future all available cash will be distributed, if historically the firm has not distributed it. To assume that cash holdings are a cash flow that creates value is counter to evidence: the theory is empirically refutable, predicting that firms will distribute the full PV of FCF, an implication that differentiates it from Jensens (1986) agency theory (DeAngelo and DeAngelo, 2006, p. 295).
3. LOGICAL ARGUMENTS
In this section we formalize three arguments that logically support the thesis according to which undistributed potential dividends do not add value to shareholders (and therefore must not be included in the definition of Cash Flow to Equity). In particular, they show that the use of potential dividends for valuation: (a) does not comply with the CAPM, (b) does not comply with the basic tenet of valuation theory, (c) does not comply with the no-arbitrage principle.
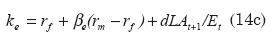
CAPM. The use of undistributed potential dividends is in clear contradiction with the Capital Asset Pricing Model. When the CAPM is used to estimate the cost of equity, ke, one uses dividends paid out to calculate the historical stock returns and historical beta; one never uses potential dividends.
Suppose (i) an investor uses the CAPM for computing the cost of equity and (ii) uses undistributed potential dividends for valuation. Then, the firm lies on and above the Security Market Line, SML
Assume, with no loss of generality, that dLAt+1>0. Due to (i), the following relation holds:
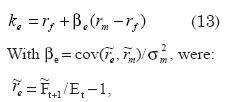
is the random rate of return and  denotes the cum-dividend equity value at time t+1. This implies:
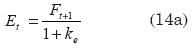
with Ft+1 being the expected value of . However, due to (ii),
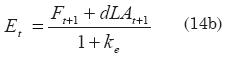
Eqs. (13) and (14a) tell us that the firm lies on the SML, whereas (14b) tells us that the firm lies above the SML, given that it implies:
The basic tenet of valuation theory. Section 1 has shown that our definition of CFE is consistent with Miller and Modiglianis approach to valuation. Miller and Modigliani, in turn, strictly abide by a basic tenet of valuation theory: value depends on cash flow received by the investor. This principle may be formalized as:
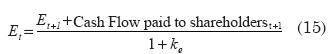
(see, for example, Miller and Modigliani, 1961, eq. (2)).
By making us of (i) undistributed potential dividends for valuation and (ii) the basic tenet of valuation theory, one incurs contradictions.
Note that one must have dLAt+1 ≠ 0 (if not, the use of undistributed potential dividends is meaningless). If undistributed potential dividends enters valuation, then. Et+1 = ET (1+ke)–CEF*t+1. But the cash flow paid to shareholder is equal to CFE* t+1 – dLAt+1 because dLAt+1. are, by assumption, not distributed to shareholders. Therefore, eq. (16) is:

Eqs. (10)-(11) imply dLAt+1 ≠ 0. But this contradicts the assumption dLAt+1. ≠ 0.
Arbitrage: a counterexample. The no-arbitrage principle is a cornerstone in financial theory (Varian, 1987) and decision theory (Smith and Nau, 1995), and, more generally, represents a norm of rationality in economics (Nau and McCardle, 1991).
We now illustrate a counterexample showing that if an investor uses undistributed potential dividends for valuation, then she is open to arbitrage losses. Consider a firm whose shares are traded in the market, and assume, for the sake of simplicity, that one shareholder owns all the shares. Suppose potential dividends will be, a perpetual 120 if state of nature 1 occurs, and a perpetual 70 if state of nature 2 occurs, but dividends will be, in each year, a perpetual 100 in state of nature 1 and a perpetual 50 in state of nature 2 (equal probability is assumed). This means that undistributed potential dividends amount to a constant 20 with certainty. The probability for each state of nature is 0,5. Suppose the required rate of return to equity is 10%. The investors who positively evaluate potential dividends value the equity firm by discounting potential dividends at 10%: E=0,5(120+70)/0,1=950.
Now, suppose the ownership offers such an investor all the firms shares at a price of 850. This means that the investor will own a firm which she values at 950. The NPV to her is positive (=100) so she accepts the bargain. Then, the ownership proposes a contract according to which the investor receives 750 and while paying the ownership a constant 100 if state of nature is 1 and a constant 50 if state of nature is 2. To the investor, such a cash flow stream is equivalent to the cash flow stream distributed by a firm which is equal to the firm just purchased but with no undistributed potential dividends. Therefore, to her the value of such a stream is equal to value of the firm just purchased less the value of the undistributed potential dividends. The undistributed potential dividends are a certain amount because she will receive them in either state of nature. Hence, the discount rate should be the risk free rate. Assuming that the risk-free rate is 4%, the value of the undistributed potential dividends is 20/0,04=500. So, the value of the cash flow stream is 950–500=450. The investor is then required to give up a value of 450 in order to get an immediate amount equal to 750. The NPV is positive to the investor (=300) so she accepts again. This strategy results in an arbitrage loss for the investor (and an arbitrage profit for the arbitrageur) (Table 1).
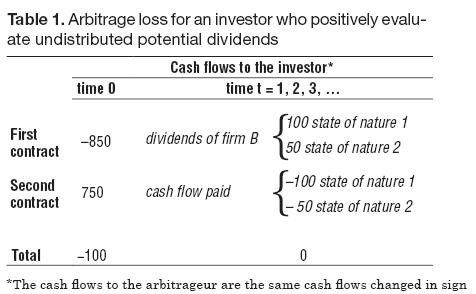
Hence, if one does not accept the basic tenet of valuation theory, one is open to arbitrage losses (to avoid arbitrage, one needs to value undistributed potential dividends at zero).
4. EMPIRICAL EVIDENCE: IS THE GLASS HALF FULL OR HALF EMPTY?
There is empirical evidence that dividends and not liquid assets are what increases firm value. Pinkowitz et al. (2007) have examined publicly traded firms for 35 countries and divided the sample between corrupt and non corrupt countries and between countries with good and poor protection to minority equity holders according to two Investor Protection Indices. Using our symbols, the model tested by Pinkowitz et al is described as:
where Vt is the market value of the firm calculated at fiscal year end as the sum of the market value of equity and the book values of shortterm debt and long-term debt; NA denotes net assets (defined as total assets minus liquid assets); Earn is earnings before extraordinary items plus interest, deferred tax credits, and investment tax credits; RD is research and development expense; I is interest expense; and Div is common dividends paid. The results by Pinkowitz et al. (2007) are shown in Table 2.
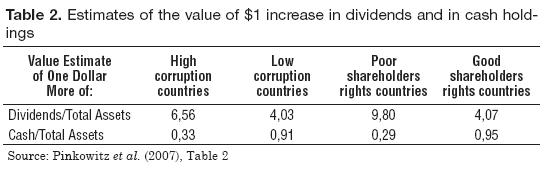
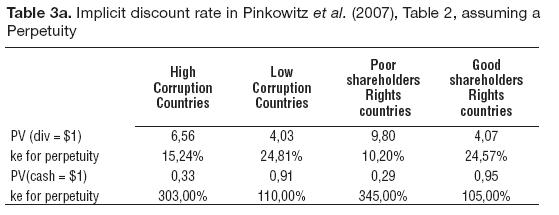
They allow us to estimate the implicit discount rate that makes an extra dollar in each of those components equal to the amount announced by the authors. In Table 3a we assume a non growing perpetuity; hence the discount rate is 1/PV. The discount rate the market applies to one dollar in cash is extremely high, while the discount rate for the dividends is reasonable. Even if we assume that the $1 is for ten years (length of the study) the order of magnitude for the cost of equity ke in the case of cash is the same. For dividends, it ranges from 0,37% to 21,20%; for cash, it ranges from 105,20% to 343,80%.
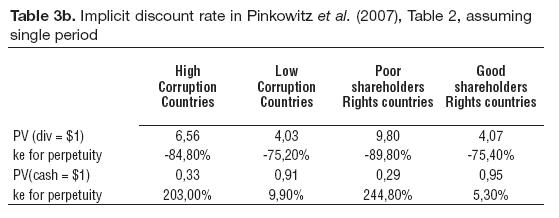
If one assumes that those coefficients are related to one period and not to a perpetuity, one obtains the results shown in Table 3b. In these cases we can see that the implicit discount rate for one period has huge differences between cash and dividends. We can say in general that the market punishes cash (compared with dividends) as seen by the discount rate, which is much greater than the discount rate for dividends.
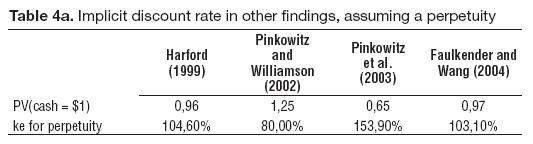
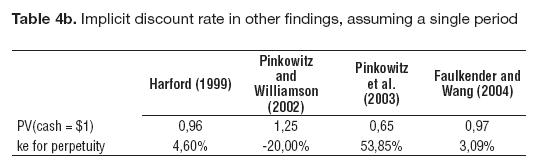
In Table 4a some findings are shown, assuming a perpetuity: Pinkowitz and Williamson (2002) imply an average discount rate of 80% (1/1,25); according to Pinkowitz et al. (2003), one dollar is worth 0,65, so that the discount rate would be 153,85%; according to Faulkender and Wang (2004, p. 23) dollar is worth 0,97 (discount rate: 103,10%); according to Harford (1999), the value of one dollar in cash is 0,956 (discount rate: 104,60%). The discount rates shown are very high and unusual and might be interpreted as something undesirable to the market. In any case, one can only infer that dividends create much more value than cash, not that cash is positively evaluated (results for a single period are shown in Table 4b).
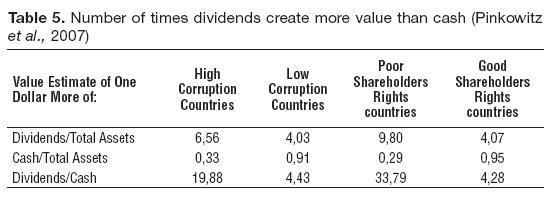
Furthermore, Table 5 shows that dividends are between 20 and 34 times more relevant than cash in value creation in bad countries and about 4 times more relevant than cash in good countries.
As the saying goes: whether a glass is half full or half empty depends on the attitude of the person looking at it. Those who see the glass half full might say: this is a proof that cash creates value and hence should be included in the cash flows. Others (and we are in this number) see the glass half empty and say: the market is adverse to potential dividends because it discounts them with a huge rate, so trying to keep their value down to zero. Hence, they should not be included as cash flow because this is counter to evidence and overstates the value of the firm.
The findings presented in Pinkowitz and Williamson (2002) and Pinkowitz et al. (2007) just suggest that (changes in) liquid assets should not be included in the FCF or CFE because they inflate the value of the firm. The meaning of the above mentioned results is that one dollar in liquid assets creates less than one dollar in value and that liquid assets or potential dividends are something not desirable by investors.
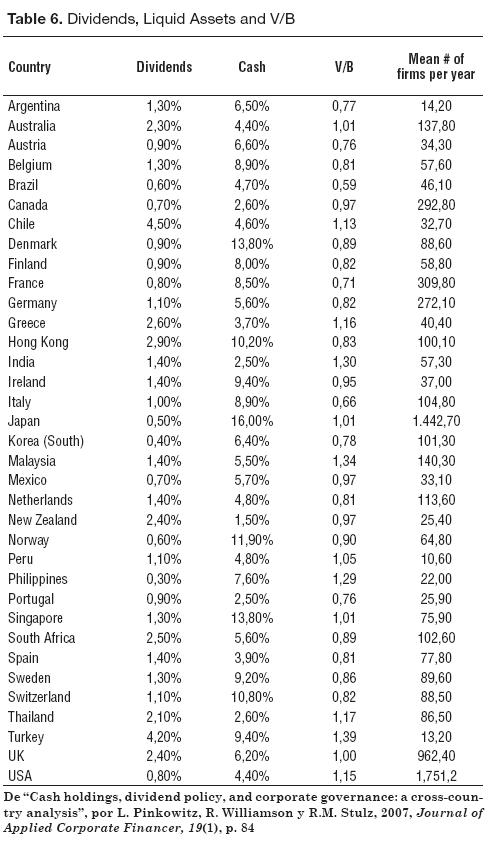
Using the aggregate data from Pinkowitz et al. (2007) and without splitting the sample between good and bad countries, one finds that one extra dollar of cash is valued at zero by the market. This is an average, and it compares with the above mentioned findings. The data from Pinkowitz et al., represent evidence of this fact. Data cover ten years (1988- 1998) for 35 countries with some exceptions such as India, Philippines, Turkey and Peru. This means that they had near 69.000 observations. The values in Table 6 are the mean of the medians for each variable for each country. Market Value to Book Value (V/B) is the sum of market equity value plus book value of debt divided by book value of assets. Dividends and liquid assets are the percent of those items in the balance sheet on Total assets. The liquid assets are not calculated individually but they are added (Pinkowitz et al. use the term Cash).
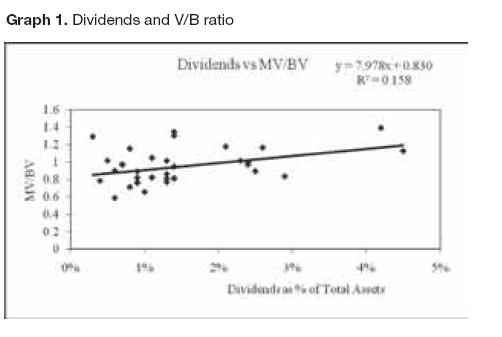
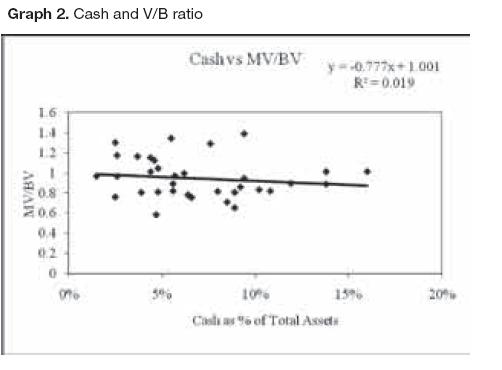
Using the aggregated data shown in Pinkowitz et al. (2007) we have run several regressions between V/B, Cash and Dividends. V/B is the dependent variable and the other two are independent variables. The aggregated data we have used are shown in Table 6. We depict the scattered data for each pair of independent and dependent variables: in Graph 1 we can observe a trend: the higher the dividend, the higher the V/B. In Graph 2 the reader can observe a slight downward trend: the higher the cash level, the lower the ratio V/B. Notice that the three variables are scaled or normalized by book value of total assets. This means that one may compare firms of different size and from different countries and years.
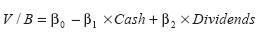
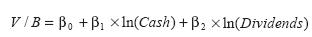
We have analyzed eighteen regression models with the following structure:
1. Lin Lin model with the following structure:
2. Log Log model with the following structure:

3. Lin Log model with the following structure:
4. Lin Lin Log model with the following structure:

5. Log Lin Log model with the following structure:

We are aware that the model lacks good specification because there are other variables that have to be included, it is based on aggregated data and it does not represent the true universe studied by Pinkowitz et al. (2007). This exploration only gives hints and trends.
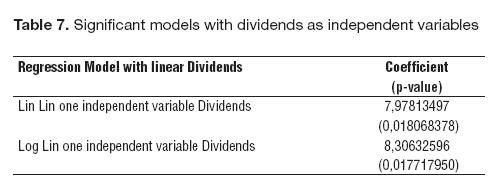
After the regressions have been run, significant models are only those with the independent variable Dividends in linear form. This means linear (Lin Lin) and semi logarithmic (Log Lin) models. In particular, the only significant variable is Dividends. In Table 7 we summarize the statistical analysis. We expected to find that the relationship between V/B and CFE (dividends) be linear, because Miller and Modiglianis valuation model is linear (see eq. (16) in section 5). And as is suggested by Table 7, the results in terms of statistical significance corroborate the linearity between value and CFE. In particular, one dollar in dividends creates about 8 dollars in value (see Graph 1). We are aware that this analysis is rather restricted because we are dealing with aggregated data and not with the raw data Pinkowitz et al. (2007) worked with. Another restriction is related to the interpretation of the results. Admittedly, we do not have full information regarding the specific model used in each case of the report. For instance, we do not know whether cash refers to change in cash or level of cash, or if it is located at a different (future) period compared with the firms market value. This is actually critical if we are interested in defining the coefficient of the independent variable as the increase in value for each extra dollar in the variable.
5. MOVING FORWARD: A PROPOSAL FOR FUTURE TESTS
The previous sections have shown that change in liquid assets must not be included in the notion of CFE. However, future research should bring corroboration to the idea that the market do not positively value change in liquid assets. Armed with the theoretical toolbox we have developed in section 1, this last section proposes a model for tests, which, we expect, will add empirical evidence. The model is based on standard results of corporate financial theory and, in particular, on Modigliani and Miller (1963). We use the following equation:
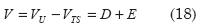
where V is the value of the levered firm, VU is the value of the unlevered value, VTS is the value of tax savings, D is the market value of debt (assumed to be equal to its book value) and E is market value of equity. The cash flow paid to the investors is related to CFE as follows:

where TS is Tax Savings (or Tax Shield), CFD is the Cash Flow to Debt and CCF is the Capital Cash Flow (Ruback, 2002). From eqs. (18)-(19), and using the fact that D is the present value of CFD,
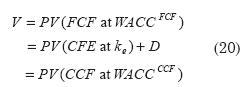
where PV is present value, WACCFCF is the Weighted Average Cost of Capital for the FCF, ke is the levered cost of equity, D is the market value of debt (we assume nominal debt equal to market value of debt), and WACCFCF is the Weighted Average Cost of Capital for the CCF (i.e. pretax WACC). Hence,
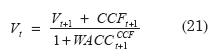
Using eqs. (3) and (19) and the relation CFDt+1 = It+1 – dDt+1, eq. (21) becomes
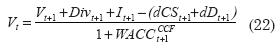
where, as seen, the variation in capital stock dCSt+1 is obtained as difference between new equity investment and shares repurchases occurred in the year. If markets positively valued changes in liquid assets, then the levered value of the firm, as empirically evidenced by the market, would not be the theoretically correct eq. (22), but would be as in equation 23 (see end of page).
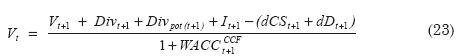
which differs from eq. (22) for the fact that change in liquid assets Divpot (t+1) are included in the valuation formula. We expect to find that in eq. (23) Divpot are of no value, or, as a weaker thesis, that the value of Divpot is much lower than dividends actually paid to shareholders.
For the implementation of the test, we will need to collect information which is usually publicly available:
D Financial debt (book value as a proxy of market value)
NS # shares in the market
Pr Market price per share
V Firm value = # shares × Market Price + debt (book value) = NS × Pr + debt
I Interest payments
CS (cumulated) capital stock contributed by shareholders
Div Dividends paid in cash
C Cash
STI Short-term investments (marketable securities)
B Book value of total assets
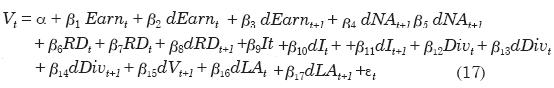
In order to normalize the data and avoid problems of size, currency, time, etc., we will divide each variable by the book value of total assets in t, in the same way Pinkowitz et al. (2007) do. As all variables will be divided by book value of total assets, the ratio V/B represents Tobins Q. These independent variables are the proxies for components of equation (23). While Pinkowitz et al. do not include payments of debt, we will include them, and, tentatively, we will not include variables that they include, such as R&D expense. Hence, our econometric model will be (for each firm)

Where all variables are now meant to be divided by book value of assets. With this model, the value of the firm depends on the cash flows the owners of equity and debt expect to receive in the future and on potential dividends as well. Each of the elements of this model attempts to capture investors expectations on future cash flows and value. As all variables are divided by total assets we have Tobins Q as the dependent variable, while the independent variables will be a percent of total assets in t. With this model we attempt to measure how much value is created for a given value and cash flows in the following period. An alternate model is

Where a proprietary approach is followed, and where Et is measured as number of shares times market price per share (we will use data from Latin American countries). Given that eq. (25) requires less information, we intend to use the latter when validating data.
While the two models in eqs. (24)-(25) are consistent with standard finance theory, we do not intend to claim that they are fully explanatory nor to make use of them for forecasting purposes. The models are meant to provide information on the relevance of the independent variables, in particular the relevance/irrelevance of Divpot (t+1) to value creation. To this end, the various betas are to be interpreted as the discount factors for the independent variables. In particular, ß6 is the discount factor for change in liquid assets, i.e. it represents the value at time t of one dollar of Divpot (t+1) available at time t+1.
Our hypothesis may be phrased in a strong or in a soft version:
Strong version: We expect β6 to be statistically zero (or close to zero). This means that investors try to set down the value of Divpot (t+1) by discounting it with an infinite or at least at a very high discount rate, because they do not consider (undistributed) potential dividends relevant for valuation. Another condition might be that β6 be negative and this would mean that potential dividends destroy value.
Soft version: We expect Divpot (t+1) to be evaluated much less than actual dividends. In econometric terms, we expect Β6 to be much smaller than Β5.11
If our hypothesis will be corroborated (as already implied by both modern finance theory and the reported empirical findings), the practice of assuming that liquid assets are part of the cash flows will be (not only theoretically but also) empirically refuted.
6. CONCLUSIONS
Economics, and in particular, financial economics provide rigorous theoretical tools for valuing assets. The theory is clear in stating that the value of an asset depends on the cash flow actually received by investors, not on the cash flows that could be received, unless undistributed potential dividends are invested in zero-NPV activities and their full present value is distributed to shareholders (DeAngelo and DeAngelo, 2006, Magni, 2007). But if, historically, the firm has not distributed all the available cash, there is no reason to assume that in the future it will be different. While some authors correctly recognize that only cash flow paid to shareholders should be used for equity valuation (DeAngelo and DeAngelo, 2007; Fernández, 2002, 2007; Shrieves and Wachowicz, 2001; Tham and Vélez-Pareja, 2004; Vélez- Pareja, 1999a, 1999b, 2004, 2005a, 2005b), several authors in applied corporate finance and a large part of practitioners include use potential dividends for computing a firms equity value (e.g. Benninga and Sarig, 1997; Copeland et al., 1994, 2000; Damodaran, 1999, 2006a, 2006b) This document aims at showing that the practice of adding liquid assets to cash flows actually paid is at odds with finance theory and seems to be inconsistent with empirical findings. Cash Flow to Equity should be defined as dividends paid minus net capital contributions, i.e. dividends plus shares repurchases minus new equity investment.
The issue is tackled in the document in three ways: economic, logical, and empirical. Economically, several reasons are given which confirm that only actual cash flows are relevant in valuation; logically, three formal proofs are provided that make use of the CAPM, of the basic tenet in valuation theory, and of arbitrage theory; empirically, recent findings in the literature are analyzed (among which Pinkowitz et al., 2007) from which evidence is drawn that market values cash holdings much less than dividends paid. An interpretation of these findings is that the market does not consider potential dividends a value driver.
The main conclusion from this work is that practitioners and teachers should abandon the practice to not include liquid assets in the working capital when calculating cash flows. Further empirical work will be done with a model that is rigorously deducted from the theory (in particular, from Modigliani and Millers approach to valuation).
FOOTNOTES
1. Este documento fue seleccionado en la convocatoria para enviar artículos, Call for Papers, realizada en el marco del Simposio Análisis y propuestas creativas ante los retos del nuevo entorno empresarial, organizado en celebración a los 30 años de la Facultad de Ciencias Administrativas y Económicas de la Universidad Icesi y de los 25 años de su revista académica, Estudios Gerenciales; el 15 y 16 de octubre de 2009, en la ciudad de Cali (Colombia). El documento fue presentado en las sesiones simultáneas del área de Finanzas.
2. Professor Tom Copeland in a private correspondence says (August 8, 2004): If funds are kept within the firm you still own them -- hence potential dividends are cash flow available to shareholders, whether or not they are paid out now or in the future.
3. The authors we analyze (Damodaran, Copeland, etc.) do not give a clear and unambiguous definition of cash flow to equity/potential dividends.
4. Quotations from this author are taken from the SSRN, version 1997.
5. Henceforth, change in a variable y is defined as: dyt+1 = yt+1 – y
6. Eqs. (9)-(10) may obviously be written as:
CFEt+1 = NIt+1 + Depreciationt+1 – Investment in fixed assetst+1 – dWCt+1 – dDt+1
CFEt+1 = NIt+1 + Depreciationt+1 – Investment in fixed assetst+1 – dWCt+1 – dDt+1
7. It is worth noting that the definition of potential dividend is ambiguous in corporate finance textbook, because ordinary language and numerical examples are used instead of rigorous formalism, and there is no standard terminology across writers, so increasing problems of understanding.
8. This Latin sentence means names indicate what they mean.
9. Intuitively, people think of cash flows as net cash after adding inflows and subtracting all inflows. But inflows for capital providers are outflows for the firm.
10. Admittedly, potential cash flow is a linguistic contradiction, because if distribution does not occur, then the undistributed potential cash flow is not a cash flow at all, as previously seen.
11. See Table 3a and 3b in section 4 and the difference between discount rates.
BIBLIOGRAPHIC REFERENCES
1. Benninga, S.Z. and Sarig, O.H. (1997). Corporate Finance. A Valuation Approach. New York, NY: McGraw-Hill. [ Links ]
2. Brealey, R. and Myers, S.C. (2003). Principles of Corporate Finance (7th ed.). New York, NY: McGraw- Hill-Irwin. [ Links ]
3. Cash Management Fundamentals Professional Development Program. (2007). Northwestern University Website. Retrieved in November 21, 2007, from: http://www.scs.northwestern.edu/pdp/npdp/cmf/ [ Links ]
4. Copeland, T.E., Koller, T. and Murrin, J. (1990). Valuation: Measuring and Managing the Value of Companies. New York, NY: John Wiley & Sons. [ Links ]
5. Copeland, T.E., Koller, T. and Murrin, J. (1994). Valuation: Measuring and Managing the Value of Companies (2nd ed.). New York, NY: John Wiley & Sons. [ Links ]
6. Copeland, T.E., Koller, T. and Murrin, J. (2000). Valuation: Measuring and Managing the Value of Companies (3rd ed.). New York NY: John Wiley & Sons. [ Links ]
7. Damodaran, A. (1999). Applied Corporate Finance. A Users Manual. New York, NY: John Wiley & Sons. [ Links ]
8. Damodaran, A. (2006a). Damodaran on Valuation (2nd ed.). Hoboken, NJ: John Wiley & Sons. [ Links ]
9. Damodaran, A. (2006b). Valuation approaches and metrics: a survey of the theory and evidence. Available at SSRN: http://www.stern.nyu.edu/~adamodar/pdfiles/papers/valuesurvey.pdf (November). Originally published in Foundations and Trends® in Finance, 1(8), 693-784, 2005. [ Links ]
10. Damodaran, A. (2008). Equity instruments: Part I. Discounted cash flow valuation. Recuperado el 16 de febrero de 2008, de: www.stern.nyu.edu/~adamodar/pdfiles/eqnotes/packet1.pdf, (updated January 14, 2008). [ Links ]
11. DeAngelo, H. and DeAngelo, L. (2006). The Irrelevance of the MM dividend irrelevance theorem. Journal of Financial Economics, 79, 293–315. [ Links ]
12. DeAngelo, H. and DeAngelo, L. (2007). Payout policy pedagogy: what matters and why. European Financial Management, 13(1), 11- 27. [ Links ]
13. Faulkender, M.W. and Wang, R. (2004). Corporate financial policy and the value of cash (working paper). Available at SSRN: http://ssrn.com/abstract=563595 [ Links ]
14. Fernández, P. (2002). Valuation Methods and Shareholder Value Creation. San Diego, CA: Academic Press. [ Links ]
15. Fernández, P. (2007). Company valuation methods. The most common errors in valuation (working paper). Available at SSRN: http://ssrn.com/abstract=274973 [ Links ]
16. Harford, J. (1999). Corporate cash reserves and acquisitions. Journal of Finance, 54(6), 1969-1997. Available at SSRN: http://ssrn.com/abstract=2109 or DOI: 10.2139/ ssrn.2109. [ Links ]
17. Jensen, M.C. (1986) Agency cost of free cash flow, corporate finance, and takeovers. American Economic Review, 76(2), 323-329. Available at SSRN: http://ssrn.com/abstract=99580 or DOI: 10.2139/ssrn.99580. [ Links ]
18. Lorie, J.H. and Savage, L.J. (1955). Three problems in rationing capital. Journal of Business, 28, 229–239. Reprinted in E. Solomon (Ed.), 1959, The Management of Corporate Capital. Glencoe, IL: The Free Press. [ Links ]
19. Magni, C.A. (2007). Relevance or irrelevance of retention for dividend policy irrelevance (working paper). Available at SSRN: http://ssrn.com/abstract=1027401 [ Links ]
20. Mikkelson, W.H. and Partch, M. (2003). Do Persistent Large Cash Reserves Lead to Poor Performance? (working paper). Available at SSRN: http://ssrn.com/abstract=186950 or DOI: 10.2139/ssrn.186950. A final version of this paper was published as: Do Persistent Large Cash Reserves Hinder Performance? in Journal of Financial and Quantitative Analysis, 38(2), 275-294. [ Links ]
21. Miller, M.H. and Modigliani, F. (1961). Dividend policy, growth and the valuation of shares. The Journal of Business, 34(4), 411- 433. [ Links ]
22. Modigliani, F. and Miller, M.H. (1958). The cost of capital, corporation taxes and the theory of investment. American Economic Review, 47, 261-297. [ Links ]
23. Modigliani, F. and Miller, M.H. (1963). Corporate income taxes and the cost of capital: a correction. American Economic Review, 53, 433-443. [ Links ]
24. Nau, R.F. and McCardle, K.F. (1991). Arbitrage, rationality, and equilibrium. Theory and Decision, 31(2-3), 199-240. [ Links ]
25. Opler, T.C., Pinkowitz, L., Stulz, R.M. and Williamson, R. (1999). The determinants and implications of corporate cash holdings. Journal of Financial Economics, 52(1), 3- 46. Available at SSRN: http://ssrn.com/abstract=225992 [ Links ]
26. Penman, S. (1992). Return to fundamentals. Journal of Accounting, Auditing and Finance, 7, 465-483. Reprinted in R. Brief and K.V. Peasnell (Eds.), Clean Surplus: A Link Between Accounting and Finance. New York and London: Garland Publishing. [ Links ]
27. Penman, S. (2007). Financial Statement Analysis and Security Valuation (3rd ed.). New York, NY: McGraw-Hill. [ Links ]
28. Penman, S. and Sougiannis, T. (1998). A comparison of dividends, cash flow, and earnings approaches to equity valuation. Contemporary Accounting Research, 15(3), 343- 383. [ Links ]
29. Pinkowitz, L., Stulz, R.M. and Williamson, R. (2003). Do firms in countries with poor protection of investor rights hold more cash? (Dice Center Working Paper No. 2003-2029). Available at SSRN: http://ssrn.com/abstract=476442or DOI: 10.2139/ssrn.476442. [ Links ]
30. Pinkowitz, L. and Williamson, R. (2002). What is a dollar worth? The market value of cash holdings (working paper). Available at SSRN: http://ssrn.com/abstract=355840 or DOI: 10.2139/ssrn.355840. [ Links ]
31. Pinkowitz, L., Williamson, R. and Stulz, R.M. (2007). Cash holdings, dividend policy, and corporate governance: a cross-country analysis. Journal of Applied Corporate Finance, 19(1), 81-87. [ Links ]
32. Ruback, R. S. (2002). Capital cash flows: a simple approach to valuing cash flows. Financial Management, 31(2), 85-103. [ Links ]
33. Schwetzler, B. and Carsten, R. (2003). Valuation effects of corporate cash holdings: Evidence from Germany (HHL working paper). Available at SSRN: http://ssrn.com/abstract=490262 [ Links ]
34. Shrieves, R.E. and Wachowicz, J.M. (2001). Free Cash Flow (FCF), Economic Value Added (EVA), and Net Present Value (NPV): A Reconciliation of Variations of Discounted-Cash-Flow (DCF) Valuation. The Engineering Economist, 46(1), 33-52. [ Links ]
35. Smith, J.E. and Nau, R. (1995). Valuing risky projects: option pricing theory and decision analysis. Management Science, 41(5), 795- 816. [ Links ]
36. Tham, J. and Vélez-Pareja, I. (2004). Principles of Cash Flow Valuation. Boston, MA: Academic Press. [ Links ]
37. Varian, H.R. (1987). The arbitrage principle in financial economics. The Journal of Economic Perspectives, 1(2), 55-72. [ Links ]
38. Vélez-Pareja, I. (1999a). Construction of free cash flows: a pedagogical note. Part I (December) (working paper). Available at SSRN: http://ssrn.com/abstract=196588 [ Links ]
39. Vélez-Pareja, I. (1999b). Construction of free cash flows: a pedagogical note. Part II (December) (working paper). Available at SSRN: http://papers.ssrn.com/sol3/papers.cfm?abstract_id=199752 [ Links ]
40. Vélez-Pareja, I. (2004). The correct definition for the cash flows to value a firm (free cash flow and cash flow to equity) (September 30) (working paper). Available at SSRN: http://ssrn.com/abstract=597681 [ Links ]
41. Vélez-Pareja, I. (2005a). Once more, the correct definition for the cash flows to value a firm (free cash flow and cash flow to equity) (working paper). Available at SSRN: http://ssrn.com/abstract=642763 [ Links ]
42. Vélez-Pareja, I. (2005b). Construction of cash flows revisited (working paper). Available at SSRN: http://papers.ssrn.com/sol3/papers.cfm?abstract_id=784486 [ Links ]

