


Services on Demand
Journal
Article
 English (pdf)
 Article in xml format
 Article references
 Send this article by e-mail
Indicators
-
 Cited by SciELO
 -
 Access statistics
Related links
-
 Cited by Google
 -
 Similars in
SciELO
Similars in
SciELO -
 Similars in Google
Share

 Permalink
Estudios Gerenciales
Print version ISSN 0123-5923
estud.gerenc. vol.26 no.115 Cali Apr./June 2010
EVIDENCE OF ACTIVE MANAGEMENT OF PRIVATE VOLUNTARY PENSION FUNDS IN COLOMBIA: A PERFORMANCE ANALYSIS USING PROXY ETFs1
EDGARDO CAYÓN FALLÓN*1, TOMÁS RICARDO DI SANTO ROJAS2, CAMILO RONCANCIO PEÑA3
1Master in Business Administration, McGill University, Canada. Profesor Asociado Finanzas, Colegio de Estudios Superiores de Administración (CESA), Colombia Dirigir correspondencia a: Calle 35 No. 6-16 Casa Fundadores, Bogotá, Colombia. ecayon@cesa.edu.co
2Especialista en Finanzas Corporativas, Colegio de Estudios Superiores de Administración (CESA), Colombia. Analista Financiero, Banco Santander, Colombia. tdisantorojas@santander.com.co
3Especialista en Finanzas Corporativas, Colegio de Estudios Superiores de Administración (CESA), Colombia. Consultor, Blooming Trading S.A. C.I., Colombia. camilo.r@etb.net.co
* Autor para correspondencia.
Fecha de recepción: 26-01-2009 Fecha de corrección: 01-09-2009 Fecha de aceptación: 13-04-2010
ABSTRACT
The purpose of this study is to find evidence that shows that either active management of private pension funds in Colombia actually adds value to the investors or, on the contrary, investors would achieve better results if they invested in passively managed products such as, for example, an ETF (Exchange Trade Fund). After conducting a review of data available from 30 different private pension funds in Colombia and 30 ETFs that had similar investment goals to these portfolios, our findings reveal that, using common performance indicators, a Colombian investor would have a better ROI by investing in passively managed products (ETFs) than in portfolios currently offered by voluntary pension funds in Colombia.
KEYWORDS
Portfolio performance, active management, voluntary pension market in Colombia
JEL Classification: G1, G10, G11
RESUMEN
Evidencia de la gerencia activa de los portafolios de los Fondos Voluntarios de Pensiones en Colombia: Un análisis de desempeño utilizando ETFs proxy
El propósito del presente estudio es encontrar evidencia de que la gerencia activa de los portafolios administrados por los fondos privados de pensiones en Colombia realmente agrega valor a los inversionistas, o si por el contrario dichos inversionistas obtendrían mejores resultados invirtiendo en un producto de gerencia pasiva como los ETFs. Después de analizar los datos de 30 portafolios administrados por los fondos de pensiones en Colombia y de 30 ETFs que tuvieran objetivos de inversión similares a estos portafolios, el resultado obtenido fue que bajo medidas comunes de desempeño, el inversionista colombiano obtendría mejores rentabilidades invirtiendo en productos de gerencia pasiva (ETFS) que en los portafolios que ofrecen actualmente los fondos de pensiones voluntarias en Colombia.
PALABRAS CLAVE
Desempeño de portafolios, gerencia activa, fondos voluntarios de pensiones en Colombia
RESUMO
Evidência de uma gestão ativa das carteiras de Fundos Voluntários de Pensão na Colômbia: Uma análise de desempenho usando ETFs proxy
O objetivo deste estudo é encontrar evidências de que a gestão activa das carteiras geridas por fundos de pensões privados na Colômbia realmente agrega valor para os investidores, ou se, pelo contrário o investidor poderia obter melhores resultados investindo em produtos de gestão passiva, como os ETFs. Após analisar os dados a partir de 30 carteiras geridas por fundos de pensão na Colômbia e 30 ETFs que tiveram objetivos de investimento semelhantes a estas carteiras, o resultado obtido foi que, no âmbito das medidas comuns de desempenho, o investidor colombiano obteria um melhor retorno sobre o investimento em produtos de gestão passiva (ETFS) do que nas carteiras que oferecem atualmente os fundos de pensões voluntários na Colômbia.
PALAVRAS CHAVE
Desempenho de carteiras, gestão ativa, fundos voluntários de pensões na Colômbia
INTRODUCTION
One of the main reasons why investors invest in a particular kind of risky asset is to seek a higher rate of return rather than the one they can obtain by investing in a safer asset. Is not a secret that individual investors tend to diversify risk by holding a portfolio in the hope that the gains obtained by a particular stock or bond can offset the losses of others assets that are part of the investor´s portfolio. Given the fact that investing in financial assets involves a considerable amount of risk and that is why for the average individual investor the cost of owning and structuring a diversified portfolio is quite prohibitive, the common practice in that the individual investor seeks the help of specialized institutions that offers a range of managed portfolios (usually called mutual funds), where the investor can invest in tailored products according to his specific needs.
Of course these institutions charge a fee to the investors in return of the services offered, they usually engage in the process of active management which means that they use their clients money to buy and sell securities in a frequent basis in order to beat a specific benchmark, such as a market or specific sector index, so they can obtain a higher return than the one observed for the benchmark in a similar period of time.
In Colombia there are different kinds of institutions that offer these services, being the Colombian private pension fund the most important one, if the value of assets under management is taken into account. However, given the myriad of financial innovation in recent years it is now possible for the individual investors to invest directly in products that mimic or replicate the returns of the most popular market indices or particular sector indices at a relatively low cost and without the risks involved in active management. These products are commonly known in the industry as Exchange Traded Funds (ETFs). Therefore, the purpose of the present paper is to find evidence that the Colombian private pension funds obtain higher returns for their clients than the ones that can be obtained by investing passively in replicating benchmark products such as ETFs.
1. BACKGROUND
1.1. What are ETFs?
An ETF is very similar to a mutual fund, basically because both hold a portfolio of securities. The main difference between the two of them is that an ETF can be sold and bought as any common stock throughout the business day, whereas the net asset value (NAV) units of a mutual fund portfolio is calculated at the end of the day. This means that any transaction of a particular investor involving the selling and buying of NAV units of a mutual fund usually takes a business day in order to be effective, as opposed to an ETF transaction that can be done immediately at market prices (Gastineau, 2001). The first ETF was created in 1993 and was traded at American Stock Exchange (AMEX). An ETF share is simply a common stock that gives ownership over a pool of assets deposited in a trust. The process of creating an ETF is quite simple, it begins when a financial institution buys a portfolio of securities and deposits them with a third party, the trustee. As a separate legal entity, the trustee can then issue commons stocks based on the value of the securities under custody and these commons stocks are given back to the financial institution that owns the portfolio so they can be traded to a third party of investors as ETF shares (Poterba and Shoven, 2002).
One of the main features of ETFs is that most of them are designed to track a specific market or economic sector index. This feature is of paramount importance because it allows the individual investor to hold a stock that is a diversified portfolio itself with the features of a common stock transaction. This means that the investor can buy the ETF on margin or sell the ETF according to market perception. For example the Powershares QQQ (Ticker: QQQQ) ETF holds all the stocks that compose the NASDAQ-100 and the returns on its shares is highly correlated with the one of the index. However, most ETFs like equity mutual funds suffer from what is called a tracking error which means that the ETFs are not perfectly correlated with the indices they are supposed to replicate. However, for practical investment purposes the correlation tends to be quite high, and most of the differences can be explained by the operating expenses charged by the ETF administrator and the bid-ask spread on trading days (Poterba and Shoven, 2002).
The growth of the ETF industry is quite overwhelming, in 1995 there were only two ETFs available to investors managing one billion in assets, by the year 2006 this figure had grown to 335 billion assets distributed in more than 263 ETFs that covered a wide variety of market and sector indices as well as commodities benchmarks (NYSE, 2006). One of the factors that can explain the increasingly popularity of ETFs is the fact that the administrators of these kind of products act as passive managers which means that they only buy and sell securities of the trust when the composition of the assets of the index that the ETF is trying to replicate changes for some reason, as opposed to mutual funds where the administrators act as active managers selling and buying stock in order to try to beat their respective investments benchmarks. This is why many investors see the ETFs as an investment alternative that allows them to hold a diversified portfolio at a low cost with an easy benchmark to follow, as opposed to the traditional mutual fund administrators whose fund returns can be affected negatively by bad timing and selectivity decisions by the fund manager.
1.2. The Colombian private pension fund industry
In Colombia the private pension fund industry is quite recent compared with industrialized countries. It was just until 1993 that private pension fund companies in Colombia began their operations. Their growth in clients and assets under management is quite astonishing, in 1995 there were 1710.865 clients affiliated or roughly 34% of the active economic population at the time, and by 2007 the number of clients had grown to a staggering 7406.882 or 55% of the economically active population. In 1995 the assets of the funds totaled USD 262 million, by the end of 2007 the figure had grown to USD 25.732 billion2 (Asofondos, 2009). In Colombia the private funds have a series of legal restrictions regarding the type of securities in which they can invest, therefore all of the funds practically invest in the same kind of portfolio which is primary composed by public debt, dollar denominated debt and highly rated Colombian equity (Asofondos, 2006), therefore the returns of each fund tends to be very similar to the others, given that the basic composition of the portfolios in which the fund invest their clients money is basically the same. However, besides the basic pension product that is regulated by law, the funds are not restricted to offer their clientele a wide variety of mutual funds in which the previously mentioned restrictions do not apply, and in which the investor is free to choose which investment vehicle suits his objectives best. This is done with the purpose of providing the investors an opportunity to explore different kind of investment opportunities in the hope of increasing the amount of their savings in the fund of for short-term gains in speculative opportunities.
The main reason why Colombian investors prefer to invest in the mutual fund offered by the private pension fund companies rather than trough a brokerage firm relies on the fact that the amounts needed to invest are much smaller in the first one. Another reason is that for the economically active population, the investment can be done by direct discount on the persons payroll in a series of monthly installments which in turn helps the wage earner to reduce the amount of income tax that he has to be paid monthly based in the amount earned (this income tax is deduced directly from the person payroll by the employer who then transfers it directly to the government). It is important to mention that if an investor invest in a mutual fund trough its private pension company and keeps the investment for a period of five years the investor can gain the benefit of keeping the money that had been saved from paying a lower monthly income tax, if instead the investor decides to sell its investment at an earlier time he losses the tax benefit and has to pay the amount he owes to the government for the monthly savings he obtained by a reduced income tax. Usually the persons that invest in these kinds of products are the ones with the higher incomes and this alone can explain for the increasing demand of mutual funds administered by Colombian private pension fund companies. This demand is supported by their growth in clients and assets under management, in 1995 there were just 12.171 clients for this kind of products, by 2007 the number of clients grew to 340.905. In 1995 the assets of the mutual funds under management by Colombian private pensions companies totaled barely USD 37 million by the end of 2007 the figure grew to USD 3.308 billion3 (Asofondos, 2009). One distinctive feature is that most of the mutual funds managed by these companies are actively managed with a well defined investment objective. Therefore, the question to bear in mind is that if the mutual funds administered actively by these companies provide superior returns that passively managed products such as ETFs?
2. LITERATURE AND THEORETICAL REVIEW
The literature concerning the evaluation of mutual fund performance is mostly based in the assumptions stated by the Efficient Market Hypothesis (EMH). In its basic form, the hypothesis states that for the individual investor it is very difficult to beat the market (or a market portfolio) because all the publicly available information given to a group of competing investors is already fully priced in the particular securities that compose each investors portfolio, therefore since all the prices already reflects the market sentiment is impossible for an individual investor to obtain superior performance based on the same information that is also available to other competitors (Fama, 1970).
Of course this hypothesis is not popular among investors and portfolio managers whose job depends in providing results that beat the average market performance (Varami and Kalash, 2008). The empirical evidence concerning the EMH has been widely documented and with diverse results. The first studies concerning mutual fund performance provided support to the EMH.
One of the first studies was conducted by William Sharpe using a measure of total risk-return performance for 34 funds for the period between 1945 and 1953 that concluded that in average the funds underperformed the Dow Jones industrial index for the same period (Sharpe, 1966). These results were confirmed by Michael Jensen who used the Capital Asset Pricing Model (CAPM) in order to find the expected return for a set of mutual funds between the period of 1945 and 1964. By comparing the expected equilibrium return according to the CAPM and its deviation from the funds actual returns, the conclusion was that the vast majority of the funds observed had negative alphas.4 This particular finding implied that by that specific measure, the funds underperformed the market index for the period under observation (Jensen, 1968).
Also, by using a systematic riskreturn approach Jack L. Treynor came to the same conclusions than the previous studies found (Treynor, 1966). However, throughout the years several researchers have found evidence that contradicts some of the postulates of the EMH.
For example, certain studies have found statistical evidence that small capitalization mutual funds in the US have beaten the market benchmark on a risk-adjusted basis for the period between 1994-2007 (Varami and Kalash, 2008).
In the case of index mutual funds (a passively managed product with similar characteristics to open mutual funds), there is evidence that by using risk-adjusted and transaction cost measures, these index funds tend to perform better than actively managed funds on average (Frino and Gallagher, 2001).
On the other hand, the literature concerning the performance of ETFs is very scarce. The research conducted until know has been focused around the issues of liquidity and transaction costs. One of the studies on the subject points out that these products (ETFs) are not attractive to small investors due to higher transaction costs than the ones those investors will incur with index mutual funds (Dellva, 2001). Another study shows that ETFs allow investors to sell their investments at market prices at any point in time, which in a certain way offset the higher transaction costs that are associated with buying and selling ETFs shares (Kostovetsky, 2003).
On the international side little has been writen regarding ETFs, but about the performance of US based international equity mutual funds, one study concluded that these funds did not provided either individually or in average a performance that surpassed the return obtained by a benchmark equity index for the period observed between 1982-1988 (Cumby and Glen, 1990).
Although, there is not enough literature regarding the subject of market efficiency in the specific case of ETFs, is a fact that these products are usually tied to the performance of major market index. It is in this context, that the present study would seek proof if indeed the actively managed Colombian private pension mutual funds can outperform passive managed investments benchmarks which in this study would be ETFs.
For the purpose of this paper, the passive managed investment benchmarks would be chosen from the ETFs available in the market. The ETFs would be selected on the basis that their respective investment objectives are similar to those of the Colombian private pension mutual funds under study.
3. COMMON PERFORMANCE MEASURES
3.1. Sharpe ratio
This is one of the most widely used techniques for calculating the riskadjusted return of a portfolio or mutual fund. The reasoning behind the measure is that it allows the investor to perceive how many units of return there are per units of risk. (Sharpe, 1966) One of the criticisms surrounding this measure is that the standard deviation is a very naïve approach in measuring risk (Bogle J., 1998). The measure will also overestimate results in securities that not behave like the normal distribution. Besides these problems, the Sharpe ratio is still one of the most popular techniques for comparing risk-adjusted returns. The formula used to calculate the Sharpe ratio is:

Where Rp is the average return of the portfolio for a specific holding period, Rf is the proxy for the risk free rate for a specific holding period and σpis the standard deviation of the portfolio for a specific holding period. Generally having investments with a higher Sharpe ratio than their benchmarks is good. The logic being that with a higher Sharpe ratio, the investor is obtaining more units of returns per units of risk assumed.
3.2. Jensens alpha
The Jensen´s alpha evaluates the performance of an investment in terms of excess return over the theoretical return of the portfolio using the CAPM. Since the CAPM return is risk-adjusted, this means that for a higher risk we should expect a higher return. The measure is obtained by subtracting the actual return of a portfolio from the excepted return of that portfolio obtained using the CAPM. The result obtained is commonly known as the Jensen alpha (Jensen,1968). Therefore, a positive alpha means that the portfolio over performed relative to its theoretical expected return. On the contrary, a negative alpha means that the portfolio underperformed relative to its theoretical expected return. The formula used to calculate the Jensen´s Alpha is:
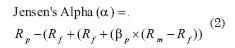
Where Rp is the average return of the portfolio for a specific holding period, Rf is the proxy for the average risk free rate for a specific holding period and ßp is the coefficient of regression of the portfolio as a dependent variable versus the market proxy as an independent variable for a specific holding period and Rm is the average for the proxy of market return for a specific holding period. One of the main problems of this measure is that the betas obtained tend to be unstable for different periods of time. This instability in beta can lead us to overstate the amount of systematic risk (very high betas) in periods of market turbulence. In the same way, unstable betas can lead us to understate the benefits of contrarian strategies (shorting the stock) in times of market turbulence (Jones and Yeoman, 2001).
3.3. Treynor ratio
The Treynor ratio is calculated practically in the same way as the Sharpe ratio, the main difference being that it uses the systematic risk of a particular portfolio as measured by βp as opposed to the portfolio variance which is used in the Sharpe ratio. It is primarily used to compare the performance of a particular sub-portfolio to the one of a larger portfolio of similar characteristics that is more diversified (in the sense that the larger portfolio holds more securities than the sub-portfolio that is under observation) (Treynor, 1996). The interpretation is the same as the Sharpe ratio but in units of systematic risk. The problems with this performance measure are very similar with the ones encountered using the Sharpe ratio or the Jensen´s alpha. The formula used to calculate the Treynor ratio is:

Where Rp is the average return of the portfolio for a specific holding period, Rf is the proxy for the risk free rate for a specific holding period and βpis the coefficient of regression of the portfolio as a dependent variable versus the market proxy as an independent variable for a specific holding period.
3.4. Modigliani and Modigliani (M-Squared) measure
The M-Squared measure is different from the other measures because it calculates the performance of a specific investment in terms of real returns rather than in units. Therefore the interpretation is straightforward in the sense that the investment with the highest M-Squared is the one with the best performance. This distinct attribute of the M-Squared measure makes it easier for the investor to make comparison between different investments. The formula used to calculate the M-Squared measure is:
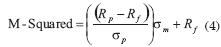
Where Rp is the average return of the portfolio for a specific holding period, Rf is the proxy for the risk free rate for a specific holding period and σp is the standard deviation of the portfolio for a specific holding period and σm is the standard deviation of the market proxy for a specific holding period (Modigliani, & Modigliani, 1997).
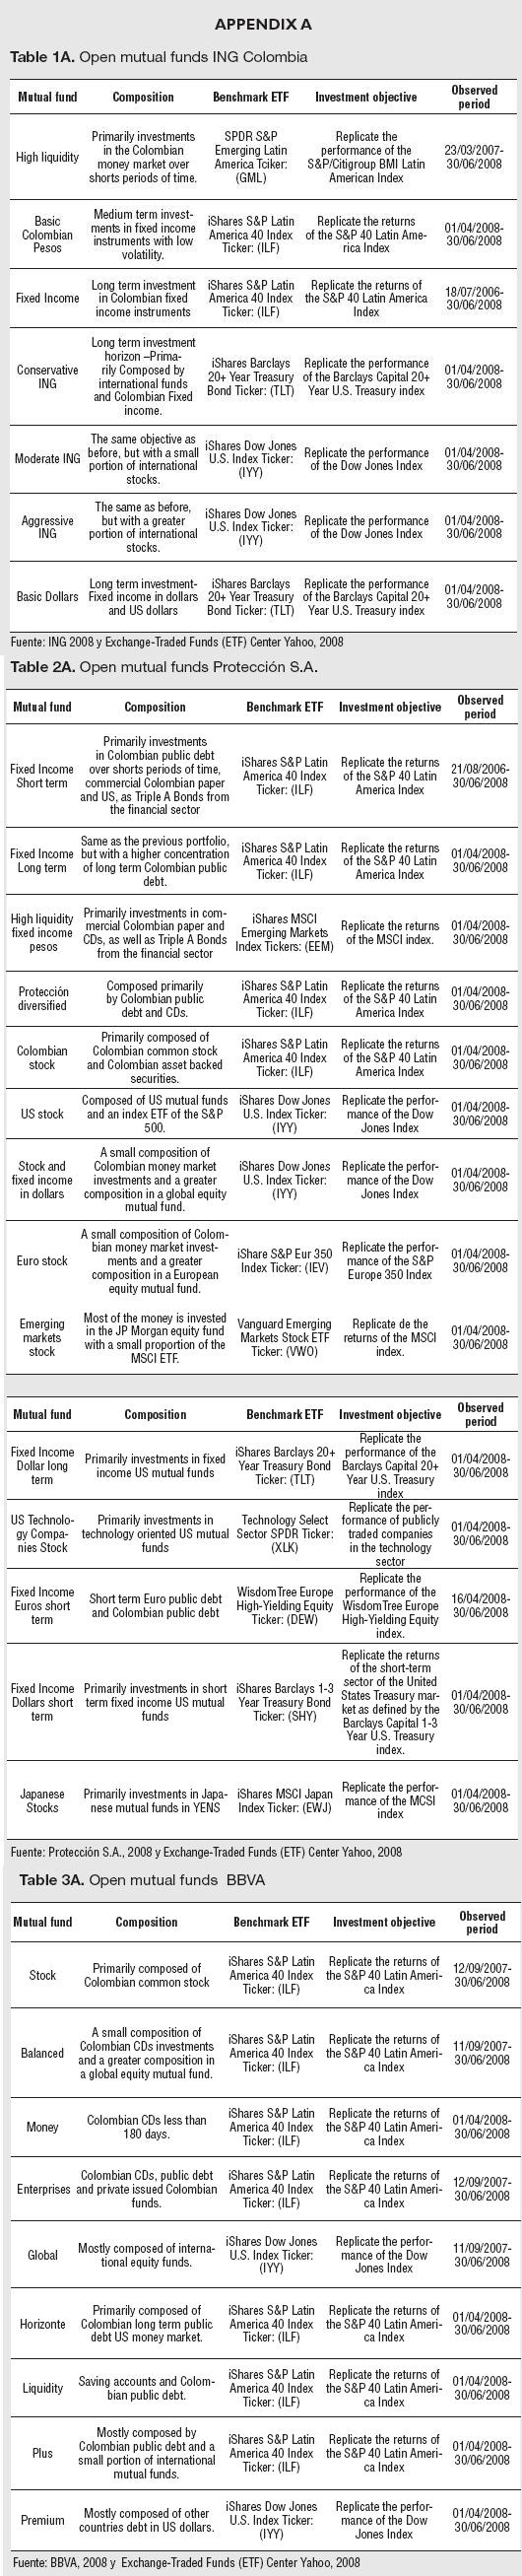
4. DATASET
The data for the study comes from three private Colombian pension funds companies. The data was gathered from 30 different open mutual funds with different investment objectives for an observed time period. By analyzing the portfolio composition of the Colombian mutual funds, a group of ETFs were selected to serve as benchmarks to those open mutual funds. The benchmark ETFs were selected on the basis that their respective investments objectives were similar to those of the assets of the open mutual funds under study. These similarities between compositions and investment objectives can be observed in Appendix A.
From the appendix is observed that the differences between the dates are mainly due to the fact that either the benchmark ETF or the Colombian mutual fund began their operations on that specific date. It is important to remember that ETFs are a rapidly expanding industry that just until recent years is catching up to the myriad of products offered by the US mutual fund industry.
5. METHODOLOGICAL ISSUES
In order to measure the actual performance for each fund under study relative to their benchmark ETF, the following adjustments were made to the data under study:
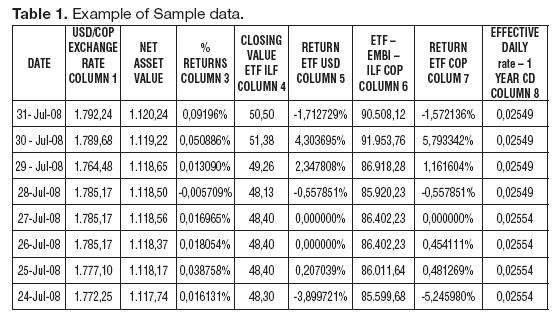
- Since the study is done from the Colombian investor point of view all the data was converted to Colombian pesos in order to take into account the variability of the USD/COP exchange rate.5
- For each ETF the closing price of a specific date was multiplied by the USD/COP exchange rate for that date (in Table 1., Column 1 multiplied by Column 4). The result of this operation is the value of an ETF share in COP (Column 6).
- The NAV for each fund is calculated at the end of the business day and is reported in Colombian pesos by the fund´s management (Column 2).
- The daily average proxy for the risk free rate was calculated using the weekly average for the one-year Cerificate of Deposit (CD) in the Colombian money market6 for the different periods of time under study (the average of Column 8 for an observed period).
- The Betas and the other descriptive statistics of the study were obtained by using the discrete daily returns for each of the time series under observation (a simple linear regression obtained by the returns exhibited in Column 5 as the independent variable and the ones in Column 7 as our dependent variable).
- The periods of observation are not long enough to obtain the Colombian tax benefit, so the returns can be comparable without this leverage effect.
The results of the study are obtained by calculating the common performance measures for both the Colombian private pension fund and comparing them with their respective benchmarks. The portfolio return and the market proxy return are obtained by the averages of Column 3 and Column 8 for the period under observation for each portfolio and ETF under study.
6. RESULTS
6.1. Mutual funds managed by ING
The results obtained for the funds managed by ING Colombia in comparison with their respective ETFs benchmark were the following:7
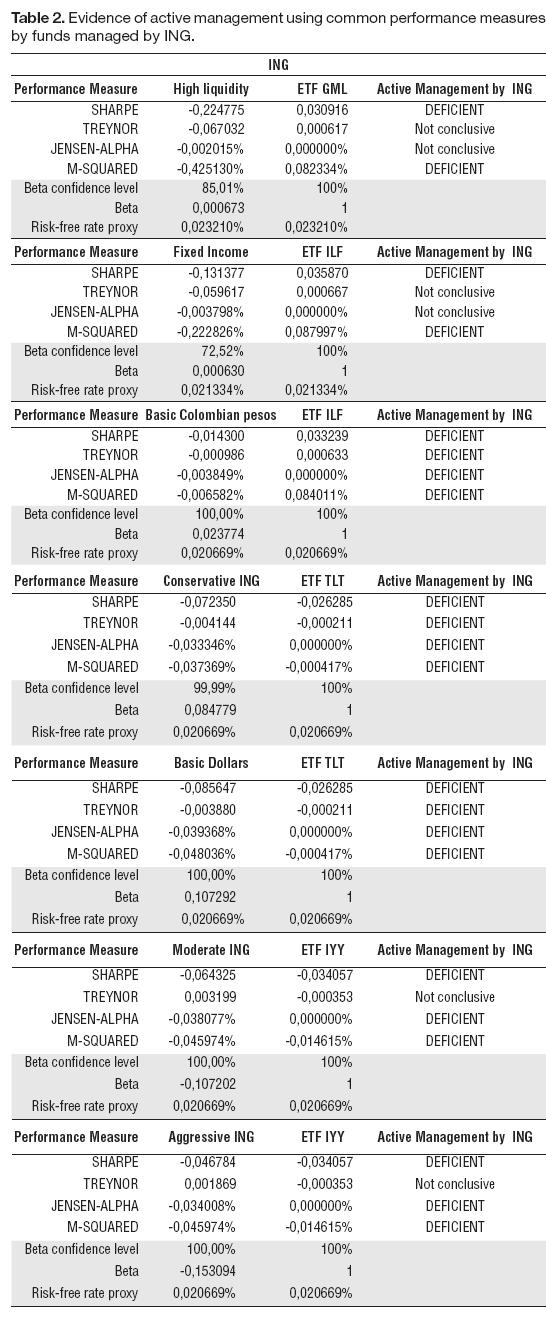
In the case of ING, two of the portfolios failed to reject the null hypothesis at the 95% confidence level that their respective betas have some relation with the benchmark (high liquidity and fixed income). Therefore, riskadjusted measures based on betas (Jensen and Treynor) cant be taken into account to do the analysis when the beta confidence level is below 95%. In the case of portfolios with negative betas (moderate and aggressive) the Treynor ratio is meaningless since it attributes negative performances with superior returns (Georges, 2005).
However by using variance measures such as the Sharpe ratio and M-Squared there is strong evidence that for the period under observation INGs active portfolio management did not provide superior returns to its investors.
6.2. Mutual funds managed by Protección S.A.
The results obtained for the funds managed by Protección Colombia in comparison with their respective ETFs benchmark were the following:
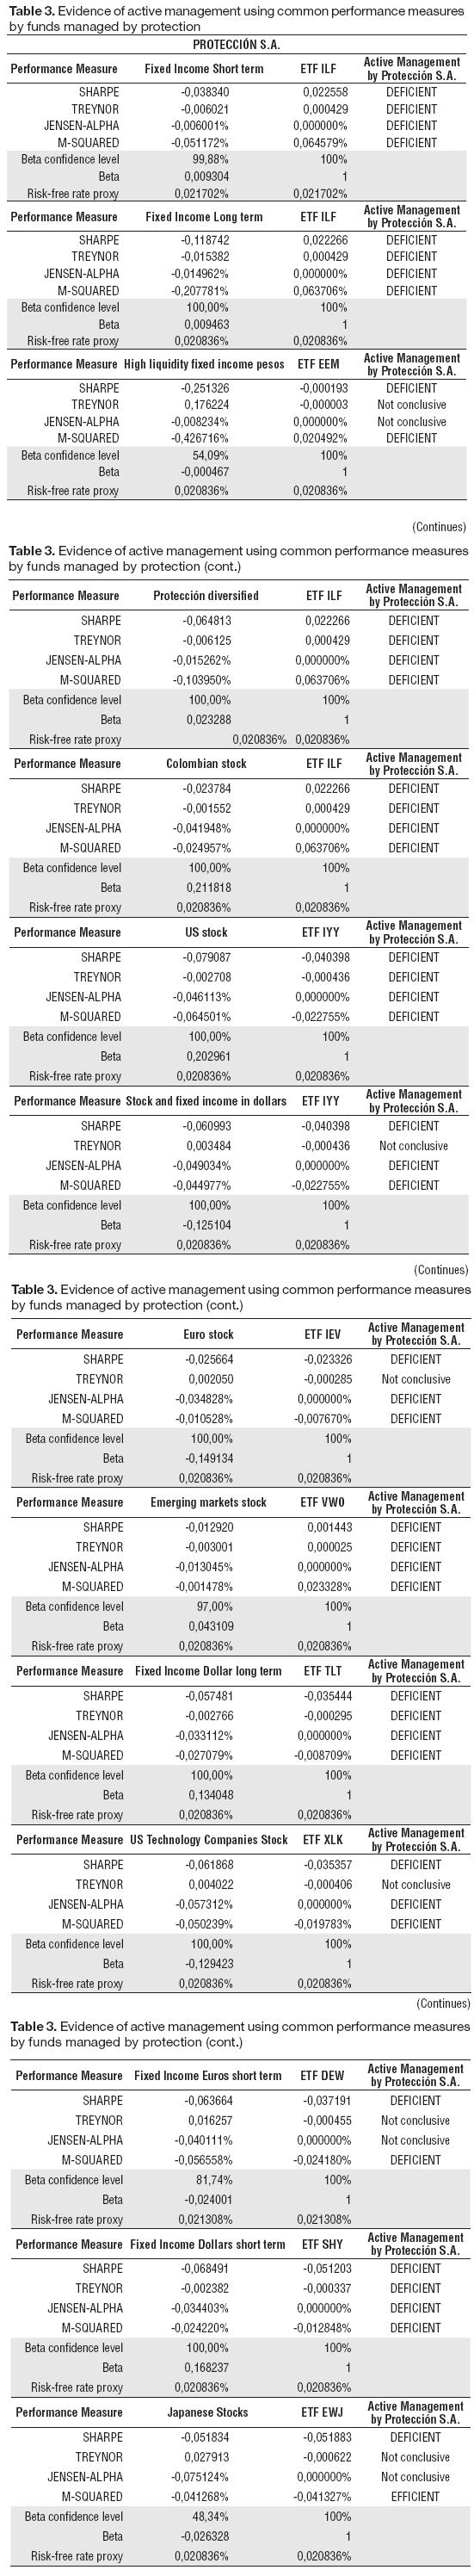
In the case of Protección S.A., it can be observed that nine of the mutual funds as well as eight of their respective benchmarks exhibited negative returns for the period under study (MSquared measure). Three of the portfolios failed to reject the null hypothesis that their respective betas have some relation with the benchmark. Another three portfolios also exhibit negative betas but with high confidence levels, this means that these three portfolios can be somehow inversely correlated with their respective benchmarks. However, there is evidence that in all of the active managed portfolios by Protección S.A., none of these funds were able to beat their respective benchmarks on a risk-adjusted basis for the period under study.
The only exception is the mutual fund of Japanese stocks, which exhibited a slightly better performance than its benchmark using the M-Squared measure. It is interesting that in eight cases the mutual funds and seven of their benchmarks exhibited negative returns (M-Squared). None of Protección mutual funds under the period of study was able to outperform the average risk-free rate for the same period.
6.3. Mutual funds managed by BBVA
The results obtained for the funds managed by BBVA Colombia in comparison with their respective ETFs benchmark were the following:
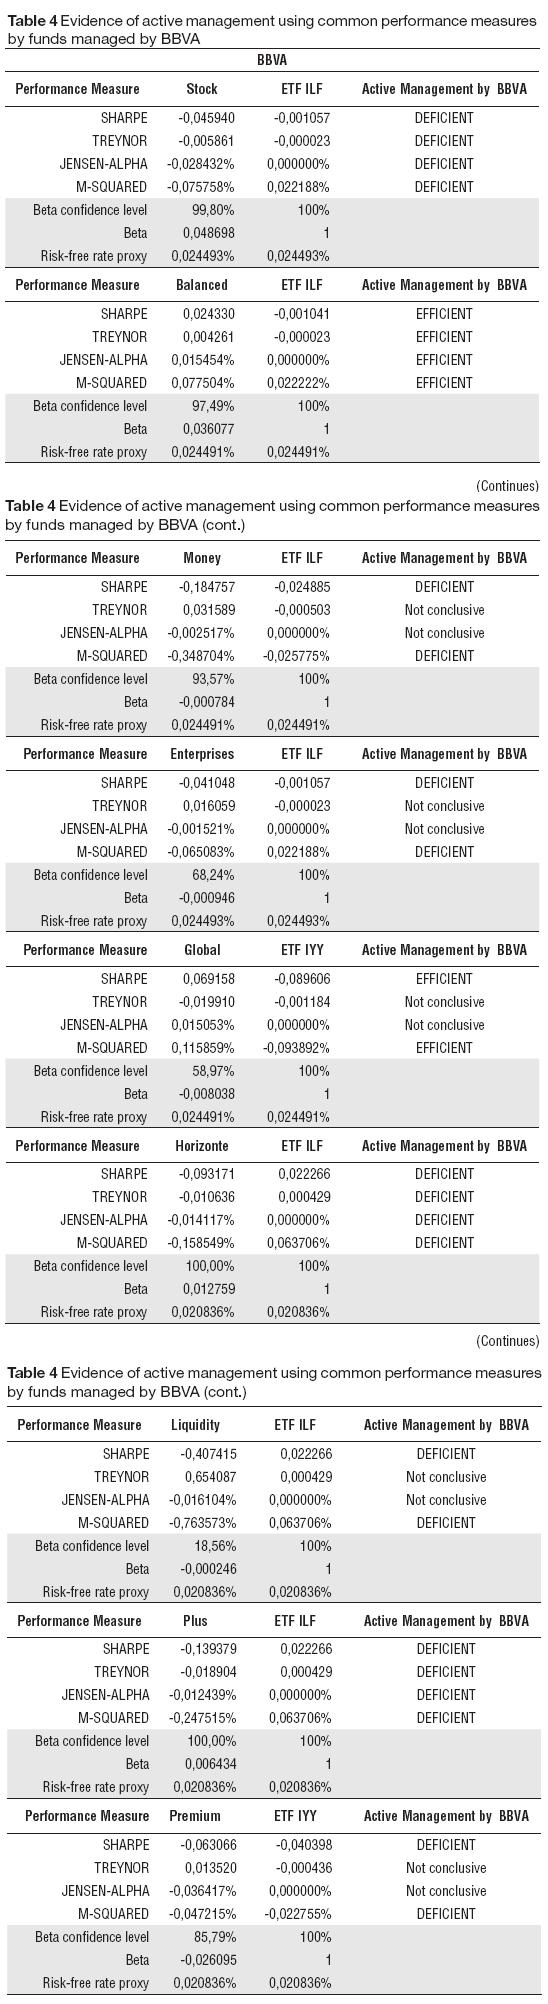
In the case of BBVA, it can be observed that just two of the mutual funds and three of the benchmarks exhibited negative returns for the period under study. Five of the portfolios failed to reject the null hypothesis that their respective beta has some relation with the benchmark. These five portfolios also have negatives betas. The rest of the portfolios have positive betas and rejected the null hypothesis at the chosen confidence level of 95%. As mentioned before, the Treynor ratio is useless in the case of the portfolios that exhibit negative betas.
Also it is important to mention that five of the portfolios managed by BBVA8 outperformed their benchmark in terms of absolute returns. However, there is evidence that just two of the nine actively managed portfolios by BBVA were able to beat their respective benchmarks on a risk-adjusted basis for the period under study. The balanced and global portfolios outperformed the benchmark in all performance measures, with the exception of the Treynor ratio in the global portfolio, which in this particular case is inconclusive due to the presence of a negative Beta that failed to reject the null hypothesis of no relationship between the variables.
7. CONCLUSIONS
After considering the results obtained in the study, there is evidence that by using common performance measures just two of the 30 Colombian mutual funds under study were able to beat a market benchmark on a risk-adjusted basis. These results are consistent with the empirical evidence found in the literature that in general and with a few exceptions active managers are able to outperform a market benchmark on a risk-adjusted basis. Therefore, a Colombian investor will be better off by investing in a passively managed ETF than in an actively managed Colombian private pension open mutual fund with similar investment objectives. However, there is evidence than in 10 of the 30 cases under study, the Betas of the mutual funds were statistically insignificant. This means that common performance measures such as the Jensens alpha and the Treynor ratio do not have enough statistical strength to be considered as meaningful performance measures in these specific cases. However, in the remainder cases the performances measures are statically found on a daily basis return. Finally, it is important to mention that since the ETFs and the Colombian private open mutual funds industries are relatively new, there is not enough data to conduct a study on a monthly basis which is the usual practice for this kind of research. The results obtained can set the ground for further research in the relevance and the role of active portfolio managers in Colombia as well as other topics regarding market efficiency in Colombia.
FOOT NOTES
1. This article is based on the data collected for a research project in order to fulfill the thesis requirement in order to obtain the degree of Especialist in Corporate Finance of Tomás Di Santo and Camilo Roncancio both of them former CESA graduate students.
2. These figures are calculated using the official exchange rate for the dates 31/12/1995 and 31/12/2007, which were USD/COP=$987,65 and USD/COP=$2.014,76 respectively.
3. These figures are calculated using the official exchange rate for the dates 31/12/1995 and 31/12/2007, which were USD/COP=$987,65 and USD/COP=$2.014,76 respectively.
4. Alpha is obtained by substracting the fund actual return by the expected return obtained using the CAPM.
5. (Banco de la República: Colombia, 2008)
6. (Banco de la República: Colombia, 2008)
7. The first column contains the performance measures, the second column are the results for a specific portfolio, the third column are the results for a specific ETF benchmark as defined by Appendix A and the fourth column can be interpreted as follows. DEFFICIENT=lack of evidence of active management by the pension funds management EFFICIENT=evidence of active management by the pensions fund management Not conclusive=fail to reject the null hypothesis of no relation between a fund and its respective benchmark measured by beta.
8. The portfolios that beat their respective benchmarks in terms of absolute returns are: Balanced, Money, Enterprises, Global and Premium.
BIBLIOGRAPHIC REFERENCES
1. Asofondos. (2006). Asofondos-Asociación Colombiana de Administradoras de Pensiones. Retrieved January 9th, 2009, from website Asofondos: http://www.asofondos.org.co/VBeContent/newsdetail.asp?id=19&idcompany=3 [ Links ]
2. Asofondos. (2009). Asofondos- Asociación Colombiana de Administradoras de Pensiones. Retrieved January 9th, 2009, from website Asofondos: https://cica.heinsohn.com.co/ [ Links ]
3. Banco de la República Colombia. (2008). Series Estadísticas: Tasa de cambio. Retrieved June 30th, 2008, from Website Banco de la Republica Colombia: http://www.banrep.gov.co/series-estadisticas/see_ts_cam.htm [ Links ]
4. Banco de la República: Colombia. (2008). Series estadistícas: Tasa de interés. Retrieved June 30th, 2008, from Website Banco de la Republica Colombia: http://www.banrep.gov.co/series-estadisticas/see_tas_inter.htm [ Links ]
5. BBVA Colombia. (2008). BBVA Colombia: Pensiones y Cesantías. Retrieved June 30th, 2008, from: http://www.bbvahorizonte.com.co/index.php?module=Pagesetter&func=viewpub&tid=1&pid=203 [ Links ]
6. Bogle, J. (1998). The Implications of Style Analysis for Mutual Funds. (34-42, ed.) The Journal of Portfolio Management . [ Links ]
7. Cumby, R. E. and Glen, J. D. (1990). Evaluating the Performance of International Mutual Funds. Journal of Finance, 45 (2), 497-521. [ Links ]
8. Dellva, W. (2001). Exchange Traded Funds Not for Everyone. Journal of Financial Planning, 110-124. [ Links ]
9. Fama, E. F. (1970). Efficient capital markets: A review of theory and empirical work. Journal of Finance , 25, 383-416. [ Links ]
10. Frino, A. and Gallagher, D. (2001). Tracking S&P 500 Index Funds. Journal of Portfolio Management, 88-96. [ Links ]
11. Gastineau, G. (2001). Exchange Traded Funds: An Introduction. Journal of Portfolio Management 27(3), 88-96. [ Links ]
12. Georges, H. (2005, December 3). The Generalized Treynor Ratio. Retrieved January 20th, 2009, from: http://www2.wu-wien.ac.at/rof/papers/pdf/Hubner_Treynor%20Ratio.pdf [ Links ]
13. ING. (2008). ING Fondo de Pensiones Voluntarias. Retrieved June 30, 2008, from: https://www.ing.com.co/wps/portal/HomeING/afiliados/pensionesvoluntarias/FichasTecnicas [ Links ]
14. Jensen, M. (1968). The performance of mutual funds in the period 1945-1964. Journal of Finance, 23, 389-416. [ Links ]
15. Jones, S. L. and Yeoman, J. C. (2001). Problems in Measuring Contrarian Performance with Jensens Alpha: A Reconciliation of Real-Time and Event-Time Tests. Social Science Research Network. Retrieved January 14th, 2009, from http://papers.ssrn.com/sol3/papers.cfm?abstract_id=249057 [ Links ]
16. Kostovetsky, L. (2003). Index Mutual Funds and Exchange- Traded Funds: A comparison of two methods of passive investment. Journal of Portfolio Management, 80-92. [ Links ]
17. Modigliani, F. and Modigliani, L. (1997). Risk-adjusted performance. Journal of Portfolio Management, 23, 45-54. [ Links ]
18. NYSE. (2006). What You Should Know About Etfs. N. R. Inc., Ed. Retrieved January 9th, 2009, from: http://www.nyse.com/pdfs/what_you_should_know_about_etfs.pdf [ Links ]
19. Poterba, J. M. and Shoven, J. B. (2002). Exchange Traded Funds: A New Investment Option for Taxable Investors. The American Economic Review, 92(2), 422-427. [ Links ]
20. Protección S.A. (2008). Protección S.A.: pensiones Voluntarias. Retrieved June 30t h , 2008,from: http://www.proteccion.com.co/portal/secciones/PROTPORTAL/HOME/HOMEAF/PENSIONVOL/INFGENERAL/PENSIONESVOLUNTARIAS/doc_953_MICROSITIO.html?idDocumento=953 [ Links ]
21. Sharpe, W. (1966). Mutual Fund Performance. Journal of Business, 39, 119-138. [ Links ]
22. Treynor, J. L. (1966). How to Rate Management of Investment Funds. Harvard Business Review, 44, 131-146. [ Links ]
23. Varami, H., and Kalash, S. (2008). Testing Market Efficiency for Different Capitalization Funds. American Journal of Business, 23(2), 17-26. [ Links ]
24. Yahoo. (2008). Título del recurso extraído de la página. Exchange- Traded Funds (ETF) Center. Retrieved June 30th, 2008, from http://finance.yahoo.com/etf [ Links ]

