


 English (pdf)
 Article in xml format
 Article references
 Send this article by e-mail
 Cited by SciELO
  Cited by Google
  Similars in
SciELO
Similars in
SciELO  Similars in Google
 Permalink
1. Introduction
Antioquia is a Colombian department and one of the nation’s principal economic drivers. With a population of over 6.3 million (2013), Antioquia’s gross domestic product (GDP) and economic growth rate of 3% (Londoño, Restrepo, Álvarez, & Ospina, 2018) are above the national average. Antioquia’s economy is based on the manufacturing industry, service sector and natural resource exploitation (Llisterri & Pietrobelli, 2011). Income, industry, population, post-secondary education and investment in research and development are concentrated in the metropolitan area of Medellin. Along with Bogotá and Cali, the three cities form the “Golden Triangle” (Secretaría de educación para la cultura de Antioquia, 2011).
Development theory from an innovation systems perspective and in particular regional innovation systems (henceforth RIS) has been influenced by different schools of thought including the school of evolutionary economics, institutional economics, new regional economies, the learning economy, the innovation economy and network theory (Quintero & Robledo, 2013).
For over two decades the development of Antioquia’s RIS has been based on local initiatives with a bottom-up approach, with key agents in the process considered to be the foundation (Llisterri & Pietrobelli, 2011). As early as the 1980s science and technology in Antioquia had strengths and a certain structure in the academic, productive and public sectors. During this period, the challenge was to develop a policy for science, technology and innovation (STI) that would evolve around agent interactions (Llisterri & Pietrobelli, 2011).
With changes to Colombia’s political constitution in the 1990s, certain powers and functions were granted to the regions which as a result had the autonomy to make decisions to promote capacity building and institutional strengthening, as well as to create the basic infrastructure for a science and innovation system. Nevertheless, policies developed in the regions were not sufficient for shaping the dynamics of innovation (Llisterri & Pietrobelli, 2011).
In the last decade the university-business-state committee was created, and ties were built with regional competitiveness councils and the departmental Science, Technology and Innovation council. This allowed Antioquia to advance in the field of innovation among RIS agents (Llisterri & Pietrobelli, 2011).
The objective of this paper is to evaluate the structures, interactions and dynamics of agents in Antioquian RIS using an agent-based simulation model. To this end, part 2 describes the context within which RIS are developed and presents the structures and interactions of regional agents. Part 3 looks at RIS from a complex adaptive systems (CAS) perspective, which enables a better understanding of how systems operate as a support for the cognitive process of decision making for policymakers. Part 4 highlights the importance of addressing RIS dynamics and the RIS of Antioquia in particular. An agent-based model (ABM) is proposed and the results of its simulation are presented.
Finally, conclusions and suggestions for future research are provided, with the aim of achieving a better understanding of the RIS of Antioquia as a product of interactions between its agents.
2. Theoretical framework
The concept of the RIS has been widely discussed by various authors. Since the 1980s and the beginning of the 1990s, pioneering works by Freeman (1987), Lundvall (1992) and Nelson (1992), provided the basis for the definition and characterization of the national innovation system. Asheim and Gertler (2005) define it as the institutional infrastructure that supports innovation in a region’s productive structure. In 1992, Cooke coined the term “regional innovation system” and attempted to explain it as the best practices in the context of regional innovation by engaging in a process of learning through interactions (Su & Chen, 2015). In accordance with this, RIS have two central elements: 1) a strong and dense network of relationships between autonomous and heterogenous agents (subsystems of “explorers, exploiters, catalysts and regulators of knowledge”) and 2) a level of competitiveness attributed to the co-evolution of the productive organization and to the location of formal and informal institutions within the system (Quintero & Robledo, 2013).
These definitions are complex and require further explanation, as they refer to interactions between different actors with the purpose of producing innovation collectively through the interaction of knowledge-based assets. This interaction is studied by looking at a set of networks made up of agents or actors where capacities, knowledge and feedback are shared. This allows them to benefit from their own infrastructure in order to modify, achive and increment knowledge and innovation (Lau & Lo, 2015). These actors operate in an area that is geographically defined and they are governed by common policies at the sectoral, regional and national levels (Doloreux, 2002).
While still recognizing the existence of sectoral and national innovation systems, this definition suggests that demarcating the RIS is key (Tödtling & Trippl, 2005). If the implementation of policies at the regional level is desired, the following three parameters must be defined: firstly, the existence of industrial specialization patterns, as this generates localized economies that exist between companies with similar productive contexts and where knowledge is generated within them (Li, 2015); secondly, the influence of knowledge on the process of innovation and tacit knowledge; and thirdly, issues that are demarcated spatially. This con-firms that all regions behave differently and cannot be measured in the same way.
Each RIS requires a particular type of analysis and approach in order to define and describe it, given that all RIS are made up of various subsystems of actors or agents. The first subsystem is that of the exploiters who apply and take advantage of knowledge. All companies with their respective clients, suppliers and competitors belong to this category. The second subsystem is comprised of actors or agents that explore new and existing knowledge and are defined as explorers. This group of actors produces and diffuses knowledge and skills. Research institutes including laboratories and educational institutions such as universities are grouped within this category (Tödtling & Trippl, 2005). This means that regional development in innovation requires the dedication and commitment of these agents. The complex interrelationships that emerge between these actors are referred to as the innovation habitat (Oliveira, Echeveste, Cortimiglia, & Gonçalves, 2017).
Actors in these systems have become more specialized in recent years in terms of their functions (Zollo, De Crescenzo, & Ponsiglione, 2011) and have emerged as four types of agents: explorers, defined as those who produce new ideas, methods and techniques from the fringes of knowledge; intermediaries (Watkins, & Horley, 1986) or catalysts (Smits & Kuhlmann, 2004), defined as those who facilitate the transfer, acceptance and use of knowledge (Ruiz, Quintero, & Robledo, 2016); exploiters, defined as actors who transform knowledge into market value and include companies (especially small and medium ones); and the fourth actor is the national innovation agency, which is the government player charged with establishing guidelines and coordinating the innovation network. An additional element (which is equally important to policy creation and implementation in a given region) is the environment or setting in which the RIS develops and evolves. This element is not identified as a key agent or actor in the current literature (Quintero, Ruiz, & Robledo, 2017).
2.1. RIS Proposed model for Antioquia
The RIS to be studied here spans the territory of the department of Antioquia, located in northwestern Colombia. Figure 1 presents the proposed model for the RIS, which is comprised of three actors with the following characteristics (Carlsson, Jacobsson, Holmén, & Rickne, 2002): firstly, explorers are responsible for generating and diffusing knowledge, and include educational and research institutes; secondly, catalysts play the role of facilitating the transfer, acceptance and use of knowledge, and include business incubators, technology parks and chambers of commerce; thirdly, exploiters include industrial companies and organizations.
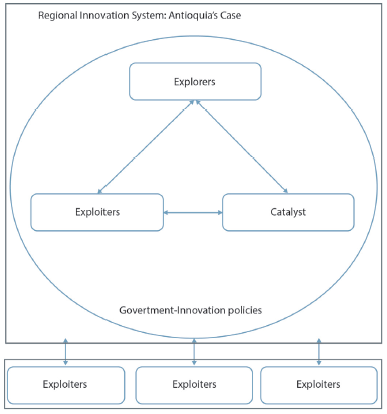
In the case of the RIS of Antioquia where the main actor in the policy creation subsystem is the regional government, it is assumed that this actor will represent the competitive environment or setting in which the RIS develops. This environment defines policies, tracks innovation processes and is the framework for interaction between actors, with the purpose of influencing competitiveness in the region and its development over the long term. It should be noted that this assumption is made because there is no regional agency present in the policy creation subsystem to dictate and lead as the principal actor or agent.
The RIS of Antioquia takes other external systems into consideration including the National Innovation System (henceforth NIS), international organizations and other RIS. Their relationships cross borders (Trippl, 2006) in order to obtain economic and knowledge support. Additionally, this enables them to learn from the experiences of other organizations that have an impact on innovation in such a way that they will be able to adapt this new knowledge to their region. Moreover, the RIS of Antioquia makes substantial contributions to different bodies, organizations and systems at the national and international levels. These contributions can take the form of new knowledge, innovation products and changes to macro policies regarding innovation.
As a result, the relationships between actors in the RIS of Antioquia are not soft and can be bidirectional thanks to framework agreements, joint research projects, publications, research project management, provision of goods and services, organizing of networking events for actors and advising and consulting services. This means that actors can receive feedback on the results obtained by other actors using the knowledge shared between them, with the purpose of engaging their skills for generating, diffusing and using knowledge and creating market value (Carlsson et al., 2002), thereby bringing learned capacities and competence to the system.
RIS can be explained through the concept of the Complex Adaptive System (CAS). CAS are made up of a set of interacting elements (Bertalanffy, 1968) and are characterized by a multi-level structure. The components in levels in the hierarchy tend to show significant levels of autonomy, while the behavior of the system is the result of self-organized components, where organization is not controlled or directed by any external body.
Such complex systems perceive their environment and respond to changes within it in potentially different ways (Ahrweiler, Pyka, & Gilbert, 2004; Vicsek, 2002). In addition, many complex systems are also adaptive. In these adaptive systems, the behavior of the basic components can evolve over time, giving rise to a certain response capacity in the face of changes to the environment in which mechanisms such as individual learning or selection and replacement (large-scale learning) are used. Ottino (2004) adds elements to complex systems including emergencies, adaptation and self-organization as characteristics that are present in multiagent or complex adaptive systems and in self-organized systems, also referred to as collective intelligence systems.
Some authors explain the role of collective intelligence from a collective memory perspective, focusing on properties such as levels of aggregation (Yamins, 2007), randomization (Lorenz, 1963), emergency (Damper, 2000; Wolf & Holvoet, 2005), redundancy and robustness. These properties are possible as long as the system demonstrates adaptability, interaction and rules.
3. Design and methodological construction model
On the basis that RIS are CAS, an ABM was formulated for the RIS of Antioquia. To this end, characteristic elements described and disseminated in the literature were identified and the current system was observed and modelled. In it the following can be found: 1) extensive interactions between agents operating at the local level and a lack of central control (Iandoli, Palumbo, Ponsiglione, Tortora, & Zollo, 2012); 2) multi-level organizations with distributed interactions (Iandoli, Palumbo, Ponsiglione, Tortora, & Zollo, 2012); 3) continuous adaptation among agents (Iandoli, Palumbo, Ponsiglione, Tortora, & Zollo, 2012); 4) the presence of disruptive elements (new markets, technologies and behaviors) (Iandoli, Palumbo, Ponsiglione, Tortora, & Zollo, 2012); 5) limited rationality (Iandoli, Palumbo, Ponsiglione, Tortora, & Zollo, 2012); 6) continuous evolution (Iandoli, Palumbo, Ponsiglione, Tortora, & Zollo, 2012); 7) a regional dimension to innovation (Iandoli, Palumbo, Ponsiglione, Tortora, & Zollo, 2012) and 8) a systematic and systemic nature (Iandoli, Palumbo, Ponsiglione, Tortora, & Zollo, 2012). These elements can be identified in the RIS, and as such these systems are considered to be complex systems comprised of agents with limited rationality that learn adaptatively and interact at different levels (Quintero et al., 2017).
The following methodology was used in the design and development of the RIS of Antioquia ABM (Sterman, 2000):
Articulation of the problem, which answers questions like “What are the key concepts and variables?”
Here, the time frame for the model is set and the historical behavior of the key concepts and variables is examined.
Formulation of the hypothesis, in which a theory that considers the behavior of the problem is developed. Reference models are used here, and data is researched to support and enhance the model being developed.
Formulation of a simulation model in which the structure of the model, parameters and initial conditions are specified.
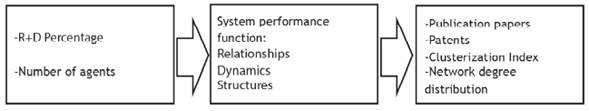
In brief, using two input variables, the RIS explains the principal relationships, dynamics and structures, thereby generating output information such as the number of publications and patents in the system. To explain structure and relationships, basic studies were carried out on the RIS as a network using graph theory concepts, with a clustering index and levels of distribution of the networks formed within the RIS. This can be observed in Figure 2.
Agents interact with one another and generate diverse results for the output variables until the end of the time frame required for the simulation. A five-year limit was estimated for the design of the system as the time needed for it to be carefully developed and generate projects, patents and publications. Authors Fritsch & Slavtchev (2011) consider that patent applications are only published 12 to 18 months after being submitted. This is the time required for the patent office to review the application and the basic conditions for guaranteeing the patent.
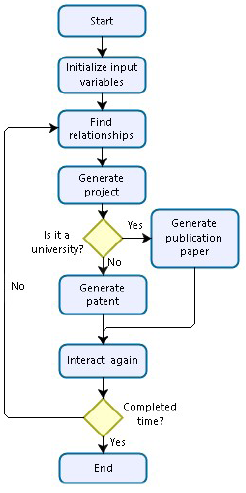
Figure 3 shows the process that the system undergoes to generate RIS products during the simulation.
In accordance with the proposed methodology, Table 1 represents the variables selected for developing the simulation model.
Table 1 Variables of the RIS of Antioquia model.
| Variables of the RIS model | Explanation of the variable |
|---|---|
| E_interrelationship | This is the length of the tie between a firm (exploiter agent) and other agents in the system, measured in distance patches. It involves a geographical relationship. |
| U_Interrelationship | This is the length of the tie between a university (explorer agent) and other agents in the system, measured in distance patches. It involves a geographical relationship. |
| %Firms | Percentage of participation with respect to the R&D % of exploiter agents (companies) within the system. |
| %University | Percentage of participation with respect to the R&D % of explorer agents (universities) within the system. |
| P_University | Random variable for resource allocation within the system. |
| P_Firms | Random variable for resource allocation within the system. |
| Exploiters | This is the number of exploiter agents (companies) that the system will have in the simulation. |
| Explorers | This is the number of explorer agents (universities) that the system will have in the simulation. |
| Catalysts | This is the number of catalyst agents (technological centers) that the system will have in the simulation. |
| %R&D | This is the percentage of national research and development to be simulated for the RIS. |
| Image | The graphic form to be used in the simulation of the RIS. This can be no image, Antioquia image or Antioquia unequal image. |
Source: own elaboration.
As such, the input variables for this model are:
Gross Domestic Product Expediture on R&D.
Number of regional agents in the system (explorers, exploiters, catalysts, government).
Other variables important for modelling are:
Number of ties, represented by two variables in the CAS theory: E_interrelationship and U_interrelationship.
In CAS, the interaction between agents and the environment is important because it shows how agents operate and how results vary.
Random variables to simulate resource allotment for different agents within the system (these allotments are presented in Table 1).
The following performance measures were used to gauge regional innovation behavior:
Scientific publications (Wang & Sun, 2016).
Patents (Wang & Sun, 2016).
System ties and network density (Cancino et al., 2008).
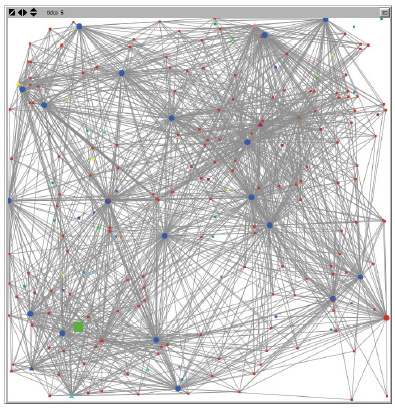
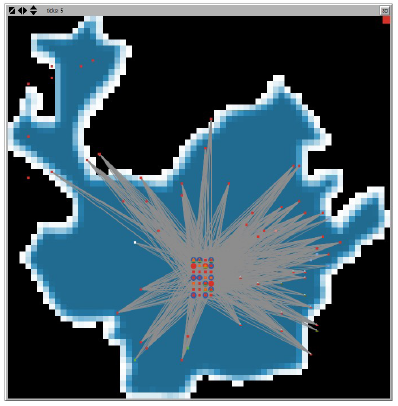
With the help of NetLogo Version 5.0.3, a model of the RIS of Antioquia was developed with the variables, parameters, time frames and results mentioned above. Diagrams for this simulation model can be seen in Figure 4, which represents the schematic approach of an interactive network for SRI, universally considered as the ideal perspective of SRI (Stuck, Broekel, & Revilla, 2016). On the diagram, the red dots are exploiters, blue dots are explorers and the green square is the representation of politics. Figure 5 shows a map of Antioquia and the location of agents on the map; however, the Valle de Aburra region is very small with a high concentration of agents, making it difficult to see them clearly. Figure 6 shows the regions of Antioquia according to agent concentration; the Valle de Aburra region can be seen more clearly at this larger scale.
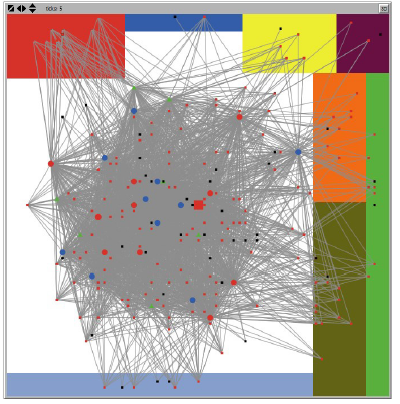
A review of the literature shows that a fundamental problem with the study of all RIS is that it has not yet been precisely determined how to graphically depict an RIS (Doloreux & Parto, 2005). It is for this reason that different spatial configurations are proposed for the design of the Antioquian RIS model.
The first configuration makes it possible to study and simulate innovation networks in an environment where public and private agents interact on multiple levels. This creates a broader dynamic without regional divisions within companies. In the second, with the map of Antioquia, the spatial configuration of the networks, regions and agents is studied. Table 2 shows that the distribution of agents in the department is not equal, as 69% of them are located in the Valle de Aburra, a small area within the region. Nevertheless, it provides a real picture of network dynamics in the department. Finally, the Antioquia unequal distribution graphic configuration is proposed in order to study dynamics and networks within the area occupied by the agents.
Table 2 Subregions of Antioquia and distribution of agents.
| Subregion of Antioquia | Coloured area in figure | Distribution of Agents |
|---|---|---|
| Bajo Cauca | Blue | 2% |
| Magdalena Medio | Light Green | 5% |
| Northeastern | Red | 4% |
| Northern | Yellow | 3% |
| Western | Orange | 1% |
| Eastern | Green | 7% |
| Southwestern | Light blue | 4% |
| Urabá | Violet | 5% |
| Valle de Aburra | White | 69% |
| 9 Subregions | 100% |
Source: own elaboration.
4. Results and analysis
Once the ABM for the RIS of Antioquia had been developed, a series of experiments were carried out in which the various input parameters were changed in order to obtain output results. These experiments can be observed in Table 3.
Table 3 Table with the number of experiments performed and the values of the variables for the Antioquian RIS model.
| Experiment | 1 | 2 | 3 | 4 | 5 | 6 | 7 | 8 | 9 | 10 | 11 | 12 | 13 | 14 | 15 |
|---|---|---|---|---|---|---|---|---|---|---|---|---|---|---|---|
| E Interrelationship | 4 | 4 | 4 | 4 | 4 | 6 | 10 | 10 | 10 | 10 | 10 | 6 | 10 | 10 | 10 |
| U Interrelationship | 7 | 7 | 7 | 8 | 8 | 10 | 10 | 15 | 15 | 15 | 20 | 10 | 10 | 10 | 15 |
| %Firms | 0.56 | 0.56 | 0.56 | 0.56 | 0.56 | 0.56 | 0.4 | 0.4 | 0.4 | 0.65 | 0.65 | 0.56 | 0.4 | 0.4 | 0.65 |
| %University | 0.44 | 0.44 | 0.44 | 0.44 | 0.44 | 0.44 | 0.6 | 0.6 | 0.6 | 0.35 | 0.35 | 0.44 | 0.6 | 0.6 | 0.35 |
| P_Firms | 1 | 1 | 1 | 1 | 1 | 2 | 1 | 3 | 1 | 1 | 1 | 2 | 1 | 1 | 1 |
| P_University | 3 | 3 | 3 | 3 | 3 | 3 | 3 | 3 | 2 | 3 | 3 | 3 | 3 | 2 | 3 |
| %R&D | 0.16 | 0.2 | 0.16 | 0.2 | 0.16 | 0.16 | 0.25 | 0.3 | 0.3 | 0.16 | 0.16 | 0.16 | 0.25 | 0.3 | 0.2 |
| Catalysts | 7 | 7 | 7 | 7 | 7 | 7 | 7 | 7 | 7 | 7 | 7 | 7 | 7 | 7 | 7 |
| Exploiter | 70 | 70 | 70 | 70 | 70 | 70 | 70 | 35 | 70 | 70 | 70 | 70 | 70 | 70 | 70 |
| Explorer | 5 | 5 | 5 | 15 | 15 | 20 | 20 | 25 | 25 | 25 | 25 | 20 | 20 | 25 | 25 |
Source: own elaboration.
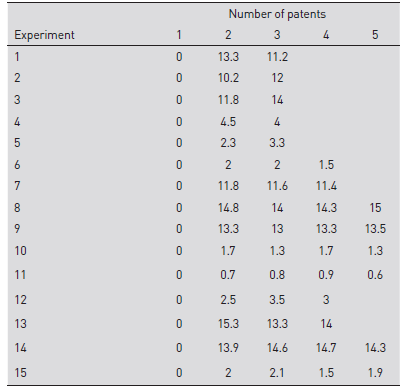
The first result of this set of experiments is a study of the number of patents that the system can generate with the input data. In Table 3 it can be observed that Experiment 14 succeeded in generating a larger number of patents on average in comparison to the others. Experiments 8 and 13 also achieved a high number of patents. The results can be observed in Table 4.
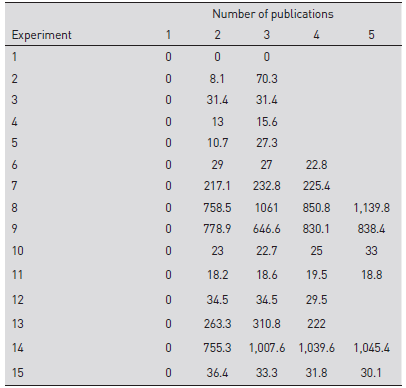
The second expected result of the simulations is the observation of the behavior of the number of publications generated by the RIS, in which Experiments 8 and 14 once again show the highest results compared to the others. Experiment 9 shows equally high results for generating knowledge in terms of publications within the system. All results can be observed in Table 5.
Table 5 Average results in terms of number of publications for each experiment.
Source: own elaboration.
Another type of analysis used to understand the behavior of RIS involves studying the concept of an RIS as a network. A network is therefore defined as an arrangement of bodies (nodes) with connections between them (vertices) (Newman, 2003). As such, a system that takes this form can be called a graph in mathematical literature and can have different connotations, including social networks, credit networks, friend networks, genealogical networks, economic networks, disease transmission networks, etc. (Epstein & Axtell, 1996).
A network can therefore also be defined as a configuration of one-dimensional nodes tied to a fixed number of neighbors, where the more connections there are, the more cohesive the system will become (Miller & Page, 2007).
A network analysis has properties for studying behavior, including a network clustering coefficient and the degrees of network distribution, which show how connected the network of agents in the RIS is (Newman, 2003).
Clustering in networks is defined as the number of groups of three that are connected to a single vertex; in other words, an arrangement of three nodes connected to each of the others. Clustering takes on a value of 0 to 1. The clustering coefficient measures the quantity of triangles in a network and can be defined as the average clustering of each node in the network (Newman, 2003; Watts & Strogatz, 1998). The degree of network distribution is defined as the number of vertices that agents in the system have, described in the form of a histogram that shows their degree of connection (Newman, 2003); this is also called network connectivity and is generally measured by the density of ties per node (Pyka & Scharnhorst, 2009).
In order to study the behavior of the RIS network, the following experiments are proposed. They can be observed in Table 6.
Table 6 Experiments used to study the behavior of the RIS network.
| Experiment | E Interrelationship | U Interrelationship | %Firms | %University | P_Firms | P_University | %R&D | Catalysts | Exploiter | Explorer |
|---|---|---|---|---|---|---|---|---|---|---|
| 1 | 4 | 7 | 0.56 | 0.44 | 1 | 3 | 0.16 | 7 | 70,000 | 5 |
| 2 | 4 | 7 | 0.56 | 0.44 | 1 | 3 | 0.2 | 7 | 70,000 | 5 |
| 8 | 10 | 15 | 0.4 | 0.6 | 3 | 3 | 0.3 | 7 | 35,000 | 25 |
| 10 | 10 | 15 | 0.65 | 0.35 | 1 | 3 | 0.16 | 7 | 70,000 | 25 |
Source: own elaboration.
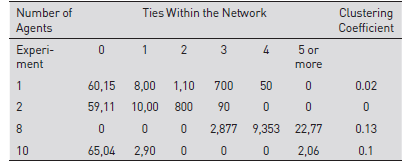
Based on the simulation of the experiments, Experiment 8 has the highest clustering coefficient. The results obtained are presented in Table 7.
5. Conclusions
In the simulation model, a greater number of networks are centralized in Medellin. This is mainly due to the fact that a large percentage of regional agents, approximately 69%, is located in this region.
The network analysis shows that in Experiment 8 there was a higher clustering index, indicating greater grouping and interrelationships between agents. This is mainly due to a higher percentage of university participation in the system and a higher percentage of R&D, coupled with more extensive creation of ties between the different agents in the network.
Similarly, the results indicate that the simulation of Experiment 8 shows greater patent and publication generation during the final simulated period. This is due to a higher percentage of R&D investment and increased participation of explorer agents in the system.
With a 46% increase in the percentage of R&D (from 0.16% to 0.30%), a 74.8% increase in patent generation at the regional level is obtained in the simulation model, going from an average of 3.77 patents to 15.00.
A higher clustering index in the agent network implies be-havior similar to log-normal distribution while a lower clustering index shows negative exponential distribution in the network.
With respect to the simulation model, it is important to point out that the agents are homogenous; in other words, there is no segregation between them nor do they have specializations. As such, different economic sectors are not included in the model and the prevailing rule in the model is that of interaction and association based on proximity and participation in the percentage of R&D. This means that the simulation model presented offers a single initial, simplified view of the system in order to draw probable behavior. In addition, the model does not interact with exogenous factors or other regional or national innovation systems; it is a microenvironment that is contained and demarcated by its own capacities and behaviors.
The RIS in Antioquia responds to a complex grouping of agents which over time looks for groupings of other agents to cooperate in the system, thereby learning to transform the space through rules. This demonstrates that the RIS in Antioquia responds to the characteristics of a complex adaptive system, encompassing the science of complexity as a means to understand the communities immersed in the various RIS.
For future research with a bottom-up approach, we propose even more extensive coverage of network dynamics with regards to system agent communication patterns as well as invention and learning patterns, and in particular localized learning that allows for specialization among agents resulting in better performance. We also recommend developing models that shed light on emerging phenomena in RIS including knowledge-sharing patterns and their localized search and exploration procedures, integration and specialization of localized networks and the resulting alignment of modes of governance, as well as the dependence of historical experience on innovation processes.
Macroeconomic policies such as foreign trade and investment stimulate the demand for higher quality education. At the same time, education makes trade and investment more profitable. In other words, both variables benefit from positive feedback ties that encourage innovation in general. This must go hand in hand with better institutions and more open and competitive economies.
The success of an RIS is associated with the growth process, seen as a dynamic system in which human and knowledge innovations are increasingly significant. As such, these dynamics require a political vision that is holistic and global.

