


 English (pdf)
 Article in xml format
 Article references
 Send this article by e-mail
 Cited by SciELO
  Cited by Google
  Similars in
SciELO
Similars in
SciELO  Similars in Google
 Permalink
1. Introduction
Spatial disparities arise not only between countries but regionally within them. This process of polarization merits special attention. Among the determinants, technological progress has been identified since Lucas’ 1988 study as an engine of economic growth. A region that pursues investment in R&D can benefit from productivity gains, attracting more economic activity and leading to a process of industrial agglomeration. Such a process goes hand in hand with the increased population density, resulting in higher demand (Krugman, 1991). Regions with larger populations are attractive due to their large local markets and a wide variety of products, which in turn attracts more people at the expense of smaller regions. This picture might be shaped by the influence of trade globalization. With trade, regions can have the same variety of products and even services, making them more homogeneous. In this sense, trade might reduce inter-regional disparities. However, products still enter countries through specific ports of entry, generally in large cities, reinforcing their prevalence in the national spectrum. The effect of transport costs has been extensively studied in the New Economic Geography (NEG) literature. This factor shapes the spatial distribution of economic activities because lower costs facilitate inter-regional trading. According to Krugman (1991), once transportation costs are low enough, population concentrates in certain regions, increasing divergence between them. Firms determine production distribution factors depending on the scale of transport costs (Krugman, 1991; Krugman & Elizondo, 1996; Krugman & Venables, 1995; Venables, 2005; Monfort & Nicolini, 2000; Rauch, 1991; Alonso-Villar, 1999; Paluzie, 2001).
This paper focuses on the relationship between the level of population agglomeration within regions and innovation, and how imports affect this relationship. The main aim is to identify the source of trade that drives the agglomeration effect of innovation, by distinguishing the type of trade according to technological intensity.
This study attempts to bridge two factors that have been separately studied separately: trade on the one hand; science, technology and innovation activity (STI), on the other. The mechanism explaining this intuition is that foreign technological knowledge transmitted by imports increases domestic technology stock, in turn raising domestic productivity (Keller, 2004; Eaton & Kortum, 2006). Greater efficiency is reached in places where exporting firms operate with economies of scale (Esfahani, 1991; Balassa, 1978). In addition, trade is a channel of technology diffusion between developed and developing countries as goods that incorporate technology can be imitated or adapted in the receiving country (Coe & Helpman, 1995). Nevertheless, productivity gains are not uniformly diffused throughout the national territory. Particular regions with economic advantages may benefit the most. Thus, the presence of manufacturing and skilled labor becomes increasingly concentrated in core regions. This phenomenon has been verified in the case of China (Ge, 2006; Kanbur & Zhang, 2005). Likewise, Henderson and Kuncoro (1996) demonstrate that in Indonesia, manufacturing industries concentrate in large metropolitan areas as trade liberalization increases. In the case of Mexico, trade liberalization encouraged the establishment of manufac-turing activities in Northern Mexican states near to the United States (Hanson, 1997; Madariaga et al., 2004; Chiquiar, 2005; Aroca et al., 2005; Jordaan & Rodriguez-Oreggia, 2012). This may be an indication that technology diffusion through trade is more effective at shorter distances.
To conduct this study, regional trade data from Colombia was used. This type of data allowed us to assess for the first time the influence of regional imports on the intra-regional agglomeration-innovation relationship, taking into account the technological intensity of goods involved. The distinction between the inter-regional and intra-regional levels is not trivial. Imports affect regions differently; as tariffs vary depending on whether goods are derived from regional specialization (Head & Mayer, 2004). Inter-regional configurations are likely to be modified by imports. Further, intra-regional configurations are also affected as agglomeration forces operate at the local level (Head & Mayer, 2004). Cities with an already high concentration of the population can be enhanced by imports (Hansen, 1990). Therefore, the study of agglomeration within regions is theoretically and empirically well-grounded.
Panel data from 32 regions over the period 2000-2009 was used, with unobserved heterogeneity being controlled using the appropriate techniques. Unobserved heterogeneity is given by the fact that patterns of concentration depend on regional characteristics that are not always observable. The fixed effects model was then employed using a LSDV (Least Square Dummy Variable) estimator with robust standard errors allowing for intra-group correlation.
Concerning regional imports, the average annual growth rate was 4% in the period studied. This increasing level of imports is related to population agglomeration within Colombian regions with a significant correlation of 55%. More importantly, the composition of imports seems to be of great importance in such a relationship. Looking at the correlation coefficients, primary product imports and imports with low-technological intensity are highly correlated with increased population concentration (62% and 53%, respectively) while hi-tech imports are less correlated with the agglomeration pattern (46%). This means that when imports enter a region, local firms have opportunities to innovate using the technology embedded in those imported goods. Other firms are then attracted to that region and agglomeration continues.
This paper is organized as follows. Section 2 reviews the literature on trade, innovation and spatial concentration. Section 3 describes stylized facts regarding regional concentration, imports according to technological intensity and levels of science, technology and innovation in Colombia. Sections 4 and 5 present the data and methodology. Section 6 discusses the results, and section 7 then concludes.
2. Theoretical framework of trade, innovation and spatial concentration
As economies liberalize in terms of trade, they specialize under their comparative advantages. This Ricardian prediction results in a pattern of lagged and advanced countries since the former are commonly specialized in low-technology products whereas the latter specialize in high-technology products. Notwithstanding, trade openness has been seen as a facilitator of technology diffusion across space and time. Thus, countries lagging in terms of technology might benefit from better access to technical advances developed around the world (Mayer, 2000).
At first, it was established that technical change is an endogenously produced outcome (Grossman & Helpman, 1991; Romer, 1990; Aghion & Howitt, 1992), with scholars pointing out the role of innovation as an engine of growth. Other theorists went beyond explaining the mere existence of technology and focused on its diffusion. The pioneers Eaton and Kortum (1999) considered a model of several countries producing output while using combined inputs under constant returns to scale. For them, new technologies are the result of R&D investment, and innovation becomes productive only if it is diffused. The main finding was that technology spillovers increase research productivity in other places. New technology carried out in specific locations may benefit other locations, with trade playing a technological dissemination role (Grossman & Helpman, 1991). In Eaton and Kortums’ 2002 model, trade allows access to a wide variety of foreign goods, and therefore access to foreign production technologies.
According to theoretical models, the interaction between domestic and foreign firms through international diffusion of technology increases domestic productivity. This is to say that foreign technological knowledge transmitted via imports increases domestic technology stock, and in turn raises domestic productivity (Keller, 2004; Eaton & Kortum, 2006). Santacreu (2015) explains the connections between trade and growth, showing that non-innovative countries benefit from technology spillovers through imports, leading to a reduction in the innovation gap between themselves and their trading partners. She found that 90% of growth in Asia is explained by imports from the USA and Japan. Other studies have focused on the technology-diffusing effect of FDI (as opposed to imports) on productivity. Robust estimations show positive technological spillovers from FDI (Xu, 2000; Keller & Yeaple, 2009).
The role of trade in relation to innovation and the productivity level of firms is emphasized. Nevertheless, the implications of that relationship on the distribution of economic activity is still in question. This can be analyzed by turning to New Economic Geography. The standard finding in this branch of economics is that trade integration increases regional concentration of the economic activity depending on their initial characteristics. The location with the largest market size, or population, will host the majority of local firms (Krugman, 1980; Martin & Ottaviano, 1999). Geographical characteristics also matter. Trade increases agglomeration in geographically-advantaged regions to the detriment of disadvantaged regions (Nishikimi, 2008; Alonso-Villar, 1999; Crozet & Koenig, 2004). In addition to inter-regional spatial configuration, trade also affects the intra-regional distribu-tion of economic activity in cities. Henderson (1982) and Rauch (1991) examined the distribution of cities in an open economy through an analysis of urban systems. The hypothesis of Rauch’s trade-urban model (1991) is that the cities closest to the coast will be the largest in terms of population when the volume of trade increases. To equalize utility between cities, people freely migrate to the most advantageous city, causing overcrowding in the nearest places to the coast (Rauch, 1991). This is because the purchasing power to obtain imports is higher in cities closest to the coast which have better access to international markets. Another prediction was that the level of wages and residential costs diminish as one moves inland. Considering this reasoning, one can expect that as hi-tech imported goods arrive, the city most favored by this trade exchange will be the one with the largest market and most adequate conditions for technology adoption (particularly the presence of skilled labor). Such a city will attract and concentrate economic activity and people. In contrast, congestion effects may act to disperse highly concentrated populations (Krugman & Elizondo, 1996). High urban costs make the distribution of goods and inputs for exporting and importing firms more expensive, meaning that it is in their interest to relocate outside the over-agglomerated region.
As trade openness involves increases in exports and imports, it is necessary to determine how exports and imports might be technology transmitters. To this end, models for how multinational organizations transfer technology to subsidiary firms have been developed (Keller & Yeaple, 2009). Firms use input factors, intermediate inputs and technology, which requires mastery of blueprints. The transfer of technology to affiliate firms consists in sending an assembled product (imported by the affiliate firm) or in assembling in situ (Foreign Direct Investment). The effective technology transfer will depend on the difficulty of decoding the product design (Keller & Yeaple, 2009). Geographical distance plays an important role in technological transfers. The greater the distance, the more complex the transfer will be. At first sight, intra-firm technological transmission is more evident, but technology also spills over between firms. Santacreu (2015) showed that firms can benefit from foreign innovations when importing goods that embody new technology. At this point, it is worth noting that international technological diffusion is neither inevitable nor automatic (Keller, 2004). Firms must invest in adaptation, imitation or creation, with the skilled labor likely to exist in large populations playing a key role. Moreover, distinctions between types of imported products are important. For instance, Amiti and Konings (2007) showed that what matters for technology diffusion is the exchange of input goods rather than output goods.
While evidence for imports as a channel for technological diffusion is extensive, few studies support the idea of exports as a mechanism to transfer technology. De Loecker (2007) demonstrated the positive effects of exporting for firms' productivity. Ito (2011) also provided evidence of the learning-by-exporting hypothesis by distinguishing the export destination country. She maintains that company productivity is increased when exporting to North America and Europe, but not when exporting to Asia. It seems that firms exporting to North America/Europe find an advantage to absorbing innovation in these markets. Indeed, the fact of exporting may not matter for innovation according to Guevara, Ramirez and Saez (2020), but the country of destination influences on the probability that a firm innovates. Likewise, for Ecuadorian firms, having Oceania as a destination market of exports increases the most such probability while having Africa as a destination of exports decreases it.
Based on the extant literature, trade may affect the relationship between the agglomeration of population and innovation. The diffusion of technology embedded in traded goods could play a key role. Thus, the distinction of product type according to the level of technological intensity is relevant for this study.
3. The Colombian scenario of trade, innovation and agglomeration
In Colombia, economic activity and population concentrates at national and regional levels. Nationally, six regions are considered: 1) Caribbean, 2) Orinoquia, 3) Amazon, 4) Pacific, 5) Cordillera and 6) Archipelago. The Cordillera and the Caribbean regions represent 93% of the total population of the country and account for 735 and 237 cities respectively. The Pacific region accounts for 1% of the population distributed in 30 cities. The remainder of the regions, Orinoquia, Amazonas and Archipelago occupy 50% of the national territory but account for only 6% of the total population distributed in 120 cities. Regarding the regional perspective, the pattern of agglomeration is again observed. Using the population of municipalities of each department, the intra-Theil index indicates a high level of population concentration of 0.76 on average in 2010. In line with theoretical foundations, population concentration was aligned with concentration in the number of firms, which was also computed with the intra-Theil index, using available data for 2018 (table A1, annexes). The departments with high levels of internal population concentration and firms concentration (statistics shown in parentheses) are Antioquia with 1.6 (3.03), Valle del Cauca with 1.5 (2.4) and Atlántico with 1.4 (2.5). The regions with a lower population concentration and firms concentration are Putumayo with 0.21 (0.69), Vichada with 0.22 (0.47) and Guaviare with 0.26 (0.88). A high level of concentration indicates that a few cities are economic cores attracting both more activity and more people due to their advantages in terms of infrastructure and accessibility. In turn, this induces more trade, which may enhance the pattern of agglomeration in big cities as the technology embedded in imports can be diffused to the domestic economy, increasing the productivity of those cities. In this sense, the greater the amount of import activity, the higher the level of concentration will be. As shown in table 1, the correlation between imports of any type of product and the level of internal population agglomeration is positive. This positive correlation is stronger with imports of primary products.
Table 1 Correlation between imports by technological intensity, agglomeration and GDP
| Intra-agglom Theil index | GDP | |
|---|---|---|
| Primary goods import | 0.6225 | 0.8681 |
| (0.000) | (0.000) | |
| Resource-based imports | 0.5188 | 0.7049 |
| (0.000) | (0.000) | |
| Low Technology imports | 0.5313 | 0.7690 |
| (0.000) | (0.000) | |
| Medium Technology imports | 0.4320 | 0.6977 |
| (0.000) | (0.000) | |
| High Technology imports | 0.4612 | 0.7072 |
| (0.000) | (0.000) |
In parentheses, the p-value of the correlation coefficient
Source: own elaboration.
During the period 2000-2010, imports with medium technological intensity represented on average 1.10% in the Gross Domestic Product (GDP) of Colombian regions. Specifically, the regions with the highest ratios of medium-technology products as a percentage of their respective GDP were Cundinamarca (7.6%), La Guajira (4.28%), Atlántico (2.88%) and Bolívar (2.83%). In second place, resource-based manufacturing imports represented on average 0.76% of the GDP of Colombian regions. Bolívar, Magdalena, La Guajira and Cundinamarca imported more resource-based products with 5.2%, 3.55%, 2.94% and 2.78% of their GDP, respectively. Moreover, Colombian regions also imported primary products, which represented on average 0.31% of GDP. The regions with the highest shares of primary imports as a percentage of GDP were Cundinamarca (1.53%), Nariño (1.31%), Atlántico (1.12%) and Valle del Cauca (1.03%). High-technology imports represented only 0.27% of regional GDP. The regions importing the most high-technology products as a percentage of their GDP were Cundinamarca (2.26%), Bolívar (0.88%), Valle del Cauca and Risaralda (0.68%). The regions that recorded the lowest ratios in all types of imports were Caquetá, Chocó and Casanare. In general, large departments imported more of all types of products in relation to their GDP. In fact, the correlations between GDP and any type of imports are significantly positive, around 70%, as seen in table 1.
Likewise, large departments have better conditions for science, technology and innovation activity to be developed. Thus, more agglomeration occurs in those places. Regarding the data, on average Colombian regions recorded 0.09% of Science, technology and innovation activity as a percentage of their GDP, during the period 2000-2010. The regions with the greatest STI activity/GDP ratio were the Bogotá District (0.5% of GDP), followed by Chocó (0.3% of GDP), San Andrés (0.2%) and Cundinamarca, Guainia, Risaralda, Caldas and Antioquia with 0.1% of their GDP. The departments with less than 0.01% were Cesar, Casanare and Arauca.
4. Data and methodology
To conduct this study, regional trade data was used. To our knowledge, this type of data, which is rarely available, allowed us to assess for the first time the regional impact of imports considering their technological intensity on the agglomeration-innovation activity relationship. A panel data with 32 regions between 2000 and 2009 was constructed, combining distinct data sources as described in table 2. We used regional imports in FOB prices from the Statistic System of International Trade (known as SIEX in Spanish) presented by the National Taxes and Customs Service (DIAN in Spanish) of Colombia. Imports at chapter level were determined by the Harmonized System, while technological classifications were provided by the Standard International Trade Classification (SITC). A process of homologation between both systems was performed. For the construction of the Theil concentration index, information on city populations was obtained from the National Administrative Department of Statistics (DANE in Spanish). Science, Technology and Innovation (STI) activity data corresponds to relevant government investment and was obtained from the Colombian Observatory of Science and Technology. This variable was available from 2000 to 2009, which determines the period of this study. Control variables such as mean municipal income, number of municipalities with precarious finances, departmental tax revenue and departmental collection of the gas tax were obtained from the Office of Sustainable Territorial Development (DDTS in Spanish) of the National Department of Planning (DNP Spanish). The value added in retail, entertainment, education and finance was obtained from the National Accounts Department of the DANE.
Table 2 Data sources
| Information | Description | Source |
|---|---|---|
| Imports | Imports in FOB prices | Statistic System of International Trade (SIEX in Spanish) presented by the Colombian National Taxes and Customs Service (DIAN, Spanish) |
| Population | Municipal population | National Administrative Department of Statistics (DANE in Spanish). |
| STI activity | Governmental investment in science, technology and innovation activity | Colombian Observatory of Science and Technology |
| GDP by sector | Share of a given sector in departmental GDP | DANE |
| Fiscal performance | Indicator of municipal performance according to their income, debt, expenditure and savings | Office of Sustainable Territorial Development (DDTSin Spanish)-National Department of Planning (DNP in Spanish) |
| Fiscal situation | Balance sheet and statement of income and expenditure Governors’ Financial Reports |
Source: own elaboration.
The descriptive statistics of each variable are shown in table 3. The panel database accounts for 320 observations. As previously explained, the level of concentration within departments measured by the Theil-intra index is heterogeneous, evidenced by the standard deviation of 0.379 from a mean of 0.769. The average of the logarithm of departmental GDP per capita is 6.05. In US dollars, the departmental average of GDP per capita in 2009 was $972.32. Mean tax revenues in 2009 were $116 million COP (Colombian pesos). The department with the maximum tax revenue of $730m COP was Antioquia. For 2009, the mean revenue from gas tax was 9.1 million pesos and the department with the maximum level of collection of 581 million pesos from gas tax was again Antioquia. With respect to fiscal performance, the mean percentage of municipalities with risky fiscal indicators was 60%, meaning that on average, more than half of municipalities have low fiscal performance. On average, the municipalities generate self-managed income of 11.3% with respect to their respective total income. In 2009, the department with the greatest self-managed income was Valle del Cauca with a 25.2% of its total income.
Table 3 Descriptive statistics of variables
| Variable | Obs | Mean | Std. Dev. | Min | Max |
|---|---|---|---|---|---|
| Theil-intra | 320 | 0.769709 | 0.379356 | 0.199597 | 1.600324 |
| Entertainment_act/gdp_dep | 320 | 0.003471 | 0.004413 | 0 | 0.033898 |
| Retail/gdp_dep | 320 | 0.072567 | 0.035263 | 0.011329 | 0.184953 |
| Education/gdp_dep | 320 | 0.077424 | 0.050743 | 0.007451 | 0.318182 |
| Finance/gdp_dep | 320 | 0.025875 | 0.013068 | 0.003068 | 0.080808 |
| Log GDPpc | 320 | 6.052154 | 1.94161 | -2.77583 | 8.112978 |
| ACTI/gdp | 320 | 0.000745 | 0.001654 | 0 | 0.026404 |
| M/gdp | 320 | 0.024595 | 0.039873 | 1.45E-05 | 0.341622 |
| Log tax revenues | 320 | 17.29905 | 1.831098 | 0 | 20.4079 |
| Log gas tax | 320 | 14.61476 | 2.686966 | 0 | 17.91299 |
| Number risky municipalities/total in dep. | 320 | 0.602006 | 0.223918 | 0 | 1 |
| Mean of share of own income municipalities | 320 | 0.113068 | 0.0525501 | 0.023975 | 0.297626 |
Source: own elaboration.
4.1. Model
Using regional trade data, we assessed for the first time the effect of regional imports according to the degree of technological intensity on the innovation-agglomeration relationship, using panel data from 32 regions over the period 2000-2009. By employing the Least Square Dummy Estimator, we were able to deal with unobserved heterogeneity, caused by the fact that the level of concentration depends on the specific unobservable regional characteristics. The specification of the panel model is the following:
 (1)
(1)
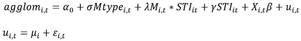
Where agglom it is the level of population agglomeration1 within region i at time t, STI it is the governmental investment in science, technology and innovation activity as a percentage of the GDP of region i at time t. M is the percentage of imports from the GDP of region i at time t. The interaction term, M i,t * STI it is the interaction effect between imports as a percentage of the GDP of region i at time t and STI activity as a percentage of the GDP of region i at time t. This interaction term indicates the degree at which the relationship between innovation activity and intra-agglomeration is affected by imports.
The vector containing control variables is represented by X i,t , μ i corresponds to region-specific effects which control for the time-invariant factors that affect the level of concentration within regions and ε i,t is the well-behaved independent identically distributed error.
The parsimonious model (1) is extended by disaggrega-ting the imports according to the technological classification based on Lall (2000). Five aggregated categories were considered, namely; 1) primary goods, 2) resource-based manufacturing, 3) low technology manufacturing, 4) medium technology manufacturing and 5) high technology manu-facturing. Additionally, the interaction variable was multiplied by region type (namely Coast, Highland and Amazon) to capture the differentiated effect according to geographical characteristics. Model (2) specifies the variables of imports by type as a proportion of GDP and by region:
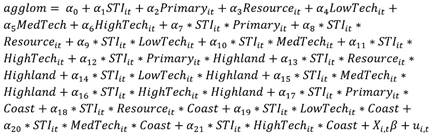 (2)
(2)
Since regional characteristics are correlated with imports and control variables, the assumption of the OLS estimator that cov(u i,t ,X i,t )=0 is violated. Therefore, the OLS estimates are biased and inconsistent. To determine the best fit of the model between the fixed effects model or random effects model, the Hausman test was used (Table 4). The results show that for the general model, both fixed and random effects are suitable while for the disaggregated model, only fixed effects are suitable. The LSDV (Least Square Dummy Variable) estimator is used with robust standard errors, allowing for intra-group correlation.
Table 4 Hausman Test: Ho: difference in coefficients not systematic
| Parsimonious model | Extended model |
|---|---|
| chi2(10)=1.44 | chi2(15)=36.25 |
| Prob>chi2=0.999 | Prob>chi2=0.0016 |
Source: own elaboration.
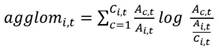
According to the theoretical basis, spatial inequality between regions is considered a demographic phenomenon and therefore population data was used. To measure the population concentration, the Theil index was applied. This index allowed us to measure both inter-regional and intra-regional concentration. Using the municipal population, the Theil-intra was computed to measure the population concentration within regions.
 (3)
(3)
Where A c,t is the population in municipality c at time t, A i,t is the total population of department i at time t and C i,t is the number of municipalities in a department i at time t. The term Ai,t / Ci,t is the situation of reference in which all cities are equi-populous. High values of the index indicate a high level of concentration within a department. It is worth highlighting that the concentration of population is a good measure to approximate industrial agglomeration. Theoretically, the level of industrial agglomeration follows the pattern of the population as it represents demand, meaning that firms tend to concentrate in large markets (Krugman, 1991). Empirically, the Theil index on firms has a similar order of regions (table A1, annexes) as the Theil index on population. However, data on firms was only available for one year, so a dynamic analysis accounting for the changes of location of firms could not be pursued.
It is worth noting that an issue of endogeneity is suspected between the type of imports and population agglomeration due to circular causality. The level of imports affects the level of agglomeration but also greater populations lead to an increase of imports. However, such an issue could be discarded here as it is less likely that the population distribution affects the level of imports than the mass of population. In other words, a department with a certain number of inhabitants will demand a specific amount of imports disregarding whether the population is concentrated or not.
In the X vector, time-variant variables that affect the level of population concentration within regions were included. The GDP per capita of each department was introduced as it can reflect the regional standard of living. To capture the effect of the activities that can influence the level of population concentration in each department, GDP in sectors such as entertainment, culture and sports, retail, education2 and finance were introduced to the model. Tax revenues were included to capture the level of income that each department has for investment in the territory, which makes it a more attractive place to live. According to the tax competition literature, the mobility of individuals and firms is affected by tax levels. Since the measure for our model is tax revenues, the expected effect is ambiguous. On the one hand, increased tax revenue may imply higher levels of tax. Economic agents often leave regions which have imposed onerous taxes (Baldwin & Krugman, 2004), leading to an expected reduction in the level of competition. On the other hand, those taxes are intended to be invested in the improvement of inhabitants’ quality of life, which increases the level of concentration. An interesting variable is the average across municipalities of the percentage of total income generated by own resources. This variable comes from data at the municipal level, so it is better related to the population concentration of municipalities within each department. Other factors that may negatively affect the level of concentration were taken into account. One of them is the gas tax in each department, which taxes the consumption of gasoline for vehicle engines and is paid for by the final consumer. This variable might capture the congestion effect in cities, as an increased gas tax revenues evidences a high level of vehicle use. In this manner, the congestion effects considered by Krugman and Elizondo (1996) comes into consideration. Another variable that can reduce the level of concentration in a department is the percentage of municipalities with risky fiscal indicators from the total number of municipalities. The fiscal performance indicator is based on several variables such as income, debt, expenditure and savings.
5. Results
For the estimation of the model, the LSDV (Least Square Dummy Variable) estimator was used with robust standard errors allowing for intra-group correlation. The results are presented in table 5. In columns 1 and 2, following the results of the Hausman test, the parsimonious models with fixed and random effects are presented, and in column 3 the extended fixed effects panel model is presented.
Table 5 The effect of trade on the agglomeration-innovation relationship
| Dependent variable | Model 1 | Model 2 | Model 3 |
|---|---|---|---|
| Agglomeration, Intra-Theil index | Parsimonious FE | Parsimonious RE | Extended FE |
| ln GDPpc | 0.0236 | 0.0231 | 0.0217 |
| (0.009)** | (0.009)** | (0.009)** | |
| Entertainment culture/GDPdep | 1.204 | 1.135 | 1.147 |
| (0.626)* | (0.625)* | (0.527)** | |
| Retail/GDPdep | -0.231 | -0.219 | -0.199 |
| (0.111)** | (0.106)** | (0.100)* | |
| Education/GDPdep | 0.0741 | 0.0485 | 0.0480 |
| (0.103) | (0.106) | (0.100) | |
| Finance/GDPdep | 0.477 | 0.520 | 0.393 |
| (0.257)* | (0.263)** | (0.228)* | |
| ln tax revenue | 0.00448 | 0.00476 | 0.00410 |
| (0.001)*** | (0.001)*** | (0.001)*** | |
| ln gas tax | -0.00193 | -0.00197 | -0.00189 |
| (0.001)* | (0.001)** | (0.001)* | |
| Risky municipalities/total dep | -0.0248 | -0.0246 | -0.021 |
| (0.008)*** | (0.008)*** | (0.008)** | |
| Own income/total income | 0.137 | 0.158 | 0.122 |
| (0.093) | (0.091)* | (0.093) | |
| STI/GDP | -1.216 | -1.235 | -1.264 |
| (0.398)*** | (0.396)*** | (0.412)*** | |
| Imports/GDP | -0.00556 | 0.00427 | |
| (0.143) | (0.144) | ||
| Imports/GDP*STI/GDP | 30.14 | 32.08 | |
| (12.860)** | (13.144)** | ||
| Primary/GDP | -2.547 | ||
| (0.637)*** | |||
| Resource/GDP | 0.298 | ||
| (0.267) | |||
| LowTech/GDP | 0.916 | ||
| (0.95) | |||
| MediumTech/GDP | 0.558 | ||
| (0.418) | |||
| HighTech/GDP | -1.102 | ||
| (0.748)* | |||
| Primary/GDP*STI/GDP | -2124.7 | ||
| (5417.025) | |||
| Resource/GDP*STI/GDP | 1338.3 | ||
| (941.451)* | |||
| LowTech/GDP*STI/GDP | -1283.3 | ||
| (2127.17) | |||
| MediumTech/GDP*STI/GDP | -170.7 | ||
| (166.078) | |||
| HighTech/GDP*STI/GDP | 557.0 | ||
| (5746.313) | |||
| Primary/GDP*STI/GDP*Highld | 4582.8 | ||
| (5304.414) | |||
| Resource/GDP*STI/GDP*Highld | -2038.4 | ||
| (1077.103)* | |||
| LowTech/GDP*STI/GDP*Highland | 851.8 | ||
| (2397.551) | |||
| MediumTech/GDP*STI/GDP*Highland | 304.6 | ||
| (181.1)* | |||
| HighTech/GDP*STI/GDP*Highland | -1500.5 | ||
| (5753.004) | |||
| Primary/GDP*STI/GDP*Coast | 3821.5 | ||
| (5030.852) | |||
| Resource/GDP*STI/GDP*Coast | -1537.4 | ||
| (1023.41)* | |||
| LowTech/GDP*STI/GDP*Coast | -1865.4 | ||
| (1987.455) | |||
| MediumTech/GDP*STI/GDP*Coast | 261.7 | ||
| (544.516) | |||
| HighTech/GDP*STI/GDP*Coast | 321.0 | ||
| (5589.685) | |||
| Constant | 0.572 | 0.568 | 0.590 |
| (0.067)*** | (0.092)*** | (0.064)*** | |
| N | 320 | 320 | 320 |
| F/ chi2 | 27.25 | 353.4 | 180364.11 |
| p-value | 3.95e-13 | 2.65e-68 | 00e-74 |
| R2 within | 0.353 | 0.352 | 0.453 |
| Region specific effects | Yes | Yes | Yes |
Standard errors in parentheses, * p<.10, ** p<.05, *** p<.01
Source: own elaboration.
In general, the results are globally significant as the p-value of the F statistic and the chi2 test are 0. The good-ness of fit of the information within departments is 35% for the parsimonious model and 45% for the extended model.
As far as the spatial concentration of population is concerned, some variables reflecting regional standard of living, municipal fiscal performance and GDP in several sectors are included. Firstly, the GDP per capita as expected has a positive effect on the level of population agglomeration. An increase of 1% in GDP per capita leads to an increase of 0.02 on average in the concentration index. This measure of the regional level of income per person may represent the economic attractiveness and size of the local market. This is in line with the theoretical configuration of population that Rauch’s (1991) model predicts: territories with large market forces will concentrate the population. To explain population concentration, a variable related to access to education was included, this being the share of educational activities in the total departmental GDP. This variable, however, does not affect the level of agglomeration. Other activities such as entertainment, culture and sports, and finance activities had a positive effect on population concentration. As expected these kinds of activities attract more people to specific places. An increase of one percent in entertainment and finance activities leads to an increase of 1.2 and 0.5 points respectively in the Theil index. In contrast, retail activities have a negative effect on the population concentration within departments as opportunities for consumption may not be reached by inhabitants will low purchasing power, which decreases their welfare (Winters & Li, 2016).
An increase of 1% in tax revenue increases the level of concentration by 0.004 points, meaning that tax revenues are invested to improve the welfare of the inhabitants of the department. The dissuasive effect of high taxes on population concentration (Baldwin & Krugman, 2004) does not prevail.
Regarding municipal fiscal performance, the own generation of income over total income has a positive effect on the level of population concentration. An increase of 1% in this variable, reflecting the level of efficiency, leads to a higher level of concentration of 0.13 more points.
As the proportion of financially precarious municipalities increases over the total, the level of population concentration decreases. A relocation of population might occur from risky municipalities to successful municipalities within the same department leading concentration to increase. In this case, populations may move to other departments, leading to a population deconcentration.
As in the ample literature of agglomeration, congestion effects arise at some point in the process of cumulative causation. This effect is captured with the variable of gas tax. High levels of gas tax imply increased use of vehicles in each department which indirectly reflects traffic volume and pollution in each department. An increase of 1% in gas tax leads to a decrease of agglomeration of 0.0019 points. This result is in line with Krugman and Elizondo (1996) who state that strong congestion effects lead to the dispersion of firms as they have the incentive to relocate far away from main cities.
Regarding our variables of interest, the results show that governmental investment in science, technology and innovation activity (STI) negatively influences the level of agglomeration. This result might be explained by the fact that governmental efforts in innovation are insufficient to change regional spatial configurations. Moreover, as Eaton and Kortum (1999) state, new technologies are the result of efforts in R&D investment, and innovation becomes productive only if it is diffused. In this case, diffusion of STI activities is scarce. Imports do not affect the intra-agglomeration, except for primary imports and high technology imports. Once these two variables, STI activity and imports, have interacted, they have a positive and significant effect on the level of agglomeration. Such a multiplicative term between STI and imports reflects a conditional relationship, showing that the effect of STI on agglomeration depends on the level of imports. The significant effect of the interaction term shows that these two forces of innovation and importation play together to enhance agglomeration within regions (Coe & Helpman, 1995). Science, technology and innovation activity is shaped by the level of imports (Santacreu, 2015). For the numerical interpretation of the interaction term, we consider the mean of imports/GDP equal to 0.028439 and the effect of STI/GDP on agglomeration is given by γ+0,028439λ, (see specification 1), which is -1.216+0.028439*30.14=-0.3588. This means that as imports increase, the effect of innovation on agglomeration increases. Thus, imports may have a role of technological dissemination (Grossman & Helpman, 1991). In this case, governmental efforts in STI are reinforced by imports. This might be due to the fact that imported goods can be used as inputs to produce innovative products or can be adapted to the local economy by a process of reverse-engineering or decoding the product design (Keller & Yeaple, 2009). Once this occurs, an effect on the level of agglomera-tion exists because more people are attracted to those places that have innovative products. On one hand, consumers increase their utility with the consumption of those products, and on the other hand, firms have the incentive to locate in those areas to benefit from knowledge spillovers.
Regarding the extended model that differentiates the type of imports, both primary imports and high technology imports reduce the level of population agglomeration within regions. This can be explained by the fact that agricultural products tend to be distributed to sparse populations, so an increase of this type of imports reduces spatial inequality.
The effect of imports on the agglomeration-innovation relationship varies depending on the type of imports according to their technological intensity and the region to which they arrive. To interpret interaction terms with regions, we fix, for example, Highland=1 and the Primary imports over GDP (Primary/GDP) to the mean across Highland regions of 2009 (0.0041365). The effect of STI/GDP on agglomeration is given by (α10,0041365(α7+α12)) following specification 2. Similarly, the effect of STI/GDP on agglomeration when Coast is equal to 1 and primary imports over GDP are equal to the mean of Coastal regions (0.0031927) is given by (α1(α7+0.0031927α17)). When primary imports increase and given that α7 <0,α12> 0,α17> 0,α1 <0 and α12> α7,α17> α7, the effect of STI/GDP on agglomeration increases in both Highland and Coastal regions. For the case of Amazon/Orinoquia, at the mean of Primary/GDP (0.0001891), the effect of STI/GDP on agglomeration is given by (α1+0.0001891α7). For an easier interpretation of the variables involving interactions, the net effects are presented in table 6.
Having explained the interpretation, we observe that the interaction between innovation and imports plays differently across regions according to their characteristics. Most of the interaction terms are not significant, which can indicate that governmental investment in STI activities is not reinforced by all import types, nor in all regions. As Keller (2004) stated, a significant innovation effect is neither inevitable, nor automatic; rather it depends on regional absorptive capacity. As shown in table 6 of net effects, primary imports do not affect the effect of STI on the level of agglomeration in any region. Resource-based imports are significant in all regions and they negatively affect the relationship between agglomeration and STI. This means that this type of product cannot be exploited for innovation, provoking a dispersion effect, which is higher in the Coast and Highland regions than in the Amazon/Orinoquia regions.
Table 6 Net effects of STI/GDP on agglomeration given a level of imports by type, aggregated imports.
| Imports/GDP | Primary/GDP | Resource/GDP | LT/GDP | MT/GDP | HT/GDP | |
|---|---|---|---|---|---|---|
| Mean general | 0.0284 | |||||
| Mean Highland | 0.0041 | 0.0054 | 0.0037 | 0.0109 | 0.0022 | |
| Mean Coast | 0.0032 | 0.0236 | 0.0032 | 0.0238 | 0.0063 | |
| Mean Amaz/Orinoq | 0.0019 | 0.0001 | 0.0002 | 0.0001 | 0.0003 | |
| General net effect | -0.3588 | |||||
| Highland net effect | 8.9039 | -5.0478* | -2.8818 | 0.2007* | -3.3339 | |
| Coast net effect | 4.1534 | -5.9667* | -11.1830 | 0.9042 | 4.2939 | |
| Amaz/Orinoq net effect | -5.2824 | -1.1011* | -1.5687* | -1.2738 | -1.1127 |
Source: own elaboration.
An increase of Low Technology imports leads to a negative net effect of STI activity on agglomeration in the Amazon/Orinoquia region. In line with the predictions of Nishikimi (2008), Alonso-Villar (1999) and Crozet and Koenig (2004), the net effect of STI activity on agglomeration increases in advantaged departments of the Highland region when medium technology imports increase. This can reflect the degree of regional absorptive capacity. Thus, new technology developed abroad benefits the local economy (Grossman & Helpman, 1991). Medium technology engineering and automotive imports are being adapted or copied; so the investment in innovation in those industries has a positive agglomeration effect in the Highland region.
With regard to high technology imports, their increase does not influence the STI effect of agglomeration in any region. This means that Colombian departments have a low absorptive capacity for these imports with a high level of technological intensity and, therefore, innovation has a weak effect on agglomeration.
Comparing the effects of STI activity on agglomeration across regions, it is negative when imports with low tech-nological intensity increase in the Amazon/Orinoquia and positive when imports with medium technological intensity increase in the Highland regions. This can be explained by the fact that Highland regions are economically more developed than the Amazon/Orinoquia regions. In addition, the Highland regions are more urbanized. The absorptive capacity for technological goods is eased in such an environment where road and communications infrastructure is adequate and firms are close to each other and to their suppliers, allowing them to interchange information. Thus, main cities become much larger since the importing activity is more likely to be devoted to the development of local industry. Moreover, foreign technological knowledge transmitted by imports increases domestic technology stock, and in turn, raises domestic productivity in Highland regions (Keller, 2004; Eaton & Kortum, 2006), resulting in a greater population concentration.
To conclude, in the Highland regions, the agglomeration forces of innovation are enhanced by medium technology imports. In all regions, the dispersion forces of innovation are enhanced by resource-based imports.
The STI effect on agglomeration is then shaped by the level of different types of imports. Such an effect is significant after controlling for other variables that affect population agglomeration.
6. Conclusions
This study was inspired by the fact that concentration occurs not only between regions but also within them. This intra-regional inequality characteristic must be considered a general fact for all countries. In an attempt to determine how STI activity influences intra-agglomeration, this paper sheds light on the role of imports. Interesting findings were obtained; first, the agglomeration effect of government investment in STI activity is reinforced by imports; second, such an effect varies according to the type of imports and regional characteristics. In the Amazon/Orinoquia regions, the agglomeration effect of STI is negative when low technology imports increase. This may be due to the weak absorptive capacity of these regions to adapt to or imitate technology contained within imports. On the other hand, the level of agglomeration in the Highland regions increases with STI activity when imports with medium technology increase. The technological nature of imports matters. Some imports are more susceptible to being imitated or adapted for local innovation, whereas other imports, generally with more technological intensity, cannot be easily copied. This also depends on the absorptive capacity of each region. Thus, imports with high technological intensity positively play on the STI effect on agglomeration in the Coastal and the Highland regions, whereas in the Amazon/Orinoquia regions the effect is negative, inducing dispersion.

