


 English (pdf)
 Article in xml format
 Article references
 Send this article by e-mail
 Cited by SciELO
  Cited by Google
  Similars in
SciELO
Similars in
SciELO  Similars in Google
 Permalink
1. Introduction
Insolvent companies and their creditors are affected when they enter the insolvency process. Effective insolvency prediction is relevant for creditors to make appropriate decisions and in order to reduce credit risk (Liang, Lu, Tsai, & Shih, 2016). In Colombia, insolvency is part of the bankruptcy system and is regulated by law 1116 (2006). This law allows companies which are having financial problems more time to pay outstanding sums, as well as the possibility to refinance their debts. Wilches (2008) remarks that the regulation was introduced with the aim of keeping the economy working and avoiding mass layoffs. Nevertheless, companies going into insolvency directly affect the financial performance of their customers, creditors, suppliers and investors. As a result, the financial situation of every company asking for credit or investment should be evaluated (Fonseca, 2007).
According to Amendola, Giordano, Parrella and Restaino (2017) financial ratios provide relevant information that can help to define whether companies are likely to incur bankruptcy or other financial problems. By evaluating liquidity, profitability and debt (López & Sanz, 2015) firms can be classified as potential borrowers. Lartey, Antwi and Boadi (2013) indicate that through liquidity analysis, creditors and suppliers are able to determine whether a specific company has the capacity to pay its debts on time. Furthermore, since profitability should converge with liquidity as part of a firm’s broader financial health (Nissim & Penman, 2003), profitability analysis provides the tools to evaluate firms’ efficiency and capacity to sustain their financial results in the future. Moreover, debt levels show the level of support from owners. Yazdanfar and Öhman (2015) have shown that there is an inverse relationship between investors’ participation in capital structure and credit risk. The less involved investors are in the capital structure of a company, the higher the level of credit risk.
This study aims to fill the gap in the literature identified by Amendola et al. (2017). On one hand, statisticians have focused their efforts on developing prediction models, but they usually develop these models with several financial ratios and do not define bankruptcy according to the relevant regulations. On the other hand, although financiers have defined the most accurate ratios to evaluate companies’ financial performance while using legal definitions of bankruptcy, they usually employ traditional methodologies in their predictions. Since traditional methodologies assume the presence of symmetrical datasets (Calabrese & Osmetti, 2013), these researchers are required to bias the sample in order to reach accurate predictions.
Through a sample of 11,812 companies during the period 2012-2016, of which 99.5% were non-insolvent and 0.5% were insolvent firms, the objective of this study is to predict insolvency for Colombian firms one, two and three years beforehand through financial ratios, while keeping the original sample structure. The prediction was developed using a boosting algorithm proposed by Freund and Schapire (1997). According to Le et al. (2018), this algorithm allows researchers to make predictions in imbalanced data sets, as is the case for insolvent and non-insolvent companies. In addition, a study carried out by Kim, Kang and Bae (2015) showed that results using boosting an algorithm are generalizable at different imbalance rates.
This study contributes to the literature because unlike many studies; insolvency legislation, financial analysis and sample characteristics were considered when making the prediction. The experimental results also prove that boosting algorithm has an advantage over traditional methodologies for predicting insolvency in imbalanced data sets. The results show, in agreement with Du Jardin (2015), that predictions are less accurate when models are estimated with more years of anticipation. However, the results from using the algorithm show that it is an effective tool for evaluating insolvency risk (Kim et al., 2015) in real conditions for Colombian firms. This study offers important information for investors, suppliers, bankers, and governments. With the proposed model, organizations can reduce their credit risk and avoid running into losses.
The rest of the article is organized as follows: in section 2, a literature review is presented alongside a description of insolvency legislation in Colombia and a characterization of financial ratios. In section 3, the method and the sample of the research are described. In section 4, the results of the prediction are presented and analyzed, and in section 5 the conclusion is given.
2. Literature review
This section provides a literature review of insolvency prediction, taking into account Colombian regulations and previous studies that have predicted bankruptcy using financial ratios and boosting algorithms.
2.1. Insolvency legislation in Colombia
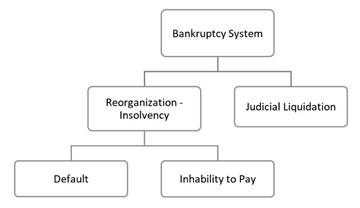
In Colombia, law 1116 (2006) regulated the bankruptcy system and created two stages. On the one hand, there are companies which close their operations definitively due to a decision of the owner(s) or the authorities (Mora, 2014). This stage is called judicial liquidation. On the other hand, there are companies which are in non-payment due to financial difficulties (Ochoa, Toro, Betancur, & Correa, 2009). This stage is called restructuring, but it is also known as insolvency. Companies can enter restructuring for two reasons: either they default, or they are unable to pay their obligations (Ley 1116, 2006). Figure 1 shows the bankruptcy system in Colombia.
The insolvency stage was created with the purpose of avoiding patrimonial liquidation of companies (Wilches, 2008). Insolvent firms continue to receive support from their creditors (Rodríguez, 2008) to avoid any interruption in their normal operations. Forecasting insolvency is important not only for banks (Hernandez & Wilson, 2013), but also for creditors in general, as it would be inappropriate for them to provide credit to a company that will be unlikely to repay it (Ben, 2017). Furthermore, when companies enter restructuring, their creditors are obligated to continue providing them with credit (Fonseca, 2007). The only obligation for companies in restructuring is that they cannot stop paying their new debts from the moment it begins (Wilches, 2009). In other words, debts incurred before companies enter insolvency can be renegotiated or they can pause the payment of these debts for up to eight months (Rodríguez, 2008).
Judicial liquidation indicates that a company will cease to operate (Nishihara & Shibata, 2016). In this case, the assets of the company are sold (Romero, Melgarejo & Vera, 2015) in order to pay their liabilities according to the law. The main difference between restructuring and judicial liquidation (Rodríguez, 2008) is that companies that begin restructuring have financial problems, and this situation can be evaluated through financial statements. On the other hand, companies can enter judicial liquidation for different reasons (Romero et al., 2015) which are not necessarily related to financial statements.
This study is focused on predicting insolvency as our principal information sources are financial statements. Furthermore, restructuring has a stronger financial effect on creditors than judicial liquidation because, according to Wilches (2008), when companies enter insolvency, their creditor cannot recover their accounts receivable immediately, this situation affects their cash flow and in some cases it can affect their operations as well (Bauer & Agarwal, 2014).
2.2. Insolvency prediction using financial ratios
Financial statements provide relevant information (Amendola et al., 2017) related to companies’ investments, finances and dividend decisions (Cultrera & Brédart, 2016). This information is usually the principal source for evaluating the main financial objective, which is firm value maximization (Ng & Rezaee, 2015). Nevertheless, due to bankruptcy being the opposite situation of firm value maximization (Bauer & Agarwal, 2014), information provided by financial statements can help to warn of impending insolvency. According to Altman (1968), financial ratios emerge from the relations between variables in financial statements, and one of their most useful applications is to measure the credit risk (Mongrut, Fuenzalida, Alberti, & Akamine, 2011) of a specific firm.
Financial ratios have been used since early studies carried out by Beaver (1966) and Altman (1968) to predict bankruptcy. According to Hernández and Wilson (2013) bankruptcy researches have been focused on developing the best statistical model to predict it using financial ratios. However, Amendola et al. (2017) affirm that some subjects are not explored enough in bankruptcy prediction and an appropriate selection of financial ratios (Wang, Ma, & Yang, 2014) is necessary to provide accurate predictions.
Several categories of financial ratios have been used in financial literature. Beaver (1966) classified them in six groups: cash-flow, net-income, debt to total-asset, liquid-asset to total asset, liquid-asset to current debt, and turnover ratios. Later, Liang et al. (2016) divided financial ratios into nine categories, based on Beaver (1966), but with the addition of three new categories in accordance with the work of Fedorova, Gilenko and Dovzhenko (2013): ownership structures, growth and retention of key personnel.
However, authors such as Ochoa et al. (2009) and López and Sanz (2015) classify financial ratios with fewer categories that can be summarised as liquidity, profitability and debt. Liquidity is a short-term variable (López & Sanz, 2015) that determines the ability to pay short-term debts and the necessary expenses of daily operations. Through liquidity analysis, creditors are able to evaluate the efficiency and capacity of a firm to fund debts as they fall due (Lartey et al., 2013). Ratios related to operational performance and cash flows are considered to be in this category (Du Jardin, 2015).
According to Lartey et al. (2013) profitability is a long-term variable that shows the capacity to produce earnings with a minimum investment. Nissim and Penman (2003) show that there is a strong relationship between profitability and liquidity because they tend to converge over time as companies improve their financial positions. In this context, creditors should not only evaluate liquidity (Amendola et al., 2017); but should also take profitability into account in order to consider the firm’s ability to generate sufficient liquidity to pay its debts in the future (Lartey et al., 2013).
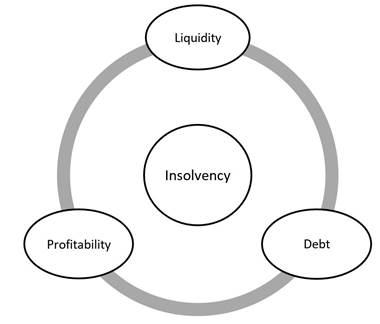
Debt financial level is an important issue for every company. Every firm should find the optimal capital structure to maximize profitability and firm value (Yazdanfar & Öhman, 2015). Due tofinancial debts are less expensive than equity (Mu, Wang, & Yang, 2017), especially for the interest tax shields (Vo, 2017), companies tend to have a preference for financial debts than equity. On the other hand, it has been demonstrated that high debt increases the likelihood of insolvency (De Mooij & Hebous, 2018). An elevated participation of creditors in the firm’s capital structure indicates reduced support from the owners, Yazdanfar and Öhman (2015) state that a low level of investor participation in the capital structure repre-sents a high risk for new creditors, since companies should first pay off their previous liabilities. In agreement with the previous literature, we use three categories to predict restructuring as shown in figure 2.
Although bankruptcy prediction has been studied by several authors including Charitou, Dionysiou, Lambertides and Trigeorgis (2013), Olson, Delen and Meng (2012), and Mongrut et al. (2011), there is a gap in the literature derived from previous statistical and financial approaches (Amendola et al., 2017). Statistical studies are often focused on developing the best model to predict bankruptcy (Calabrese & Osmetti, 2013). Nevertheless, statistical studies disregard the appropriate use of financial ratios as Amendola et al. (2017) affirm. In addition, the use of large groups of financial ratios remains accuracy and applicability to models. In a study by Liang et al. (2016) 95 financial ratios were used to predict bankruptcy. Similarly, Ben (2017) carried out a study comparing logistic regression and partial least squares logistic regression using 33 financial ratios. A total of 24 financial variables were used in research by Wang et al. (2014).
On the other hand, financial studies that predict bankruptcy consider traditional methodologies which do not take into account dataset asymmetry (Calabrese & Osmetti, 2013). To deal with this limitation, authors bias the sample in order to attain symmetry in the datasets. In a study carried out by Du Jardin (2015), the sample was divided into two symmetrical groups including the same number of failed and non-failed companies. The same process was used in the papers by Ben (2017), Altman, Iwanicz-Drozdowska, Laitinen and Suvas (2017), and Cultrera and Brédart (2016). Although the accuracy ratio of these studies is high, it is not appropriate to use them due to there being in reality more non-bankrupt than bankrupt firms.
In this paper, both statistical and financial approaches were used in order to reach accurate insolvency predictions using important financial ratios identified by the literature (Beaver, 1966; Liang et al., 2016). Additionally, we used the Boosting AdBoost.M1 algorithm used by Wang et al. (2014), Pérez, Lopera and Vásquez (2017) and Jones, Johnstone and Wilson (2017) to control for asymmetric structure and reach better prediction results.
3. Methodology
In this section, the prediction process of using a boosting algorithm is described. Furthermore, the sample of companies considered in this study is discussed. Finally, the categories and calculation of financial ratios used to predict insolvency are explained
3.1 Boosting algorithm
Boosting is a classification algorithm that combines the output of many weak classifiers to generate a powerful committee (Hastie, Tibshirani, & Friedman, 2008). The most popular algorithm was developed by Freund and Schapire (1997) and is known as AdaBoost.M1. In order to explain this algorithm, the authors consider a binary classification problem where the output variable is codified as Y i Ԑ{-1,1} (1). A classifier G(X i ) produces a prediction from a vector of explanatory variables x i = (1,x 2i , x 3i ,...,x ki )´(2) its error rate on the training sample, according to Hastie et al. (2008), is:
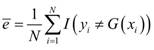 (3)
(3)
A weak classifier has a better error than a random classifier. The objective of boosting is to sequentially apply the weak classifier to modified version data in order to generate weak classifiers G m (x i ), m = 1,2,...,M. The final predictions of all classifiers are combined through the weighted majority vote in order to reach the final forecast.
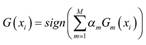 (4)
(4)
In this case α1,α2,...,αM are calculated by the boosting algorithm, and they give the weight of each classifier in the final classifier. As a result, the most accurate classifiers in the sequence are more influential. Hastie et al. (2008) remark that the data modification consists of applying weightsw 1 ,w 2 ,...wN to each training observation (x i ,y i ),i = 1,2,...,N (5). Firstly, the weights are calculated as w i =1/N (6); in this step the algorithm trains the model in the normal way. For each iteration (m), the wi are modified and the algorithm is applied to this new data. At step m, the misclassified observations by the classifier Gm-1(x i ) have their weights increased, while the weights of the correctly classified observations are decreased. In this context, observations that are difficult to classify correctly receive higher weightings. AdaBoost.M1 algorithm steps are formally expressed as follows:
1. Calculate w i =1/N for i = 1,2,...,N (7)
2. For m = 1,2,...,N (8)
a. Fit a classifier G m-1 (xi) to the training data using weights wi.
b. Compute the error rate of each step m,
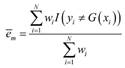 (9)
(9)
c. Compute
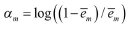 (10)
(10)
d. Calculate
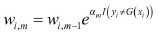 (11)
(11)
3. Calculate the prediction given by
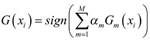 (12)
(12)
According to Roumani, Nwankpa, and Tanniru (2019) this methodology has shown to be more accurate in predicting insolvency when there is a data imbalance issue. In traditional bankruptcy prediction studies, the original sample is often divided into two groups (failed and non-failed firms) with the same number of observations. However, through the use of a boosting algorithm it is possible to predict bankruptcy without modifying the original dataset (Kim & Ahn, 2015). This methodology facilitates the prediction of bankruptcy in real-world conditions.
3.2. Sample and variables
In this study, financial information was collected from the Corporate Superintendence for the period 2012-2016. Insolvent companies were selected according to a dataset published by the Corporate Superintendence in 2017 based on firms which were being restructured. Insolvent companies considered in this study began restructuring in 2017. The development of the boosting algorithm was made on the basis of a sample of 11,812 Colombian firms, which were observed over five years. Table 1 summarizes the composition of companies which were studied. Clearly, there is data asymmetry in the sample distribution; the majority of firms (99.5%) are in non-insolvency while the minority are insolvent (0.5%).
Table 1 Distribution of companies by status
| Category | Companies | Distribution |
|---|---|---|
| Non-insolvent | 11,754 | 99.5% |
| Insolvent | 58 | 0.5% |
| Total | 11,812 | 100.0% |
Source: own elaboration.
The prediction was made one (t-1), two (t-2) and three (t-3) years in advance. To make the forecast, financial information from the preceding three years was considered in order to recognize historical financial performance in the model (Du Jardin, 2015). In this context, to predict insolvency one year (t-1) ahead, financial information from 2014-2016 was taken into account to develop the model, information from 2013-2015 was used to forecast two years (t-2) ahead, and information from 2012-2014 was employed to foresee insolvency three years (t-3) ahead.
In order to process the dataset, we took ten financial ratios, which were chosen from the relevant literature (Ben, 2017). According to Ochoa et al. (2009) and López and Sanz (2015), liquidity, profitability and debt ratios were used in the prediction process. Table 2 shows applied ratios in the forecast process. The dependent variable is insolvency; when a company is in this stage, it takes a value of “1”, and a value of “0”otherwise.
Table 2 Variables and definition
| Category | Variable | Calculation |
|---|---|---|
| Liquidity | Relation operational net working capital (ONWC) to sales | ONWC/Sales (13) |
| Liquidity | Free cash flow | Net cash from operating activities+Capex* (14) |
| Profitability | Asset turnover | Sales/Operating assets (15) |
| Profitability | Return on Assets -ROA- | Net profit/Assets (16) |
| Profitability | Return on Equity -ROE- | Net profit/Equity (17) |
| Debt | Debt to asset ratio | Liabilities/Assets (18) |
| Debt | Debt concentration | Current liabilities/Total liabilities (19) |
| Profit margin | Gross profit margin | Gross profit/Sales (20) |
| Profit margin | Operating profit margin | Operating profit/Sales (21) |
| Profit margin | Net profit margin | Net profit/Sales (22) |
* Capital expenditures
Source: own elaboration.
In bankruptcy studies, variance stability issues are one of the many challenges. Variables have different distributions; there are outliers, skewness and kurtosis (Jones et al., 2017) that can affect the prediction power of the model. In order to avoid these issues, the data transformation proposed by Yeo and Johnson (2000) was used. This is because this transformation, as opposed to the Box-Cox transformation proposed by Box and Cox (1964) or exponential transformation proposed by Manly (1976), works with negatives or variables of a value equal to zero.
4. Results and discussion
Determining whether it is possible to differentiate be-tween non-insolvent and insolvent firms through the chosen ratios before making the prediction is important. Table 3 shows the descriptive statistics and difference in company medians.
Table 3 Descriptive statistics and Difference in medians
| Variable | Non-insolvents | Insolvents | Confidence interval α=0.05 | ||||
|---|---|---|---|---|---|---|---|
| Median | Mean | Sd | Median | Mean | Sd | ||
| ONWC/Sales | 0.205 | 265.268 | 22,114,710 | 0.248 | 0.563 | 1.289 | -0.182≤median≤ -0.001 |
| Free cash flow | 70,027 | -353,438 | 44,857,815 | -198,303 | -622,503 | 2,909,571 | 78,274≤median≤365,308.6 |
| Asset turnover | 0.188 | 87.992 | 5.639 | 0.254 | 0.787 | 2.224 | -0.122≤median≤-0.023 |
| ROA | 0.038 | 0.044 | 0.100 | 0.000 | -0.006 | 0.077 | 0.029≤median≤0.046 |
| ROE | 0.085 | 0.091 | 2.248 | 0.012 | 0.011 | 0.452 | 0.023≤median≤0.118 |
| Debt to asset ratio | 0.491 | 0.483 | 0.252 | 0.650 | 0.633 | 0.168 | -0.198≤median≤-0.096 |
| Debt concentration | 0.819 | 0.747 | 0.245 | 0.700 | 0.659 | 0.253 | 0.026≤median≤0.218 |
| Gross profit margin | 0.320 | 0.366 | 5.539 | 0.224 | 0.301 | 0.376 | 0.048≤median≤0.128 |
| Operating profit margin | 0.068 | -29.069 | 2,111 | 0.044 | 0.048 | 0.468 | 0.005≤median≤0.042 |
| Net profit margin | 0.036 | 26.441 | 3,409 | -0.005 | -0.339 | 2.093 | 0.026≤median≤0.054 |
Source: own elaboration.
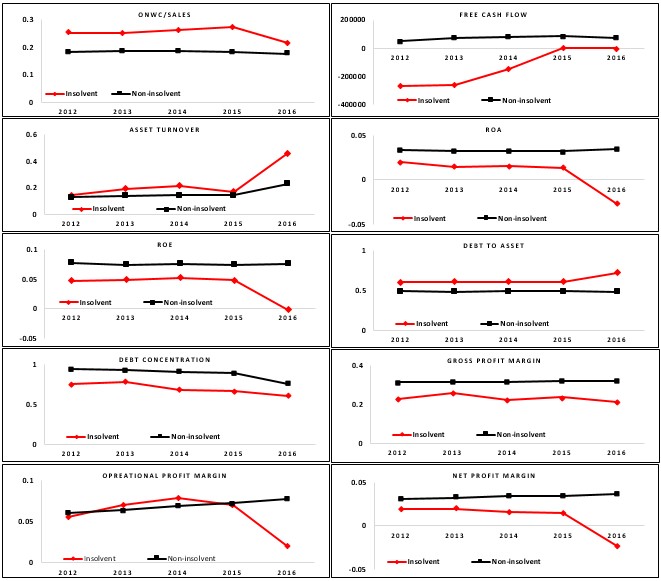
According to table 3, non-insolvent firms have better financial performance than companies which were declared insolvent in 2017. Non-insolvent businesses allocate a lesser portion of their sales to operational investments in the short term (operational net working capital), their free cash flow is positive and greater than insolvent enterprises during the evaluated period. Moreover, non-insolvent companies have better profit margins than insolvent ones; meaning that non-insolvent companies have better financial results and better Return on Assets (ROA) and Return on Equity (ROE). Finally, firms which began the insolvency process in 2017 have a debt to asset ratio greater than 50% and are more indebted than healthy companies.
In figure 3, it is possible to identify that the financial ratios chosen are better for non-insolvent companies, as found by Lartey et al. (2013). Since the chosen ratios have the capacity to differentiate the results of non-insolvent and insolvent firms, the measurements can be used to predict insolvency through a boosting algorithm.
In this paper, the use of a boosting algorithm is proposed to predict insolvency and reduce the losses of stakeholders such as suppliers, customers, the government, financial institutions and shareholders. Table 4 shows the confusion matrix, which contains the accuracy of the model to properly classify company insolvency and non-insolvency. Data was randomly divided into two groups to train and test the model. A random sample composed of 80% of the total data was used to train the model; meaning that this dataset was composed of 9,403 non-insolvent and 46 insolvent companies. On the other hand, 20% of the total data was employed to test the model, which corresponds to 2,351 non-insolvent and 12 insolvent companies. We chose 80% of observations to train the model because there were fewer insolvent firms, and it was necessary to have a large number of companies to train the model in order to obtain accurate results from the test sample. This proportion was selected according to previous studies ( Barboza, Kimura, & Altman, 2017; Le et al., 2018). Le et al. (2018) suggest that the results of the prediction are generalizable if the majority of the sample is used to train the model.
Table 4 Confusion matrix for insolvency
| Classification | t-1 | t-2 | t-3 | ||||||
|---|---|---|---|---|---|---|---|---|---|
| Insolvent | Non- insolvent | Total Prediction | Insolvent | Non- insolvent | Total Prediction | Insolvent | Non- insolvent | Total Prediction | |
| Insolvent | 48 | 925 | 973 | 44 | 3,416 | 3,460 | 39 | 2,938 | 2,977 |
| Non-insolvent | 10 | 10,829 | 10,839 | 14 | 8,338 | 8,352 | 19 | 8,816 | 8,835 |
| Total Companies | 58 | 11,754 | 11,812 | 58 | 11,754 | 11,812 | 58 | 11,754 | 11,812 |
Source: own elaboration.
Table 4 shows the number of companies classified correctly and incorrectly. In this case, 48 (t-1), 44 (t-2) and 39 (t-3) of insolvent companies were classified properly. According to Wang et al. (2014), this classification is called True Positive (TP). In accordance with the results, 10 (t-1), 14 (t-2) and 19 (t-3) of insolvent companies were classified erroneously. This part of the matrix is called False Negative (FN). On the other hand, 10,829 (t-1), 8,338 (t-2) and 8,816 (t-3) of non-insolvent firms were classified correctly. This classification is called True Negative (TN). Finally, 974 (t-1), 3,416 (t-2) and 2,938 (t-3) of non-insolvent companies were classified incorrectly. This classification is known as False Positive (FP).
In order to evaluate the performance of the model, three ratios were calculated. These measures are shown in table 5.
Table 5 Performance measures of the model
| Measure | t-1 | t-2 | t-3 |
|---|---|---|---|
| Type I error | 7.9% | 29.1% | 25.0% |
| Type II error | 16.7% | 25.0% | 33.3% |
| Average accuracy | 92.1% | 71.0% | 75.0% |
Source: own elaboration.
All measures were calculated according to Wang et al. (2014). A Type I error is calculated as FN/(TP+FN) (23), and indicates that there is a probability of 7.9% (t-1), 29.1% (t-2) and 25% (t-3) of classifying a non-insolvent company as an insolvent one. A Type II error is calculated as FP/(FP+TN) (24), and shows that there is a probability of 16.7% (t-1), 25% (t-2) and 33.3% (t-3) of classifying an insolvent company as a non-insolvent one. Both types of errors have financial consequences for companies. A Type I error implies a reduction of profits due to the erroneous rejection of a customer that would have been able to pay their debts. On the other hand, a Type II error implies both reduction of profits and free cash flow since the company agreed to lend money to a client that will not repay it. In this context, a Type I error is less harmful than a Type II error, since they are rejecting credit for companies which have payment capacity. Nevertheless, the financial consequences can be severe when companies incur a Type II error since they are giving credit to a company which is highly likely to become insolvent.
Finally, the average accuracy indicates the percentage of insolvent and non-insolvent companies classified correctly. In general, the average accuracy of the model was 92.1% (t-1), 71% (t-2) and 75% (t-3). Table 6 shows a comparison among the results obtained using the boosting algorithm and other models developed by different authors.
Table 6 Prediction comparison
| Model | t-1 | t-2 | t-3 | Sample | Author |
|---|---|---|---|---|---|
| Boosting algorithm | 92.1% | 71.0% | 75.0% | 11,754 Non-insolvent 58 Insolvent | Proposed model |
| Logistic regression | 54.1% | 50.0% | 50.0% | 11,754 Non-insolvent 58 Insolvent | Cultrera and Brédart (2016) |
| Support vector machine | 50.0% | 50.0 | 50.0 | 11,754 Non-insolvent 58 Insolvent | López and Sanz (2015) |
Source: own elaboration.
The results obtained in this study were compared with two different models (logistic regression and support vector machine) in order to evaluate the accuracy of the boosting algorithm. Logistic regression and support vector machine were applied to our database to reach a better comparison among these models. In general, boosting has a better result than the models proposed by Cultrera and Brédart (2016) and López and Sanz (2015) to predict one, two and three years in advance. The accurate results shown in Cultrera and Brédart (2016) and López and Sanz (2015) were obtained through symmetrically biased samples (Calabrese & Osmetti, 2015), which is unrealistic as there are more non-insolvent than insolvent companies in the economy.
Finally, table 7 shows the relative importance of each variable in the prediction. It is possible to evaluate the importance of liquidity, profitability and debt ratios in the prediction. Profitability ratios are relatively the most important for the purposes of predicting insolvency with 92.48% (t-1), 87.05% (t-2) and 78.53% (t-3). These results imply that profitability ratios are the most important when evaluating the financial health of a company, especially the ROE ratio, which on average is the ratio with most relative importance.
Table 7 Relative variable importance
| Variable | t-1 | t-2 | t-3 |
|---|---|---|---|
| ONWC/Sales | 0.01% | 0.16% | 3.37% |
| Free cash flow | 1.03% | 2.28% | 0.32% |
| Asset turnover | 0.06% | 0.46% | 0.53% |
| ROA | 1.10% | 0.97% | 0.41% |
| ROE | 91.32% | 85.61% | 77.59% |
| Debt to asset ratio | 1.17% | 1.99% | 0.51% |
| Debt concentration | 0.02% | 0.17% | 15.28% |
| Gross profit margin | 5.17% | 0.10% | 1.08% |
| Operating profit margin | 0.07% | 0.04% | 0.42% |
| Net profit margin | 0.05% | 8.21% | 0.49% |
| Total | 100% | 100% | 100% |
Source: own elaboration.
According to do Prado, Carvalho, Benedicto and Lima, (2019) profitability is one of the most important financial aspects for companies, especially ROE. In the long term, ROE might support the capacity of a company to achieve cash flows that can be designated as dividends for investors. In this context, this ratio directly affects investor decisions and when the ROE is low, investors usually decide not to continue with investment since their expectations are unfulfilled (Altman et al., 2017).
Moreover, Nissim and Penman (2003) have argued that profitability and liquidity converge in the future. In this context, profitability analysis provides the tools to evaluate a firm’s efficiency and capacity to sustain financial results in the future. Efficient and profitable firms are able to make cash flow constantly and therefore these companies are able to support large debts in the short and long term (Ben, 2017).
5. Conclusion
Few studies have built prediction models considering rare events (Calabrese & Osmetti, 2013). Although there are more non-insolvent than insolvent companies in Colombia, this is one of the primary studies that uses a methodology that considers the imbalanced data set issue. Through estimation of Type I and Type II errors, global accuracy, and the confusion matrix, we found that boosting performs better on average than other methodologies that assume symmetry in datasets.
This research appears to be the first to have considered insolvency regulation, explained the different types of financial ratios in order to choose the most accurate for predictions in Colombia, and used a boosting algorithm without biasing the sample of the companies studied. Furthermore, considering non-insolvent and insolvent companies when developing the proposed model allowed us to measure the accuracy of the model and the probability of making Type I and Type II errors through the confusion matrix.
Our results align with findings from López and Sanz (2015) and Du Jardin (2015). Boosting and other models achieve lower accuracy when the prediction is made further ahead of time. On the other hand, this study proved that profitability ratios are the best predictors for insolvency. These results are also aligned with Ben (2017), who demonstrated that investors are those who decide on the continuity of a company. When their expectations are not met, they will probably decide to cease investing.
One of the most important implications is that this study gives customers, investors, suppliers, bankers and governments important information to make financial decisions; like avoiding advance payment, investments or giving credit to companies that will not have the financial capacity to pay. In this context, throughout the proposed model, companies might make better financial decisions and reduce future losses.
The unavailability of complete accounting information for all companies in the database was one of the most important challenges we faced. It effectively ruled out some companies and therefore reduced the size of the sample considered in the study. Moreover, not all companies reported financial information during the period 2012-2016 to the Corporate Superintendence, which reduced the sample as well.
Finally, there are several possible directions for future research. In this study insolvency forecasting was the focus; however, the prediction of judicial liquidation is important as well. Companies that are in judicial liquidation have to change their accounting basis as they do not satisfy the going concern assumption and this has to be informed through the audit report. Another direction is to consider non-financial information like CEO characteristics, board direction and company age in order to determine whether the characteristics of decision makers have an impact on insolvency.

