


 English (pdf)
 Article in xml format
 Article references
 Send this article by e-mail
 Cited by SciELO
  Cited by Google
  Similars in
SciELO
Similars in
SciELO  Similars in Google
 Permalink
1. Introduction
One of the accounting regulator’s main concerns is that financial statements provide useful information for users in their decision-making process. The amount of information included in financial statements has increased over the years in an attempt to meet the information needs expressed by accounting bodies and the accounting literature, with the aim of improving their usefulness for the different stakeholders (American Institute of Certified Public Accountants - AICPA, 1987; AICPA, 1994; Lev & Zarowin, 1999; Francis & Schipper, 1999). It has been argued that risk is one of the main areas where information is lacking (Institute of Chartered Accountants in England & Wales (ICAEW), 1997; Solomon, Solomon, Norton, & Joseph, 2000; Cabedo & Tirado, 2004). Various accounting bodies have considered this lack of risk information and have consequently issued rules governing the presentation of this type of information in financial statements.
The issuance of disclosure regulations has opened up an interesting line of research into the utility of this information for different users, specifically; investors, those who prepare the information, and analysts. Two different approaches have been used to analyse utility: a direct approach, asking users about the usefulness of risk information (Abraham, Marston, & Darby, 2012; Association of Chartered Certified Accountants (ACCA), 2014; Sarens & D’Onza, 2017); and an indirect approach, based on observing capital market reactions through analysis of the behaviour of certain market variables, such as price, trading volume, yield and spread (Campbell, Chen, Dhaliwal, Lu, & Steele, 2014; Kravet & Muslu, 2013; Hope, Hu, & Lu, 2016; Miihkinen, 2013; Nelson & Rupar, 2015; Filzen, 2015; Jorion, 2002). These studies report contradictory results. In general terms with the direct approach, authors have called into question the utility of risk information for various reasons: information is too generic, repetitive and difficult to verify (ICAEW, 2011; ACCA, 2014). With the indirect approach, however, results generally show that the capital market appreciates risk information, al-though some studies report results that contradict the theoretical assumptions (Kravet & Muslu, 2013; Campbell et al., 2014).
Most of the studies related to the risk information disclosure analyse its usefulness for a specific group of stake-holders i.e. investors. However, there are a few studies that have focused on the usefulness of this disclosure for other stakeholders such as financial analysts. Among these studies, the works of Abraham et al. (2012) and Sarens and D’Onza (2017) are relevant. These authors asked financial analysts about the usefulness of the risk information disclosed. Their results show a disparity of opinions among analysts; whilst one group perceives this information as irrelevant because it is too generic and repetitive, another group considers disclosed risk information useful. In the same vein, Kravet and Muslu (2013) have shown that the greater the disclosure of risk information, the greater the dispersion in analysts’ profit forecasts around the date of publication of financial statements. Nevertheless, the accounting literature, up until now, has not tackled how risk information disclosure impacts on analysts’ forecasts of future profits. This paper endeavours to address this omission through a study of Spanish firms.
The present paper uses the indirect approach to study the hitherto unexamined impact of risk information on the accuracy of financial analysts’ earnings forecasts. It must be remembered that financial analysts use both public and private sources of information to evaluate firms’ performance and make earnings forecasts (Healy & Palepu, 2001; Francis & Schipper, 1991). The data in financial statements is an important source of information (Ramnath, Rock, & Shane, 2008). In theory, more comprehensive detail on risks should reduce uncertainty for users (including analysts) regarding future cash flow and earnings, improving the quality of their forecasts and thus having a positive impact on accuracy.
This empirical study is based on a sample of firms trading on the Spanish capital market with data for the period between 2010 and 2015. The impact of risk information on analyst forecasts was determined by running a regression analysis with panel data. The models use analysts’ earnings forecast errors as the dependent variable and disclosed risk information as the independent variable. The degree of disclosed risk information was quantified using the index proposed by Cabedo and Tirado (2009). These authors built a risk disclosure index based on the content rather than on the amount of information disclosed (the technique used in most studies involves taking the number of key phrases or words as an indicator of the amount of disclosed risk information). Control variables have also been introduced which, according to the literature, affect the accuracy of analysts’ earnings forecasts (size, leverage, analyst divergence, audit firm, analyst monitoring, earnings quality, profit variability and yield volatility). The results show that risk information taken as a whole is not related to the accuracy of analyst earnings forecasts.
In addition to the above analysis, this study examines the relationship between verifiable disclosed risk information and earnings forecast accuracy (analyst earnings forecast error). Thus, based on the literature review, the structure of the present study is two-fold. Firstly, disclosed risk information was divided into three components; risk factors, management of (verifiable) risks, and quantitative information on the impact of (non verifiable) risks. The relationship of each of the above components to earnings forecast accuracy was then analysed. When risk information was taken as a whole, no statistically significant relationship was detected between any of these three components and analysts’ profit forecast accuracy. Secondly, published risk information was divided into two categories; verified and unverified. Analysis of the relationship between each of these components and fore-cast accuracy confirms that there is no statistically significant relationship.
The rest of the paper is structured as follows: section two reviews the existing literature and proposes the hypotheses for testing. The third section presents the methodology used to test the hypotheses, describes the sample and presents the data. The results of the empirical study are shown in section four. The paper ends with a presentation of the main conclusions from the study.
2. Theoretical framework and hypotheses
Scholars have paid particular attention to studying the factors that influence earnings forecast accuracy. It has been shown that firm size (Lang & Lundholm, 1996), analyst monitoring of the firm (Lang & Lundholm, 1996; Bozzolan, Trombetta, & Beretta, 2009; Ding, Luo, Hao, & Zhang, 2017), changes in earnings (Duru & Reeb, 2002), yield volatility (Jaggi & Jain, 1998; Duru & Reeb, 2002), international diversification (Duru & Reeb, 2002) and the quality of accounting information (Lang & Lundholm, 1996; Barron, Kile, & O'Keefe, 1999; Hope, 2003; Horton, Serafeim, & Serafeim, 2013; Glaum, Baetge, Grothe, & Oberdörster, 2013) are important factors with an impact on the accuracy of analyst earnings forecasts.
Analysts point to the quality of financial statements as an important factor when assessing the usefulness of this information (Healy, Hutton, & Palepu, 1999). Thus, high-quality accounting information enables analysts to make more realistic forecasts with smaller deviations between their forecasts and actual events, as Lang and Lundholm (1996) and Glaum et al. (2013) have shown. Lang and Lundholm (1996) report that an increase in information quality (they use Financial Analysts Federation ratings for US firms as a measure of quality), increases analyst earnings forecast accuracy. Hope (2003) reaches similar conclusions for a sample of firms from 22 countries. Other works have analysed the effect of International Accounting Standards (IFRS) on earnings forecast accuracy (Glaum et al., 2013; Garrido & Sanabria, 2014; Horton et al., 2013; Ashbaugh & Pincus, 2001; Hodgdon, Tondkar, Harless, & Adhikari, 2008; Tan, Wang, & Welker, 2011; Byard, Li, & Yu, 2011).
Although accounting researchers have focused on the impact of certain accounting information on improving analyst earnings forecasts (Vanstraelen, Zarzeski, & Robb, 2003; 2003; Bozzolan et al., 2009; Bernardi & Stark, 2018; Kou & Hussain, 2007) there are no papers analysing the influence of firms’ disclosure of risk information on the accuracy of analyst earnings forecasts, with the exception of recent work by Lin and Lin (2017).
Authors such as Solomon et al. (2000) and Cabedo and Tirado (2004) have emphasised the usefulness of this information for user decision making. Consequently, a series of theoretical (Jorgensen & Kirschenheiter, 2003; Heinle & Smith, 2015; Heinle & Smith, 2017) and empirical works (Rajgopal, 1999; Linsmeier, Thornton, Venkatachalam, & Welker, 2002; Jorion, 2002; Moumen, Othman, & Hussainey, 2015; Campbell et al., 2014; Kravet & Muslu, 2013; Miihkinen, 2013; Zreik & Louhichi, 2017; Cabedo & Tirado-Beltrán, 2014; Filzen, 2015; Hope et al., 2016) have studied the impact of risk information on capital markets. These studies show that risk information disclosure influences share prices (Campbell et al., 2014; Filzen, 2015; Hope et al., 2016), affects investors’ perception of risk (Campbell et al., 2014; Kravet & Muslu, 2013), helps to reduce information asymmetry (Campbell et al., 2014; Kravet & Muslu, 2013; Miihkinen, 2013) and affects the cost of capital (Jorgensen & Kirschenheiter, 2003; Heinle & Smith, 2017).
The results reported in empirical works show that investors take into account the disclosure of larger amounts of risk information and adjust their expectations (Campbell et al., 2014; Filzen, 2015; Hope et al., 2016). This implies that risk information disclosure has an impact on investors’ estimation of future cash flows and profits when evaluating firms’ shares. In this vein, if analyst earnings forecasts are taken as a proxy for these expectations as Fried and Givoly (1982) point out, it seems reasonable to think that if risk in-formation has significant informative content, it will help to reduce uncertainty over cash flows or future earnings and will therefore redound to more accurate forecasts. Lin and Lin (2017) study how the requirements of Financial Reporting Release No. 48 (FRR No. 48) regarding the format firms can choose to disclose information on their exposure to market risk (tabular, sensitivity analysis and value at risk VaR) affect the accuracy of analyst profit forecasts. Lin and Lin (2017) show that prediction errors are smaller in firms that use VaR and the tabular format than in firms that use sensitivity analysis. These results show that information on exposure to market risks has an informative content for analysts because it enables them to make more accurate profit forecasts. In contrast, the study by Abraham et al. (2012) analysing financial analysts’ perception of the risk information divulged by firms in the UK, shows that one group of the analysts interviewed consider that risk information is useful, whereas according to another group the information is irrelevant due to it being too general and repetitive. Sarens and D’Onza (2017) reached similar conclusions in their study of analyst perceptions of information disclosed on risk, its management and internal control in Belgium and Italy.
One may consider risk information as forward-looking information. Aljifri and Hussainey (2007, p.883) note that “forward-looking disclosure also involves non-financial information such as risks and uncertainties that could significantly affect actual results and cause them to differ from projected results”. In this vein, several studies have discussed the usefulness of forward-looking information for financial analysts: Bozzolan et al., (2009), Beretta and Bozzolan, (2008) and Vanstraelen et al., (2003) show that the greater the amount of forward-looking information provided by firms, the higher the accuracy in analysts’ profit forecasts. In view of the above arguments, the following hypothesis was formulated:
Hypothesis 1: firm risk information disclosure is related to the accuracy of analyst earnings forecasts.
In addition, Crawford and Sobel (1982) point out that, on balance, information that cannot be verified has no informative content and therefore users do not value it. In this regard, Dobler (2008) notes that risk information includes aspects which are verifiable (on matters such as risk factors and their management) and therefore credible. That is, analysts can take them into account (Hutton, Miller, & Skinner, 2003; Bozzolan et al., 2009). Other elements, like those concerning disclosure of the impact of the risk, are not verifiable and so, a priori, they may or may not be credible. The informative content of this type of data depends on the degree of credibility (Ng, Tuna, & Verdi, 2013; Mercer, 2004; Rogers & Stocken, 2005). Therefore:
3. Methodology
3.1. Models
The hypotheses presented in the above section were tested with the following models.
 (1)
(1)
 (2)
(2)
 (3)
(3)
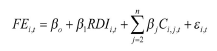
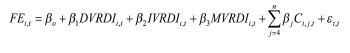
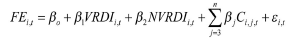
where FE i,t is analyst earnings forecast error per share for firm i and year t; RDI i, t is the risk disclosure index of firm i in year t; DVRDI it is the disclosure index that collects information on the different risk factors for firm i in year t; IVRDI it is the index that collects information on the impact of various risks for firm i in year t; MVRDI it is the index that collects information on the management of the different risks for firm i in year t; VRDI i,t is the verified risk disclosure index for firm i in year t; NVRDI i,t is the non-verified risk disclosure index for firm i in year t; C,i,j,t are the control variables, ϐ represents the parameters of the model to be estimated and ε are the residuals.
The first model (1) tests hypothesis 1, which studies the relationship between risk information disclosure in financial statements and the degree of analyst forecast accuracy. Models (2) and (3) test hypothesis 2, which analyses the relationship between verifiable and verified risk information with analyst earnings forecast accuracy per share.
We ran a regression analysis with panel data for the models’ estimation. As a first step, we computed Haussman’s test to determine whether a fixed effects model or a random effects model was best suited for the data we were working with. Then, in the case of the latter, we estimated the parameters through the Generalized Method of Moments (GMM). Otherwise, when a fixed effects model was more appropriate, we estimated the parameters through the "within estimator" or "within transformation". This returned a vector that contained the values in deviation from the individual means. When the required hypotheses were fulfilled, we were able to estimate the model by using ordinary least squares by using these transformed variables.
3.2. Dependent variable
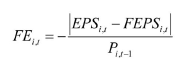
The present study uses earnings forecast error per share (FE) as the dependent variable to be estimated in the three models. Following Lang and Lundholm (1996), we measured earnings forecast error per share (FE) as the negative absolute value of the difference between profits per share for firm i in year t (EPS i,t ) and the median of analyst profit forecasts per share for firm i in year t (FEPS i,t ), all divided by the price of a share in firm i at the start of year t-1 (P i,t-1 ) (4):
 (4)
(4)
This magnitude is a measure of analyst forecast accuracy. Firms with higher FE values will have a better forecast. Values closer to zero imply fewer forecast errors.
3.3. Independent variables
The proposed models incorporate information on firm risk disclosure as independent variables.
3.3.1. Disclosure of Risk information (RDI)
The degree of risk information disclosure (RDI) was measured using the index from Cabedo and Tirado (2009). These authors propose an index based on informative con-tent rather than on the amount of disclosed key phrases and/or words, as an indicator of the degree of risk information disclosure. They argue that by measuring the degree using (for example) the number of phrases, the assumption is that a firm that discloses two phrases regarding a certain risk is providing twice the information compared to a firm that only uses one phrase for the same risk. In fact, the two firms may be informing on the same content, although one expresses the information with a “longer narrative”. Based on that argument, the authors propose an alternative way of measuring the amount of published risk information based on disclosure indexes constructed from a series of stages or levels1.
The risk disclosure index proposed by Cabedo and Tirado (2009) is built from the following equation (5):
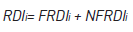 (5)
(5)
Where RD Ii is the risk information disclosure index for firm i; FRDI i is the financial risk information disclosure index for firm i; and NFRDI i is the non-financial risk information disclosure index for firm i.
The financial (FRDI) and non-financial risk disclosure indexes (NFRDI) are calculated according to equations (6) and (7) respectively:
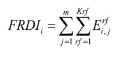 (6)
(6)
where rf is the type of financial risk; is the value of stage j of financial risk E rf i,j for firm i; E rf i,j will take a value of 1 if firm i is at that stage and 0 if it is not; m is the number of stages.
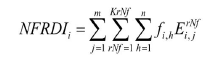 (7)
(7)
where rNf is the type of non financial risk; E rf i,j is the value of stage j of the non-financial risk rNf for firm i; E rf i,j will take a value of 1 if firm i is at this stage and zero if it is not; and f i,h represents the risk factors in the case where a category of non-financial risk presents information on more than one risk factor; f i,h will take value 1 for each n factor in each non-financial risk.
The following five stages have been used to build the above indices:
Stage 1: the firm only mentions the risks it is exposed to.
Stage 2: the firm describes the risk and how it is affected.
Stage 3: the firm informs on quantitative measurement of the impact of the risk
Stage 4: the firm informs on risk management.
Stage 5: the firm informs on the type of instruments used to mitigate the risk.
Risk information has been classified with the business risk model proposed by Arthur Andersen and used by ICAEW (1997) to provide a framework for business risk disclosure. Authors such as Linsely and Shrives (2006) and Kajuter (2001) have used this model to analyse the degree of risk disclosure in the UK and Germany respectively. Table A1 in the appendix presents the classification used for the types of risks.
The components of this Risk Disclosure Index (RDIi) have been used to calculate the indices for the verifiable and non-verifiable components of risk information and the verified and unverified components in that information.
In the case of verified and unverified components, for model (3) a verified risk disclosure index (VRDI) and a non-verified risk disclosure index (NVRDI) was calculated as follows:
VRDI should be calculated by taking risk information from annual accounts verified by an audit company. In this case, listed Spanish firms must present their consolidated financial statements in accordance with International Accounting Standards (IAS). In this regard, the International Financial Reporting Standard (IFRS No. 7) regulates the disclosure of information in financial statements on financial instruments, the associated risks and policies for managing those risks. Thus, risk information that undergoes a verification process stems from financial risks. Therefore, verified risk information (VRDI) has been measured through the above-mentioned financial risk disclosure index (FRDI). VRDI has been assimilated within FRDI.
As regards unverified information, in the case of Spain, Article 262 of the Capital Companies Law (Ley Sociedades de Capital, 2010) establishes the obligation to disclose, in the management report, information on the main risks and uncertainties facing the firm. In addition, the regulations indicate that the management report must include information on the objectives and policies for financial risk management, including the policy used to cover those risks and inform on exposure to price risk, credit risk, liquidity risk and cash flow risk. Thus, the management report does not neglect the need to inform on non-financial risks but managers are left free to inform on the aspects they consider noteworthy. Although the information on financial instrument risks is subject to a verification process (external audit) on the non-financial risk information disclosed in the management report, there is no obligation to verify that information as there is for the annual accounts. The regulations establish that the content of the management report must be in keeping with the annual accounts, but there is no requirement to provide verification. For that reason, the information on non-financial risks has been considered non-verified risk information. Thus the non-financial risk disclosure index (NFRDI) has been taken as a measure of non-verified risk disclosure information). NVRDI and NFRDI have been assimilated.
Finally for model (2) verifiable and non-verifiable information were distinguished by constructing an index for each of the aspects indicated by Dobler (2008):
The index that measures verifiable aspects concerning information on the main risk factors (DVRDIi) was calculated according to equation (8):
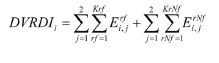 (8)
(8)
where the variables have the meaning defined in expressions (6) and (7). Specifically, subindex j refers to the stage. That is E rf i,j , and E rNf i,j will take a value of 1 if firm i is at stage 1 or 2, and zero if it is not.
For the aspect regarding management policies and hedging instruments (verifiable) the index MVRDIi is built in accordance with equation (9).
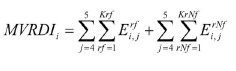 (9)
(9)
The significance of the variables is the same as before. Therefore, E rf i,j , and E rNf i,j will take a value of 1 if firm i is at stage 4 or 5 and zero if it is not.
And for the third aspect, measurement of the impact of (non-verifiable) risk, index IVRDIi was built according to equation (10).
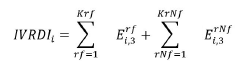 (10)
(10)
E rf i,j , and E rNf i,j they will take a value of 1 if firm i is at stage 3 and zero if it is not.
As a first step to devise these indices, a coding of the risk information disclosed by firms in their notes to the financial statements and their management reports has been con-ducted. The information has been coded according to the kind of risk (see annex) and the aforementioned stage.
Two technicians coded the information for three months. Then, 10% of the coded documents (notes to the financial statements and management reports of 35 companies) were randomly chosen. This sample was analysed by a researcher to assess the consistency between the coding performed by both technicians. Cohen’s Kappa coefficient was calculated with this aim. The value of this coefficient, 0.96, fits the ‘very good consistency’ tranche proposed by Landis and Koch (1977).
3.3.2. Control variables
The control variables in the models are based on prior research. The following control variables have been used to control for the impact of factors other than that of risk information:
Size: Measured by the logarithm of market capitalisation for company i in year t. Previous studies have found a negative relationship between size and forecast error, which indicates that analysts achieve greater accuracy with major companies (Lang & Lundholm, 1996; Brown, 1997; Garrido & Sanabria, 2014; Glaum et al., 2013).
Analysts: Measured by the logarithm of the number of analysts monitoring the firm. Studies by Duru and Reeb (2002), Basu, Hwang, and Jan (1998) show a negative relationship between the number of analysts who are monitoring the firm and analysts’ earnings forecast errors. These results are consistent with the theory that firms more closely monitored by analysts require greater analysis, which then generates better forecasts.
Yield volatility (DesvROA): Kross, Ro, and Schroeder (1990). Kross et al. (1990) and Jaggi and Jain (1998) conclude that profit volatility is associated with greater analyst profit forecast errors. Volatility has been measured using standard deviation of the yield on assets in the last 5 years.
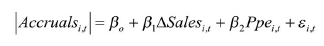
Earnings quality: Adjustments for abnormal accruals taken in absolute values are used to measure earnings quality. The higher the absolute value of adjustments for accrual, the lower the quality of the earnings. We have used the Jones (1991) model to measure accounting discretionality. The residuals of the regression of Jones’ (1991) expectations model, as suggested by DeFond and Jiambalvo (1994) are expressed as follows (11):
 (11)
(11)
where Accruals it , represents adjustments for total expected accruals for year t, calculated directly as the difference between the operating result and the operating cash flows divided by total assets in t-1; ΔSales i,t is the annual variation in net turnover divided by total assets in t-1 and Ppe i,t is the amount of tangible fixed assets divided by total assets in t-1.
This is to say that the expected amount of accrual adjustments depends both on change in incomes and levels of tangible fixed assets. The residual of the model (Quality) represents an abnormal component of accruals which is used as a proxy for accounting discretionality. The larger this component, the lower the quality of the earnings. A positive relationship is expected between the degree of accrual adjustment and analyst forecast errors, according to studies by Ahmed, Nainar and Zhou (2005) and Wu and Wilson (2016).
Leverage (Lev): Measured as the ratio of total liabilities to total assets. Glaum et al. (2013), Chang, Hooi, and Wee (2014) and Bozzolan et al. (2009) postulate a negative relationship between the degree of firm leverage and the accuracy of analyst earnings forecasts. That is, the greater the degree of leverage in firms the greater the forecast error.
Big4: Behn, Choi, and Kang (2008) show a positive rela-tionship between the fact that the company is audited by one of the major audit companies (Big4) and analyst earnings forecast accuracy. Audit quality is introduced in the model as a dummy variable, Big4, which takes the value 1 if the firm is audited by an audit company from one the four major audit companies, and zero otherwise.
Earnings variability (VarEPS): Duru and Reeb (2002) and Hope (2003) show that analyst forecast accuracy is related to the magnitude of changes in earnings. Wide variations in earnings hinder analyst profit forecasts. For the Spanish case, Larran and Rees (1999) conclude that sectors with the greatest changes in earnings have the greatest forecast errors. Changes in earnings have been measured as the variation in the annual earnings growth divided by the price of shares at the start of the period.
Loss: Prior research indicates that analysts have diffi-culties making earnings forecasts when firms make a loss. Abarbanell and Lehavy (2002) show that forecast errors are greater in firms with losses. Hope (2003) also concludes that there is a negative, but not significant relationship. Therefore, it is expected there will be a negative relationship between the variable that represents loss and analyst forecast error. Loss is included in the model as a dichotomous variable that takes the value 1 when the firm made a loss in the previous year and zero otherwise.
Analyst deviation (DivAnalysts): Bamber, Barron, and Stober (1997) indicate that analyst dispersion is a proxy for uncertainty. A higher degree of uncertainty suggests greater difficulty with profit forecasting and therefore a higher likelihood of error (Hutton, Lee, & Shu, 2012). In this regard, Lang and Lundholm (1996) show a negative relationship with analyst forecast accuracy. In this study, the variable has been measured as the standard deviation of analyst forecasts of profit per share in the I/B/E/S forecast database.
3.4. Sample
As shown, the objective of the present study is to analyse the influence of risk information disclosed by firms in their financial statements on the accuracy of financial analysts’ earnings forecasts. To test the hypotheses derived from this objective, we used a sample comprised of non-financial firms listed on the Madrid Stock Exchange (Spain) from 2010 to 2015, for which analyst profit forecasts per share are available on the Thomson One database. The initial sample included 468 observations. However, 117 observations with no available data on some control variables were removed. Therefore, the final sample contained 351 observations. Table 1 shows a breakdown of the number of firms in the sample per year.
Table 1 Sample companies per year
| 2015 | 2014 | 2013 | 2012 | 2011 | 2010 | Total | |
|---|---|---|---|---|---|---|---|
| Initial sample | 75 | 75 | 75 | 81 | 81 | 81 | 468 |
| Eliminated | 117 | ||||||
| Total | 351 |
Source: own elaboration.
The risk information was obtained from consolidated financial statements (annual and management reports) published on the website of Spain's National Securities Exchange Commission (CNMV). Analyst earnings forecasts were obtained from I/B/E/S (Institutional Brokers Estimation System) and earnings per share and control variables from Worldscope Database.
4. Empirical results
4.1. Descriptive statistic
Table 2 shows the main descriptive statistics for the set of variables used in the analysis. As the table shows, the mean of the risk disclosure index (RDI) is 24.46, and the mean of the verified risk information index (VRDI) is 17.24, whereas the mean of the risk index that collects nonverified information (NVRDI) is only 7.22. These data show that firms offer greater levels of verified information on risks than non-verified information, as was expected given that verified risk information is compulsory, whereas non-verified risk information is voluntary. The mean of analyst forecast errors (FE) in absolute values is 13% of the share price. However, it should be noted that 75% of the observations show forecast errors below 8% with a median of 2%.
Table 2 Descriptive statistics
| Min. | Max. | Mean | Percentiles | |||
|---|---|---|---|---|---|---|
| 25 | 50 | 75 | ||||
| FE | -3.3 | 0 | -0.13 | -0.08 | -0.02 | -0.01 |
| RDI | 9 | 80 | 24.46 | 17 | 21 | 29 |
| IVRDI | 0 | 6 | 1.71 | 1 | 2 | 2 |
| DVRDI | 5 | 69 | 15.3 | 10 | 12 | 18 |
| MVRDI | 0 | 21 | 7.80 | 5 | 7 | 10 |
| VRDI | 6 | 32 | 17.24 | 15 | 17 | 20 |
| NVRDI | 0 | 48 | 7.22 | 0 | 4 | 11 |
| Size | 9.62 | 18.21 | 13.86 | 12.44 | 14.09 | 15.02 |
| Analysts | 0.69 | 3.76 | 2.45 | 1.95 | 2.56 | 3.09 |
Source: own elaboration.
With respect to verifiable information, the mean of the disclosure index that collects information on the different risk factors (DVRDI) and of the index on management information for the various risks (MVRDI) are 15.3 and 7.8 respectively. Companies offer on average a greater level of information on the risk factors they are exposed to than on the management policies and hedging tools the company uses to mitigate them. As regards non-verifiable information, the mean of the disclosure index on the impact of the different risks of the company is 1.7. Note that only 25% of the observations present information with a greater impact on both types of risks.
Table 3 presents Pearson correlations between the independent variables used in the regressions. The correlations between the independent variables are low for the three models. Therefore, there is no sign of multicollinearity problems since, except for the relationship between ‘Analysts’ and ‘Size’, none of the correlation coefficients for independent variables of the three estimated models is higher than 0.8 (Gujarati, 2003). We have included ‘Analysts’ and ‘Size’ within the models because both are key variables to consider when analysing the impact of information disclosure on the accuracy of financial analysts’ earnings forecasts (Duru & Reeb, 2002 and Bozzolan et al., 2009).
Table 3 Pearson correlation matrix
| Variables | RDI | Lev | Size | Analysts | Quality | VarEPS | DesvROA | DivAnalysts | IVRDI | DVRDI | MVRDI | VRDI | NVRDI |
|---|---|---|---|---|---|---|---|---|---|---|---|---|---|
| RDI | 1 | ||||||||||||
| Lev | 0.069 | 1 | |||||||||||
| Size | 0.275*** | -0.143*** | 1 | ||||||||||
| Analysts | 0.159*** | -0.099* | 0.828*** | 1 | |||||||||
| Quality | -0.087* | 0.108** | -0.056 | -0.011 | 1 | ||||||||
| VarEPS | -0.014 | 0.288*** | -0.179*** | -0.148*** | 0.199*** | 1 | |||||||
| DesvROA | -0.097* | 0.024 | -0.322*** | -0.240*** | 0.169*** | 0.345*** | 1 | ||||||
| DivAnalysts | 0.130** | 0.345*** | -0.239*** | -0.214*** | 0.180*** | 0.235*** | 0.023 | 1 | |||||
| IVRDI | 0.320*** | -0.033 | 0.160*** | 0.151*** | -0.059 | -0.090* | -0.005 | 0.102* | 1 | ||||
| DVRDI | 0.939*** | 0.079 | 0.224*** | 0.096* | -0.062 | 0.059 | -0.018 | 0.136** | 0.197*** | 1 | |||
| MVRDI | 0.687*** | 0.031 | 0.255*** | 0.199*** | -0.095* | -0.142*** | -0.230*** | 0.024 | 0.171*** | 0.424*** | 1 | ||
| VRDI | 0.632*** | 0.128** | 0.230*** | 0.201*** | -0.070 | -0.010 | -0.121** | 0.157*** | 0.386*** | 0.483*** | 0.629*** | 1 | |
| NVRDI | 0.940*** | 0.028 | 0.235*** | 0.106** | -0.076 | -0.012 | -0.065 | 0.090* | 0.220*** | 0.932*** | 0.561*** | 0.333*** | 1 |
*** p-value < 0.01; ** p-value < 0.05; * p-value < 0.10
Source: own elaboration.
4.2. The effect of risk information disclosure on the accuracy of analyst earnings forecasts.
Table 4 shows the results of estimating the model for equation (1) used to test the first hypothesis posited in the study. When estimating the model through OLS, we detected no residual autocorrelation (we performed the Durbin- Watson test). Nevertheless, the results of White’s test indicate that there is heteroskedasticity in the residuals of the models. Therefore, we have estimated the model using the Generalised Least Squares technique. The number of observations used, as indicated, is 351 with a multiple R2 of 0.7148. The model tests the relationship between earnings forecast error (FE) with the degree of risk information disclosure, measured using the risk disclosure index (RDI). The coefficient for the RDI variable is negative but not significant. This indicates that the risk information firms disclose is not related to the degree of analyst earnings forecast accuracy. These findings are in line with studies by Abraham et al. (2012) and Sarens and D’Onza (2017). The sign of the coefficients for the control variables is consistent with previous studies. The coefficients of the variables Lev, Quality, VarEPS, Loss and DivAnalysts are statistically significant and negative. This finding shows that a greater level of leverage (Lev), a higher level of accrual adjustments (Quality) -which means lower quality in the results-, greater variation in profits (VarEPS), the existence of negative results (Loss) and a greater divergence between analyst expectations (DivAnalysts) are related to lower fore-cast accuracy. In addition, Size is the only significant variable positively related to forecast accuracy.
Table 4 Estimation of the model 1
| Variable | Coefficient | p-value |
|---|---|---|
| RDI | 0.000 | 0.558 |
| Big4 | 0.118 | 0.325 |
| Lev | -0.005 | 0.000*** |
| Size | 0.091 | 0.000*** |
| Analysts | -0.004 | 0.916 |
| Quality | -0.447 | 0.068* |
| VarEPS | -0.211 | 0.000*** |
| DesvROA | 0.026 | 0.000*** |
| Loss | -0.153 | 0.000*** |
| DivAnalysts | -0.461 | 0.000*** |
| Multiple R-Squared | 0.714 | |
| Obs. | 351 | |
| Chi-sq (Haussman) test | 70.41 | 0.000*** |
*** p-value < 0.01; ** p-value < 0.05; * p-value < 0.10
Source: own elaboration.
4.3. The effect of disclosing verifiable and verified risk infor-mation on the accuracy of analysts’ earnings forecasts.
As in model 1, in models 2 and 3 we detected no residual autocorrelation (we performed the Durbin-Watson test) but we found heteroskedasticity problems (White’s test) in the residuals of the models estimated through OLS. Therefore, we have also estimated these models using the Generalised Least Squares technique for panel data.
The model used to test the informative content of the three components (aspects) of the information in relation to their verifiability has been collected in equation (2).
The results of estimating this model (2) are shown in Table 5. As can be seen from the table, none of the coefficients for the factors into which the risk information disclosed by firms is broken down are statistically significant. That is, whether the information is verifiable or not does not influence forecast accuracy. For that reason, it cannot be concluded that verifiable information helps to reduce analysts’ uncertainty in relation to the prediction of future cash flows to be generated by the firm. In this way, in relation to verifiable information, the second hypothesis is rejected.
Table 5 Estimation of models (2) and (3)
| Model (2) | Model (3) | |||
|---|---|---|---|---|
| Variable | Coefficient | p-value | Coefficient | p-value |
| IVRDI | -0.004 | 0.813 | ||
| DVRDI | -0.000 | 0.829 | ||
| MVRDI | 0.002 | 0.632 | ||
| VRDI | -0.002 | 0.707 | ||
| NVRDI | 0.001 | 0.492 | ||
| Big4 | 0.118 | 0.326 | 0.108 | 0.376 |
| Lev | -0.005 | 0.000*** | -0.005 | 0.009*** |
| Size | 0.090 | 0.000*** | 0.093 | 0.000*** |
| Analysts | -0.005 | 0.888 | -0.004 | 0.919 |
| Quality | -0.447 | 0.063* | -0.462 | 0.061* |
| VarEPS | -0.211 | 0.000*** | -0.209 | 0.000*** |
| DesvROA | 0.026 | 0.000*** | 0.026 | 0.000*** |
| Loss | -0.153 | 0.000*** | -0.151 | 0.000*** |
| DivAnalysts | -0.460 | 0.000*** | -0.460 | 0.000*** |
| Multiple R-Squared | 0.714 | 0.716 | ||
| Obs. | 351 | 351 | ||
| Chi-sq | 71.501 | 0.000*** | 75.67 | 0.000*** |
| (Haussman) test |
*** p-value < 0.01; ** p-value < 0.05; * p-value < 0.10
Source: own elaboration.
As regards the control variables, both the sign and the statistical significance level are similar to those obtained with estimation of the model (1). Thus, the interpretation of the coefficients for the variables estimated with model (1) is directly transferable to those of model (2).
Finally, regarding the distinction between verified and non-verified risk information, Table 5 also reflects the result of the estimated model (3). According to this table, neither the variable corresponding to verified risk information (VRDI) nor the one corresponding to the non-verified risk information coefficient (NVRI) are statistically significant. With these results, hypothesis 2 must be rejected.
With respect to the control variables, identical considerations can be made as for model (2).
5. Conclusions
This paper has analysed the relationship between firm risk information disclosure and the accuracy of financial analysts’ profit forecasts. Taking as the population non-financial firms listed on the Spanish Stock Exchange, for which this type of information (forecasts) is registered, two hypotheses have been tested: first, risk information, taken as a whole, is related to analysts’ forecast accuracy. Second, verified or verifiable information is related to that accuracy.
With data from 2010 to 2015, after estimating three models, which include the control variables considered relevant in the literature, the conclusion is that the first hypothesis must be rejected. That is, greater forecast accuracy cannot be associated with greater disclosure of risk information. And as regards the second hypothesis, the part concerning verifiable information must also be rejected: no statistically significant relationship has been detected between the amount of verifiable risk information published, and analysts’ forecast accuracy. The test with verified information provides the same result.
In short, it cannot be concluded that the risk information firms disclose helps analysts to reduce their levels of uncertainty and thus make more accurate forecasts of future profits. Obviously, as in all empirical studies like this one, the results must be understood to be conditioned to the study population and time period.

