


 Inglês (pdf)
 Artigo em XML
 Referências do artigo
 Enviar este artigo por email
 Citado por SciELO
  Citado por Google
  Similares em
SciELO
Similares em
SciELO  Similares em Google
 Permalink
1. Introduction
The outbreak of the novel coronavirus disease (COVID-19), which originated in the Chinese city of Wuhan in late 2019, was harmful in ways and scopes not seen in generations. The pandemic demonstrated to be extremely detrimental to the social well-being and economic conditions of the population of a considerable number of countries. In the first months of 2020, over three million people around the globe suffered from the disease, and more than two hundred thousand died from complications derived from it. Also, over one billion people worldwide were confined in their homes because of the pandemic. Those factors, along with the rapid spread of the COVID-19, considerably increased economic uncertainty affecting the foreign exchange and crude oil markets, as well as other financial markets.
As contagions rapidly spread around the globe during the first quarter of 2020, a disruption in supply chains emerged because of global business shutdowns. The pandemic also reduced demand for many goods and services due to the confinement measures adopted by many countries. While oil prices had gradually declined as a reaction to such economic events, on March 9, and despite the expected decrease in demand in the forth coming months, Saudi Arabia announced a substantial increase in its crude production, which plunged oil prices. The West Texas Intermediate (WTI), one of the main three oil pricing benchmarks, dropped by 25% on that date1.
Empirical studies on the co-movements of exchange rates and oil prices have reported mixed evidence (Ding & Vo, 2012; Kim & Jung, 2018; Thenmozhi & Srinivasan, 2016; Wu, Chung, & Chang, 2012). This research paper contributes to the literature on this subject by examining the dynamics of the COVID-19 variables and currency exchange rates of five emerging countries while controlling for oil price changes.
Turhan, Hacihasanoglu and Soytas (2013) assert that examining the relationship between oil prices and the exchange rates of emerging market economies is relevant because of two reasons. First, such economies have been increasingly important in terms of their contribution to global gross domestic product (GDP), particularly after the Global Financial Crisis (GFC) of 2008-2009. However, since economic growth and energy prices are closely linked, the economic progress of emerging countries is susceptible to the movements in oil prices. Second, since the financial systems of emerging countries are not sufficiently deep, their economies are exposed to changes in international capital flows. Capital flow movements, in turn, are related to oil prices through changing resource allocation decisions of investors in oil-producing countries.
The objective of this research is to examine the relationship of the COVID-19 pandemic, as well as the considerable downward shift of oil prices during the first quarter of 2020 and the dynamics of the exchange rates of three oil-producing countries: Brazil, Mexico, and Russia; and two oil-consuming nations: Colombia and South Africa. Aside from being emerging economies, another common trait for these five countries is that their currencies depreciated an average of 21% during that period. The research hypothesis is that there is a relationship between the movements of the variables associated with the spot prices of the WTI crude oil, the COVID-19, and the currency exchange rates of such emerging countries relative to the U.S. dollar (USD).
The study applied the autoregressive distributed lag (ARDL) modeling and bounds testing framework proposed by Pesaran, Shin and Smith (2001) to attain its goal. This method is appropriate for I(1) variables only as other cointegration testing procedures. However, one of the key features of ARDL modeling is that it is capable of including I(0) and I(1) series in the same ordinary least squares (OLS) regression (Menegaki, 2019; Shestha & Chowdury, 2005).
The following structure applies to the remainder of the research paper: section 2 briefly reviews the relevant literature, section 3 describes the data and explains the methodology used in the research, section 4 presents the empirical results, and section 5 discusses the results and concludes the paper.
2. Literature review
From the theoretical perspective, both direct and indirect transmission channels describe the relationship between exchange rates and oil prices (Gómez, Hirs, & Uribe, 2020). The international portfolio allocation model and the wealth approach proposed by Krugman (1983) and Golub (1983), respectively, are two frameworks focused on the direct transmission channel. The international portfolio allocation model asserts that in the long-run, real exchange rate equilibrium no longer depends on the portfolio choices of oil-producing countries but is contingent on the geographic distribution of their imports. The wealth approach focuses on the short-run and maintains that an increase in oil prices leads to oil-importing countries’ currencies to depreciate as a result of the higher expenditures they incur to obtain such a commodity. In contrast, oil price upturns contribute to oil-exporting nations increasing income and improving their current account balances, which causes the appreciation of their currencies.
The literature has reported mixed results regarding the exchange rate and crude oil price relationship in oil-importing and oil-exporting countries. For oil-producing economies, Korhonen and Juurikkala (2009) found that oil price increases relate to the appreciation of the real exchange rates of the Organization of the Petroleum Exporting Countries (OPEC) members. Mensah, Obi and Bokpin (2017) considered the long-run dynamics between bilateral U.S. dollar exchange rates and oil prices for several oil-dependent economies before and after the GFC. Their analysis identified the existence of a long-run equilibrium relationship between oil prices and exchange rates, particularly for the key oil-producing countries.
García, Saucedo and Velasco (2018) considered the case of Mexico, an oil-exporting economy, to examine the relationship of that country’s spot and future exchange rates to the U.S. dollar and oil prices between 1991 and 2017 by applying vector autoregressive (VAR) specifications. The authors concluded that an increase in the oil spot price was associated with an appreciation of the Mexican peso to the U.S. dollar and vice versa. However, they also found that future oil prices were not significant for the Mexican peso - U.S. dollar exchange rate. Similarly, the results of the ARDL modeling and bounds testing approach applied by Singhal, Choudhary, & Biswal (2019) showed that in the long run, oil prices negatively impact the exchange rate of the Mexican peso to the U.S. dollar. Zalduendo (2006) applied vector error correction (VEC) specifications to examine the impact of oil prices on the exchange rate of Venezuela, another oil-exporting country. The author found that oil prices were a significant element in shaping the time-varying equilibrium of the real exchange rate of the Venezuelan Bolivar to the U.S. dollar between 1950 and 2004.
As for oil-importing countries, Thenmozhi and Srinivasan (2016) applied the wavelet coherence (WTC) framework to examine the co-movement of oil prices, exchange rates, and stock indices for fifteen major oil-consuming countries. Their results indicate that with only two exceptions- Japan and South Korea - the nominal exchange rates of the remaining countries showed a negative relationship with oil prices. Chen and Chen (2007) found that crude oil price increases could have been the main cause of real exchange rates changes in oil-consuming countries of the G7.
Other empirical studies have focused on specific oil-importing countries. Ghosh (2011) used generalized autoregressive conditional heteroskedasticity (GARCH) and exponential GARCH (EGARCH) specifications and found that an increase in the price of oil was related to the depreciation of the Indian rupee. Likewise, the results of the GARCH specifications used by Fowowe (2014) reveal that oil price increases are related to declines of the South African rand exchange rate relative to the U.S. dollar.
Other researchers have examined the relationship between oil prices and exchange rates in oil-importing and oil-exporting countries simultaneously. Ahmad and Moran (2013) studied such a relationship in twelve major oil-producing and oil-consuming economies in the long-run. Their findings evidenced cointegration in five of such countries2, as well as in the Eurozone. The authors also concluded that Brazil, Nigeria, and the United Kingdom were subject to less severe adjustments after negative shocks than after positive events. The results reported by Lizardo and Mollick (2010) are highly consistent with the theoretical exchange rate - oil price relationship for oil-importing and oil-exporting countries they examined. The authors concluded that the upturns of real oil prices cause exchange rate depreciation of oil-importing countries’ currencies relative to the U.S. dollar. Conversely, the U.S. dollar depreciates against the currencies of oil exporters when the real oil price rises.
Yang, Cai and Hamori (2017) used the WTC analysis to study the relationship between crude oil prices and exchange rates of eight major oil-importing and oil-exporting countries from 1999 to 2014. They concluded that the co-movement between exchange rates and crude oil prices varies over time. That study also found a heterogeneous but strong linkage between those variables from 2005 to 2014 for oil-exporting countries, as well as for all countries around the year 2008. According to the authors, the latter finding suggests the existence of financial contagion between the foreign exchange and oil markets. Similarly, Živkov, Njegić and Balaban (2019) employed the WTC framework to examine the co-movement between Brent oil prices and the exchange rate in ten emerging economies. That study found a significant simultaneous decline in oil prices and a depreciation of currency exchange rates during the GFC in most of the oil-importing countries and all the oil-exporting countries.
By applying VAR and generalized impulse response analyses, Turhan et al. (2013) examined the relationship between oil prices and the exchange rates of oil-importing and oil-exporting emerging countries from 2003 to mid-2010. The authors concluded that an increase in oil prices leads to a significant appreciation of such countries’ currencies to the U.S. dollar.
As the COVID-19 pandemic is a novel and ongoing situation, the literature regarding its impact on economic variables is scarce. Corsetti and Marin (2020) stress that, as in the case of other global crises, the novel coronavirus pandemic has triggered substantial foreign exchange movements. However, they argue that in the current COVID-19 episode, the dynamics of foreign exchange have been remarkably faster. At the same time, the quantity of capital outflows from emerging economies has been considerably higher as compared to those of previous crises.
Albulescu (2020a) examined the influence of COVID-19 data on the prices of the WTI crude oil while controlling for the effect of the Economic Policy Uncertainty (EPU) index for the United States and the Cboe Volatility Index® (VIX®). The results of the ARDL estimation used in that study suggest that the pandemic-related variables indirectly influenced the pattern of crude oil prices in early 2020 through the increase of financial market volatility. Nevertheless, that study also found that the long-run impact of the number of new daily infections of COVID-19 on crude oil prices was negative but negligible. In a related research paper, Albulescu (2020b) also studied the effect of the COVID-19 and oil price changes on the EPU index by applying ARDL modeling. The author found that the number of global new infection cases and the death ratio had no significant effect on the EPU index. However, the number of new infection cases and the death ratio were directly related to the dynamics of the EPU when setting aside the data corresponding to China.
3. Methodology
In the first quarter of 2020, the Brazilian real (BRL), Colombian peso (COP), Mexican peso (MXN), Russian ruble (RUB), and South African rand (ZAR) exchange rates to the U.S. dollar sharply depreciated (Grenier, 2020; Lei &Villamil, 2020; Mathew, 2020). Figure 1 depicts the depreciation of such currencies between January 13 and April 6, 2020. Brazil, Mexico, and Russia are oil-exporting countries, while Colombia and South Africa are considered oil-importing economies.
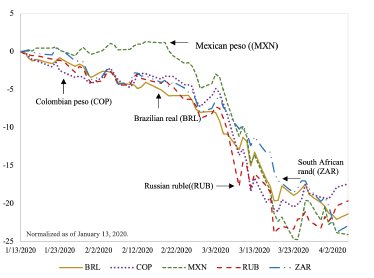
Source: own elaboration.
Figure 1 Depreciation of selected currencies (normalized as of January 13, 2020)
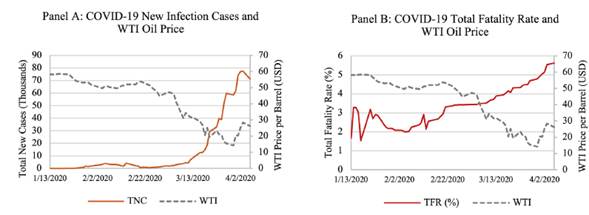
As evidenced by panel A of Figure 2, from mid-January to early April 2020, the total new cases of COVID-19 and the price of the WTI oil exhibited opposite patterns. International health authorities reported the first COVID-19 case outside China on January 13. From that date on, the number of new infections rapidly increased across the world, and at the same time, WTI prices declined. However, oil prices plunged on March 9, when Saudi Arabia announced a sizable increase in its oil production after failing to reach an agreement with Russia intended to stabilize the prices of that commodity (Halff, 2020). Throughout the first week of March, the number of new infection cases of the novel coronavirus climbed, and, as shown in Panel B of Figure 2, the total fatality rate displayed an upward inflection point also around the same week.
The data related to the COVID-19 pandemic were obtained from the online database published by the European Centre for Disease Prevention and Control (ECDC). More specifically, such data refers to new daily infection cases and the number of deaths related to the novel coronavirus pandemic. The fatality rate in this paper was computed as the cumulative number of deaths divided by the aggregate quantity of cases up to day t. However, the ECDC reports on day t denote the data of day t-1. Thus, bearing in mind that financial markets immediately react to new information, the analyses presented here consider the impact on day t exchange rates of the data related to the COVID-19 pandemic released on day t+1, as suggested in the study carried out by Albulescu (2020b).
The prices of the WTI crude oil come from the U.S. Energy Information Administration. Finally, the foreign exchange rates, expressed in direct quotes from the perspective of each of the five emerging countries, were obtained from the database retrieval system of the University of British Columbia. The period considered was from January 13, 2020 (agreeing with the first reported contagion case outside China) to April 6, 2020, and comprises 59 daily observations3.
Given the relevance of stationarity in time series analysis (Hendry & Juselius, 2000), the first step was to determine whether the series presented a unit root. So, the study applied the Augmented Dickey-Fuller (ADF) test to determine the order of integration of the data4 (Dickey & Fuller, 1979). As Table 1 shows, the series were either I(0) or I(1). More specifically, most of the series were I(1) at the 1% significance level. Nevertheless, the WTI prices and the total fatality rate (TFR) were I(0) at the 10% significance level, while the total new daily cases (TNC) was I(0) at 1% significance. Such inconclusive results endorse the use of ARDL modeling and bounds testing proposed by Pesaran et al. (2001) to examine the co-movement of the series.
Table 1 ADF unit root test results
| BRL | COP | MXN | RUB | ZAR | |
| Levels (I(0)) | -2,087 | 1,573 | -1,629 | -2,019 | -1,202 |
| p-value | 0,54 | 0,97 | 0,77 | 0,58 | 0,90 |
| First difference (I(1)) | -9,590*** | -8,487*** | -7,705*** | -8,769*** | -7,352*** |
| p-value | < 0.01 | < 0.01 | < 0.01 | < 0.01 | < 0.01 |
| WTI | CVD-19TNC | CVD-19RWNC | CVD-19TFR | CVD-19RWFR | |
| Levels (I(0)) | -1,759* | -5,449*** | 0,069 | -3,288* | -1,805 |
| p-value | 0,07 | < 0.01 | 1,00 | 0,08 | 0,69 |
| First difference (I(1)) | -8,402*** | -4,502*** | -12,888*** | -6,655 | |
| p-value | < 0.01 | < 0.01 | < 0.01 | < 0.01 |
Notes: (1) ***, **, and * denote significance levels of 1%, 5%, and 10%, respectively. (2) The lag selection was based on the Schwarz information criterion (SIC).
Source: own elaboration.
Cointegration testing is essential to establish whether a model empirically displays relevant long-run relationships. The absence of significant cointegration among underlying variables implies working with variables in differences exclusively. In this regard, the ARDL approach offers several advantages over other cointegration testing techniques (Hoque, Yakob, & Kruse, 2017). First, contrasting with other cointegration methods, the ARDL procedure can include I(0) and I(1) series in the same OLS regression, although it is also suitable for I(1) variables only. However, for the F-statistics of the test to be valid, the order of integration of the series must not be I(2) or higher (Menegaki, 2019; Shestha & Chowdury, 2005).Second, this method simplifies the analysis of the relationship between the response and input variables through OLS regressions. Third, relative to other approaches, the ARDL method is more efficient for small samples, a characteristic that is particularly relevant for this research.
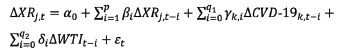
In this study, the primary model used in the ARDL bounds test framework is the following unrestricted error correction model (ECM):
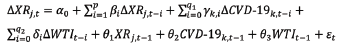 (1)
(1)
In equation (1), α0 is the constant term and XR j stands for the direct quote of the currency exchange rate to the U.S. dollar for country j. CVD-19 k represents each of the four variables related to the novel coronavirus in the corresponding specifications. Such variables are the total new cases reported (TNC), the number of new cases outside China (i.e., the number of the rest of the world new cases, RWNC), the total fatality rate (TFR), and the rest of the world fatality rate (RWFR). WTI is the market price of the West Texas Intermediate crude oil. The short-run coefficients β, γ k, and δ correspond to the exchange rate examined -considering the COVID-19 variable, and the WTI oil price, respectively. The long-run coefficients for these variables are denoted by θ 1, θ 2, and θ 3, correspondingly.
Anytime the bounds tests rejected the null hypothesis of no cointegrating relationship, the study applied the following ECM within the ARDL framework:
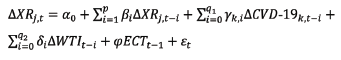 (2)
(2)
In equation (2), ECT t-1 and ε represent the error correction term and the random disturbance, respectively. The speed of adjustment is denoted by φ, which has to be negative and statistically significant to validate the long-term relationship in the model.
However, according to the bounds approach, whenever such a test fails to reject the null hypothesis of no long-run relationship, the correct specification is a short-term ARDL model. In this study, that model is represented by:
 (3)
(3)
The Akaike information criterion (AIC) was the basis to select the optimal number of lags for the ARDL estimations. The analyses also included several tests for the residuals, such as the Ljung-Box Q statistics, to confirm the existence of high-order serial correlation5.
Additionally, the post-estimation a sessments included the autoregressive conditional heteroskedasticity-Lagrange multiplier (ARCH-LM) test to determine the presence of heterosk dasticity in the resid als, as well as the Jarque-Bera test to establish whether such residuals are normally distributed.
4. Results
Table 2 displays the descriptive statistics of the response and input variables. All variables were positively skewed, while the WTI price exhibited negative skewness, as expected. According to the Jarque-Bera test, only the total fatality rate followed a normal probability distribution at the 5% significance level. These results also reveal that between January 13 and April 6, the depreciation rates to the U.S. dollar of the five currencies ranged from 17.4% for the Colombian peso to 24.1% for the Mexican peso. The results also show that the decline of the WTI price was close to 55% in the same period.
Table 2 Descriptive statistics on the nominal exchange rates, WTI, and COVID-19 variables
| Response Variables | Input Variables | |||||||||
|---|---|---|---|---|---|---|---|---|---|---|
| BRL | COP | MXN | RUB | ZAR | WTI | TNC | RWNC | TFR% | RWFR% | |
| Mean | 4,575 | 3.623,528 | 20,539 | 68,503 | 15,763 | 42 | 15.125 | 14.318 | 3,33 | 1,97 |
| Median | 4,390 | 3.440,683 | 19,109 | 65,389 | 15,206 | 50 | 2.818 | 453 | 3,41 | 1,48 |
| Maximum | 5,306 | 4.156,794 | 25,002 | 80,489 | 18,921 | 59 | 77.944 | 77.874 | 5,62 | 5,67 |
| Minimum | 4,134 | 3.282,024 | 18,569 | 61,260 | 14,352 | 14,10 | 0,00 | 0,00 | 1,53 | 0,00 |
| Std. Dev. | 0,380 | 309,317 | 2,322 | 6,729 | 1,309 | 14 | 24.111 | 24.517 | 1,00 | 1,93 |
| Skewness | 0,614 | 0,622 | 0,828 | 0,625 | 0,870 | -0,622 | 1,597 | 1,580 | 0,323 | 0,546 |
| Kurtosis | 1,857 | 1,615 | 1,975 | 1,725 | 2,476 | 1,851 | 4,005 | 3,952 | 2,423 | 1,743 |
| Jarque-Bera | 6,927 | 8,526 | 9,323 | 7,836 | 8,114 | 7,054 | 27,567 | 26,780 | 1,844 | 6,818 |
| Probability | 0,031 | 0,014 | 0,009 | 0,020 | 0,017 | 0,029 | 0,000 | 0,000 | 0,398 | 0,033 |
| 01/13/2020 | 4,134 | 3.283,102 | 18,815 | 61,259 | 14,416 | 58,17 | 1 | 1 | 1,67 | 0,00 |
| 04/06/2020 | 5,258 | 3.974,089 | 24,793 | 76,237 | 18,694 | 26 | 71.232 | 71.165 | 5,62 | 5,67 |
| Change (%) | -21,37 | -17,39 | -24,11 | -19,65 | -22,88 | -54,94 | --- | --- | --- | --- |
Notes: (1) The foreign exchange rate represents units of local currency per U.S. dollar (direct quotes). Accordingly, the computation for the percent change to the U.S. dollar was (initial rate / final rate) - 1. (2) TNC is the total number of cases worldwide, RWNC refers to the total number of cases outside China (rest of the world), TFR% shows the total fatality rate in percent, and RWFR% is the rest of the world fatality rate in percent.
Source: own elaboration.
The results in Table 3 reveal that all models exhibited a long-term relationship between the exchange rates, COVID-19 variables, and WTI oil prices at the 5% significance level. Thus, the next step was estimating the corresponding unrestricted ECM specifications in the ARDL framework for each currency exchange rate to the U.S. dollar, considering the WTI oil prices and each of the COVID-19 variables separately.
Table 3 Exchange rates bounds test results
| BRL | COP | MXN | RUB | ZAR | ||||||
|---|---|---|---|---|---|---|---|---|---|---|
| Dynamic specification | F-statistic | Cointegration? | F-statistic | Cointegration? | F-statistic | Cointegration? | F-statistic | Cointegration? | F-statistic | Cointegration? |
| CVD-19TNC | 5,58 | Yes | 5,61 | Yes | 5,52 | Yes | 5,69 | Yes | 6,13 | Yes |
| CVD-19RWNC | 5,32 | Yes | 5,26 | Yes | 6,13 | Yes | 5,37 | Yes | 6,77 | Yes |
| CVD-19TFR | 5,02 | Yes | 6,37 | Yes | 5,62 | Yes | 6,78 | Yes | 7,74 | Yes |
| CVD-19RWFR | 6,59 | Yes | 6,43 | Yes | 5,97 | Yes | 6,61 | Yes | 6,13 | Yes |
Notes: (1) The critical values at the 5% significance level for the lower bound I(0)) and upper bound (I(1)) are 3.79 and 4.85, respectively, as specified by Pesaran, et al. (2001) in "Table CI(iii) Case III: Unrestricted intercept and no trend" (p. 300). (2) CVD-19TNC is the COVID-19 total new infection cases, CVD-19RWNC represents the new infection cases outside China, CVD-19TFR is the total fatality rate from the disease, and CVD-19RWFR is the fatality rate outside China. (3) All the dynamic specifications included the price of the WTI crude oil.
Source: own elaboration.
Table 4 presents the ARDL model that considers the new cases of COVID-19 worldwide. The outcomes reveal a long-run (i.e., equilibrium) relationship between the daily new infection cases and the exchange rate movements of the Mexican and Russian currencies, although at the 10% significance level only. The total number of new infection cases was significant at the 5% level for the Colombian peso and the South African rand. Nonetheless, in all such instances, the extent of the coefficients was negligible. Additionally, the outcomes in Table 4 show that there was a significantly negative long-run co-movement between the WTI price and the five exchange rates.
Table 4 ARDL results: Exchange rates and COVID-19 total new cases
| Currency (XR) | BRL | COP | MXN | RUB | ZAR |
|---|---|---|---|---|---|
| Long-run equation | |||||
| CVD-19TNC | 0,000 | -0,006** | 0,000* | 0,000* | 0,000** |
| WTI | -0,043*** | -32,184*** | -0,144** | -0,554*** | -0,094*** |
| c | 6,591*** | 5109,546*** | 26,302*** | 92,738*** | 19,923*** |
| Short-run equation | |||||
| ΔXRt-1 | 0,009 | 0,405 | 0,157 | ||
| ΔXRt-2 | 0,270** | 0,392* | 0,261* | ||
| ΔXRt-3 | 0,158 | ||||
| ΔXRt-4 | -0,086 | ||||
| ΔXRt-5 | 0,485** | ||||
| ΔCVD-19TNC | 0,000*** | -0,006** | 0,000** | 0,000* | 0,000*** |
| ΔCVD-19TNC,t-1 | 0,000 | 0,000 | |||
| ΔCVD-19TNC,t-2 | 0,000* | 0,000* | |||
| ΔWTI | -0,006** | -10,029*** | -0,069*** | -0,404*** | -0,018*** |
| ΔWTIt-1 | -0,007* | -8,742*** | -0,006 | -0,216*** | |
| ΔWTIt-2 | 0,016*** | 10,353*** | 0,038* | 0,274*** | |
| ΔWTIt-3 | -0,005 | ||||
| ECTt-1 | -0,254*** | -0,347*** | -0,439** | -0,507*** | -0,192*** |
| Residual tests | |||||
| Autocorrelation (Ljung-Box Q-statistic) | No (0.210) | No (0.596) | No (0.293) | No (0.973) | No (0.959) |
| Heteroskedasticity (ARCH LM F-statistic) | No (0.870) | No (0.173) | No (0.355) | No (0.056)** | No (0.091)** |
| Normally distributed (Jarque-Bera) | Yes (0.587) | Yes (0.919) | Yes (0.788) | Yes (0.807) | Yes (0.537) |
***, **, and * denote significance levels of 1%, 5%, and 10%, respectively.
Source: own elaboration.
In the short-run, the total number of new cases of COVID-19 turned out to be significant at the 5% level for all currencies’ exchange rates, except for the Russian ruble. However, although statistically relevant, the impact of TNC on exchange rates was close to zero. The contemporaneous change in the price of crude oil was significant for the exchange rate movements of the five currencies Furthermore, the lagged two-day coefficients of the WTI price were positive and significant at the 1% level, excluding the Mexican peso, since such a variable was statistically relevant at the 10% level only for that currency exchange rate.
The results exhibited in Table 5 relate to the ARDL specification that includes the daily new cases of COVID-19 outside China. Not surprisingly, the results of this model are qualitatively similar to those in Table 4, since the number of contagion cases in the rest of the world accounted for half the total infected population since February, and that proportion consistently increased from that point onwards.
Table 5 ARDL results: Exchange rates and COVID-19 new cases outside China
| Currency (XR) | BRL | COP | MXN | RUB | ZAR |
|---|---|---|---|---|---|
| Long-run equation | |||||
| CVD-19RWNC | 0,000 | -0,006** | 0,000 | 0,000 | 0,000** |
| WTI | -0,045*** | -32,098*** | -0,127*** | -0,548*** | -0,094*** |
| c | 6,685*** | 5096,377*** | 25,383*** | 92,350*** | 19,923*** |
| Short-run equation | |||||
| ΔXRt-1 | 0,024 | 0,496* | 0,150 | ||
| ΔXRt-2 | 0,283** | 0,453** | 0,261* | ||
| ΔXRt-3 | 0,213 | ||||
| ΔXRt-4 | -0,033 | ||||
| ΔXRt-5 | 0,565** | ||||
| ΔCVD-19 RWNC | 0,000*** | -0,006** | 0,000** | 0,000 | 0,000*** |
| ΔCVD-19RWNC,t-1 | 0,000 | 0,000 | |||
| ΔCVD-19RWNC,t-2 | 0,000** | 0,000* | |||
| ΔWTI | -0,006** | -10,172*** | -0,072*** | -0,407*** | -0,018*** |
| ΔWTIt-1 | -0,008** | -9,124*** | -0,007 | -0,222*** | |
| ΔWTIt-2 | 0,017*** | 10,246*** | 0,036 | 0,267*** | |
| ΔWTIt-3 | -0,006* | ||||
| ECTt-1 | -0,225*** | -0,337*** | -0,516** | -0,492*** | -0,192*** |
| Residual tests | |||||
| Autocorrelation (Ljung-Box Q-statistic) | No (0.330) | No (0.649) | No (0.220) | No (0.977) | No (0.948) |
| Heteroskedasticity (ARCH LM F-statistic) | No (0.837) | No (0.156) | No (0.295) | No (0.058)** | No (0.096)** |
| Normally distributed (Jarque-Bera) | Yes (0.353) | Yes (0.905) | Yes (0.601) | Yes (0.822) | Yes (0.816) |
***, **, and * denote significance levels of 1%, 5%, and 10%, respectively.
Source: own elaboration.
Even so, the findings of the two models present some differences that are worth mentioning. As Table 4 shows, in the long-run, the total number of cases was significant at the 5% level for the Colombian peso and the South African rand and, at the 10% level for the Mexican peso and the Russian ruble. According to the results in Table 5, though, the total number of COVID-19 cases outside China was significant only for the Colombian and South African currency exchange rates. However, the corresponding coefficient values remained negligible in both instances, as in the previous model.
Table 6 displays the results of the ARDL specification concerning the COVID-19 total fatality rate. In the long-run, the total fatality rate coefficient was very significant for the Brazilian real. The TFR coefficient was also statistically relevant and considerable in magnitude for the Russian ruble. Additionally, the negative relationship between the price of the WTI oil and the exchange rates of the five currencies was very significant. The results of the short-run equation reveal that the dynamics of the TFR and the exchange rates to the U.S. dollar were generally unrelated, except for the Russian ruble. The corresponding coefficient for such a currency was substantial and significant at the 5% level. The results of this model reveal a significantly negative short-term relationship between the crude oil price and the exchange rates of the five currencies. Also, as was the case of the previous two models, the lagged two-day coefficients of the WTI crude oil price were positive and significant for the Brazilian real, Colombian peso, and Russian ruble.
Table 6 ARDL results: Exchange rates and COVID-19 total fatality rate
| Currency (XR) | BRL | COP | MXN | RUB | ZAR |
|---|---|---|---|---|---|
| Long-run equation | |||||
| CVD-19TFR | 0,100*** | 20,732 | 0,301 | 0,785** | 0,254 |
| WTI | -0,020*** | -19,711*** | -0,160*** | -0,416*** | -0,090*** |
| c | 5,088*** | 4356,276*** | 26,308*** | 82,971*** | 19,100*** |
| Short-run equation | |||||
| ΔXRt-1 | 0,174 | 0,226 | 0,292** | 0,480** | 0,337* |
| ΔXRt-2 | 0,360** | 0,328** | 0,032 | 0,568*** | -0,130 |
| ΔXRt-3 | 0,309** | 0,325** | 0,199 | 0,302*** | -0,111 |
| ΔXRt-4 | 0,134 | -0,076 | 0,213** | -0,215 | |
| ΔXRt-5 | 0,410*** | 0,315** | 0,113 | 0,075 | |
| ΔXRt-6 | -0,609*** | -0,184* | -0,754*** | ||
| ΔXRt-7 | 0,102 | ||||
| ΔXRt-8 | 0,287** | ||||
| ΔCVD-19TFR | 0,056 | 11,744 | 0,099 | 0,639** | 0,086 |
| ΔWTI | -0,008*** | -14,220*** | -0,081*** | -0,487*** | -0,034*** |
| ΔWTIt-1 | -0,005 | -4,053 | 0,033 | -0,209** | 0,006 |
| ΔWTIt-2 | 0,011*** | 10,161*** | 0,343*** | 0,003 | |
| ΔWTIt-3 | -3,897 | 0,019 | |||
| ECTt-1 | -0,562*** | -0,566*** | -0,329*** | -0,815*** | -0,340** |
| Residual tests | |||||
| Autocorrelation (Ljung-Box Q-statistic) | No (0.693) | No (0.729) | No (0.821) | No (0.597) | No (0.512) |
| Heteroskedasticity (ARCH LM F-statistic) | No (0.594) | No (0.432) | No (0.163) | No (0.137) | No (0.707) |
| Normally distributed (Jarque-Bera) | Yes (0.751) | Yes (0.116) | Yes (0.251) | Yes (0.772) | Yes (0.114) |
***, **, and * denote significance levels of 1%, 5%, and 10%, respectively.
Source: own elaboration.
Table 7 shows the outcomes of the ARDL specification that includes the COVID-19 fatality rate outside China. In this model, the coefficient for the positive long-run relationship between the COVID-19 fatality rate and the Brazilian real remains significant and marginally increases as compared to the TFR model. The magnitude of the RWFR long-run coefficient was considerable and statistically relevant for the South African rand. Nonetheless, the WTI price coefficient was not significant for the South African rand in the long-run.
Table 7 ARDL results: Exchange rates and COVID-19 fatality rate outside China
| Currency (XR) | BRL | COP | MXN | RUB | ZAR |
|---|---|---|---|---|---|
| Long-run equation | |||||
| CVD-19RWFR | 0,110*** | 20,094 | 0,273 | 0,541 | 0,772*** |
| WTI | -0,012*** | -18,322*** | -0,145*** | -0,413*** | 0,001 |
| c | 4,855*** | 4327,553*** | 26,127*** | 84,615*** | 14,541*** |
| Short-run equation | |||||
| ΔXRt-1 | 0,237 | 0,211 | 0,266 | 0,345** | |
| ΔXRt-2 | 0,192 | 0,311** | 0,016 | 0,275* | |
| ΔXRt-3 | 0,290** | 0,307** | 0,180 | 0,227** | |
| ΔXRt-4 | -0,047 | 0,115 | -0,088 | 0,067 | |
| ΔXRt-5 | 0,167 | 0,391*** | 0,301** | 0,048 | |
| ΔXRt-6 | -0,347** | -0,603*** | -0,314*** | ||
| ΔCVD-19 RWFR | 0,067*** | 11,203 | 0,086 | 0,360 | 0,132 |
| ΔCVD-19RWFR,t-1 | 0,413** | ||||
| ΔCVD-19RWFR,t-2 | -0,465*** | ||||
| ΔWTI | -0,008*** | -13,685*** | -0,077*** | -0,475*** | 0,000 |
| ΔWTIt-1 | -0,001 | -4,055 | 0,030 | -0,151* | |
| ΔWTIt-2 | 0,008*** | 10,024*** | 0,204*** | ||
| ΔWTIt-3 | -4,121 | ||||
| ECTt-1 | -0,608*** | -0,558*** | -0,315** | -0,666*** | -0,322*** |
| Residual tests | |||||
| Autocorrelation (Ljung-Box Q-statistic) | No (0.553) | No (0.746) | No (0.795) | No (0.327) | No (0.805) |
| Heteroskedasticity (ARCH LM F-statistic) | No (0.574) | No (0.435) | No (0.156) | No (0.070)** | No (0.082)** |
| Normally distributed (Jarque-Bera) | Yes (0.834) | Yes (0.166) | Yes (0.248) | Yes (0.677) | Yes (0.885) |
***, **, and * denote significance levels of 1%, 5%, and 10%, respectively.
Source: own elaboration.
The results of the short-run equation reveal that the contemporaneous fatality rate outside China was significant for the exchange rate of the Brazilian currency. The one-day and two-day lagged coefficients of that variable were also statistically relevant for the South African rand, although with the opposite sign. The negative and significant relationship of the contemporaneous crude oil price and the exchange rates also appears in the model presented in Table 7, except for the South African currency. Again, the two-day lagged coefficient of the WTI was also significant and positive for the Brazilian real, the Colombian peso, and the Russian ruble in this model.
5. Conclusions
The results of the long-run equations of ARDL specifications used in this study show that, in several instances, there were significant co-movements between the exchange rates and the COVID-19 variables throughout the first quarter of 2020. Such results, though, are to be taken cautiously, given the short-term focus of this study. Moreover, the analyses show that the extent of such a relationship was trifling. However, there were some noteworthy exceptions to this pattern. For example, the outcomes revealed a substantial and significant relationship between the total fatality rate and the exchange rate of the Russian ruble in both the long and short-run.
The TFR was also significantly related to the Brazilian real exchange rate in the short-term. Likewise, the fatality rate outside China was significant and of considerable magnitude for the South African rand and the Brazilian real.
Brazil, Russia, and South Africa share common factors that might describe the similarities in the findings for these countries’ exchange rate movements related to the COVID-19 variables. China, the epicenter of the pandemic during the first quarter of 2020, is the main trade partner of those countries. Moreover, Brazil and South Africa became ground zero for the pandemic in Latin America and Africa, respectively (Davies & Vincent, 2020; Ndopu, 2020; Rapoza, 2020).
The findings also reveal that the co-movements between the exchange rates and the contemporaneous WTI price were significant and negatively related during the first quarter of 2020. Such results were not surprising for the three oil-producing countries considered in the study -Brazil, Mexico, and Russia - since those outcomes agree with the proposals put forward by the wealth approach and the international portfolio allocation model (Golub, 1983; Krugman, 1983). Moreover, these findings also agree with the results reported in previous empirical studies involving oil-exporting economies (García et al., 2018; Korhonen & Juurikkala, 2009; Mensah et al., 2017).
From the theoretical perspective, though, the results of this study are unexpected for Colombia and South Africa and are at odds with the findings reported in the literature for oil-consuming countries (Fowowe, 2014; Ghosh, 2011; Lizardo & Mollick, 2010). Nonetheless, the negative relationship between oil prices and exchange rates might be the result of the contagion in financial markets during crisis episodes, as suggested in the literature (Yang et al., 2017; Živkov et al., 2019).
The analyses also revealed that the two-day lagged coefficient of oil price was statistically significant and positively associated with the exchange rate dynamics. Saha and Chakrabarti (2018) argue that the opposite signs of the contemporaneous and lagged coefficients of oil prices might represent an additional risk factor to investors in foreign exchange markets.
The interaction between oil prices and exchange rates is relevant for policymakers. Movements of foreign exchange rates and energy prices impact companies’ production costs and profitability, as well as the employment growth rate of economies. Moreover, such changes might also involve considerable departures from countries’ macroeconomic goals. It is relevant, thus, broadening the research on exchange rate movements against the background of the COVID-19 pandemic and the oil price crisis that took place in the first quarter of 2020.
Some empirical studies have examined the co-movements of COVID-19 related variables and crude oil prices along with those of the VIX® and EPU indices (Albulescu, 2020a, 2020b). The literature has also linked variables such as the VIX® and EPU indices to the dynamics of exchange rates (Benavides, 2016). So, future research might examine the co-movements of these and other variables and the exchange rates against the background of the worldwide spread of the novel coronavirus disease.

