


 English (pdf)
 Article in xml format
 Article references
 Send this article by e-mail
 Cited by SciELO
  Cited by Google
  Similars in
SciELO
Similars in
SciELO  Similars in Google
 Permalink
1. Introduction
In 2019, the Portuguese financial system comprised 152 credit institutions out of which 62 were banks. The five largest banks in Portugal account for 80-85% of the assets of the whole banking sector. Employment in credit institutions located in Portugal is over 46 000 people (Banco de Portugal, 2020). After some troubled years (2010-2017), the condition of the Portuguese banking sector has improved significantly (Association of Portuguese Banks - APB, 2019). It is evidenced, among others, by:
Increase in Return on Equity (ROE) from (-)0.8% in December 2017 to 5.3% at the end of June 2019, compared to 6.4% for the euro area at that time,
Decrease in Non-Performing-Loans (NPL) share in the portfolio from 17.5% in 2015 to 8.1% at the end of June 2019 (however, it is still 2.5 times the average for the euro area), and decrease in cost of credit risk in the audited period from 1.2% to 0.4%,
Improvement in solvency (increase in Tier 1 ratio from 12.4% at the end of 2015 to 13.9% at the end of June 2019, although it is still below the euro area average),
Improvement in liquidity (decrease in Loan-to-Deposit ratio from 96% in December 2015 to 88% in June 2019).
Meanwhile in 2020, the COVID-19 pandemic put an end to this recovery, it even reached Portugal relatively late compared to other Western European countries. In fact, pandemic-sensitive sectors such as tourism, hospitality, transportation and construction, for which a relatively early lockdown occurred, represent large shares of Portuguese banks portfolios (between 5% and 15% for the largest banks) and as a result of the COVID-19 escalation in Portugal in the second half of March 2020, some industries (bakeries, restaurants) recorded a drop in revenues over 70%, as well as traffic which decreased by 75%.
Then, as a consequence of the pandemic, the Portuguese economy has seen a sharp deterioration in macroeconomic parameters with several implications for the banking sector. Recent forecasts indicate a fall in GDP in 2020 by 3.4% (in February 2020 a rise of 1.7% was forecasted), an increase in unemployment rate up to 8.2% in 2020 (in February 2020, a 6.4% increase was indicated), a growth of the public debt-to-GDP ratio to 124.9% in 2020 (while in February 2020 it was estimated at 114.6%), and a fall in inflation rate as well as recession on the real estate market. Meanwhile, the economic support programme of the government amounts to €12.5 billion, i.e. approx. 6.2% of GDP. This scheme covers inter alia: investments in the national health system, subsidies for households (e.g. temporary suspension of labour contracts), measures focused on tackling the liquidity problems of companies, deferring tax payments and credit lines for companies channelled through the banking system (with lower interest rates, grace periods, and longer maturities) as well as reduction of charges on electronic payments or deferral of loan repayment schemes (Gonçalves, Belo & Pinheiro, 2020). Moreover, during this time, banks also adopted measures to support both families and companies, either on its own initiative or within government programmes. Anyway, the managers of Portuguese banks estimate that the number of increasing write-downs will mean that banks will not make profits in 2020 and 2021, and will become the most affected group of entities by the pandemic (Winterbrun, 2020).
Given these gloomy predictions for Portuguese banks, in general, it is very important to assess the implications for each of them, trying to identify the most vulnerable ones and then help them with special politics. To the authors knowledge, no study has yet been produced to analyse the impact of COVID-19 on the Portuguese banking sector and so this is the main contribution we hope to make with this research; in brief, the main purpose of this paper is to assess the Portuguese banks in terms of their resilience to the consequences of the COVID-19 pandemic, and then addressing the aforementioned research gap.
In order to do so, we employ linear ordering methods in the sequence of previous analyses, as in the case of the assessment of impact of the pandemic on the 13 largest commercial banks in Poland (Korzeb & Niedziółka, 2020). However, the aforementioned study was based on only two linear ordering methods, i.e. TOPSIS method and Hellwig’s approach. Although the linear ordering methods have been used by some authors, e.g. Hellwig (1968), Hwang and Yoon (1981) , Strahl (1978) , Nowak (1977) or Kukuła and Luty (2015) , they focused on specific individual linear ordering methods with limited procedure of double checking the results (which can be performed by the wide use of alternative approaches or by applying multi-method procedure), and those studies were not applied to the banking sector either. Meanwhile, our study is focused inter alia on the impact of the structure of bank industry portfolio on the resistance to COVID-19, since it may be decisive for NPL dynamics. In fact, Ari, Chen and Ratnovski (2020) also emphasised that the way of managing NPL portfolios seems to be crucial to the economic recovery during the COVID-19 crisis and thereafter.
The conclusions of the study presented in this article may be used in supervisory and regulatory policies and may be one of the premises that investors − who engage their funds in the purchase of bank shares − could take into account. Another contribution is related to the sensitivity of banks to the effects of the COVID-19 pandemic being important information for bank managers in the context of risk management process and in positioning banks against the peer competitors. The worked out measures may also be used in the structuring of financial stability indices or in rating methodologies.
The remainder of this article is structured as follows: section 2 reviews the most significant literature; section 3 describes the data and methodology employed in the empirical research; section 4 presents the results obtained; section 5 is dedicated to the discussion of results; whereas section 6 summarises and presents the main conclusions.
2. Literature review
After several months of the pandemic spreading and the unpredictability of its future scale, it is difficult to draw clear conclusions about the impact of COVID-19 on the economy and consumer behaviour. The sources of the present literature review were both publications relating to the impact of the COVID-19 crisis on the real economy and the banking sector. The above approach results from the assumption of strong and two-way links between the real economy and the financial system.
At the outset, it is worth noting that unlike the subprime crisis, COVID-19 found the banking sector in good condition in terms of regulatory capital and liquidity levels. Taking this into account and also the results of analysing the substance of government programmes, it can be concluded that the banking sector could be part of the system designed to absorb the effects of the pandemic crisis (Demirguc-Kunt, Pedraza & Ruiz - Ortega, 2020; Borio, 2020).
Kohlscheen, Mojon and Rees (2020) simulated the spread of the pandemic and the recession caused by it. The authors pointed out that uncoordinated confinement generate the risk of another wave of epidemics, affecting individual economies sequentially. The second challenge is to coordinate, internationally, the efforts of governments to limit the effects of the recession. The authors do not believe that an uncoordinated policy to mitigate the effects of the recession will be effective. The scale of the recession in a given economy depends not only on the fiscal and monetary policy instruments used by the government of that country, but also on the policies pursued by other governments.
As we all know, a pandemic may become a permanent state. This makes necessary to have a plan in case the economy has to be locked down so as not to do so violently and recklessly. The lockdown should be sequential and the whole process is compared to the closure of a nuclear power plant. It is also important to design economic support activities in such a way that they do not trigger moral hazard.
A separate stream of research is dedicated to the prediction of measurable effects of the crisis. Boissay and Rungcharoenkitkul (2020) estimate that the global GDP decline as a result of the COVID-19 pandemic could amount to 4-4.5% approx., with a relatively higher output reduction in the largest economies (particularly in the United States, where a reduction of up to 9% is estimated). De Santis and Van der Veken (2020) assume that financial variables allow for earlier prediction of a recession than macroeconomic variables. These authors refer to the recession in 2008 and to the COVID-19 crisis, where the same financial variables (e.g. the change in the FED reference rate, determined solely by information from the financial markets) indicated a high probability of a sharp fall in GDP and an increase in macroeconomic risk earlier than macroeconomic variables. Leiva-Leon, Perez-Quiros and Rots (2020) proposed the concept of the Global Weakness Index (GWI), which was used to assess the repercussions of the COVID-19 crisis. Based on certain soft indicators on March 2, 2020, the GWI increased significantly and was sharper than it was in the 2008 crisis.
Aldasoro, Fender, Hardy and Tarashev (2020) indicate that the COVID-19 crisis is relatively milder for well capitalised and highly profitable banks. Schmieder, Sobrun, Takáts and Lewrick (2020) remark that banks have reached the COVID-19 crisis with excess of own funds over the Pillar 1 requirement. The above mentioned authors estimate that in the negative scenario, this surplus creates space for granting new financing, crucial for the recovery process, at the level of USD 5 billion approx. Meanwhile, Borio and Restoy (2020) indicate that recommendations to banks on the use of capital and liquidity buffers should be accompanied by restrictions on the payment of dividends and bonuses and guidelines on how to rebuild those buffers. The authors also recommend that the flexibility in the rules for the classification of receivables should be accompanied by greater transparency with regard to the creditworthiness assessment criteria adopted. Referring to their findings, a hypothesis was formulated: the level of regulatory capital is important in terms of bank resilience to pandemic crisis (Hypothesis 1).
It is also necessary to adopt detailed guidance on the application of expected loss provisioning rules. Svoronos and Vrbaski (2020) examined the banks dividend policy during the pandemic and the extent of the restrictions that were imposed by supervisors in this respect. These authors concluded that capital conservation buffer is a necessary complement to the effective relaxation of capital requirements. At the same time, when examining different jurisdictions (including the United States, China, Japan, Russia, India, the euro area, and the United Kingdom), authors considered that COVID-19s related clear guidelines on dividends, buyback and bonuses were not implemented everywhere; moreover, no new specific guidelines have been formulated in some jurisdictions. On the other hand, the solutions used differ significantly in terms of their restrictive nature and the scope and type of solutions, so it is difficult to compare them.
Zamil (2020) recalled that supervisory authorities and the Basel Committee on Banking Supervision (BCBS) introduced a number of guidelines on how to treat different types of support schemes for borrowers, the allocation of provisions and regulatory capital. These guidelines were implemented to encourage banks to support the economy. In Zamil's view, supervisory initiatives aimed at capital relief and the flexibility of accounting standards should be accompanied by a more restrictive approach to permitted dividend payments, buybacks and bonus payments. Dooseman, Marchat and Guillard (2020) examined the impact of COVID-19 on banks reporting and pointed out the need to update the parameters determining the amount of expected loss, which affects the amount of write-offs.
As mentioned by Korzeb and Niedziółka (2020), in addition to credit risk, the most important risk factors for banks in the era of the pandemic could be relaxation of the internal control environment, cyberterrorism and liquidity risk. In April 2020, the Basel Committee on Banking Supervision published a list of guidelines for estimating expected losses and reporting changes in the economic and financial situation of bank debtors (Bank of International Settlements - BIS, 2020). In the same line, Veron (2020) states that it would not be advisable to fully liberalise the rules on risk write-downs, as well as to completely suspend supervisory activities or obligations to maintain certain quantifiable and qualitative standards.
Compared to the 2008 crisis, banks now have higher capital, the crisis did not occur during the credit boom, and forward-looking IFRS, 9 accounting standards can support NPL recognition. These factors should help address the NPL problem but, in turn, the high public debt, the low profitability of banks and the deteriorating standing of companies are factors negatively affecting the management of NPL portfolios. The aforementioned studies show that the management of the NPL portfolio after the COVID-19 crisis is likely to be different from previous banking crises.
In fact, Hardy and Takáts (2020), having examined the banking sector at the aggregate level rather than on the basis of individual bank financials, show that the issue of banking sector capitalization also proved to be decisive for the financing capacity of the real economy as the ability to expand lending is closely related to the resilience of a bank. They also noticed that the most affected banks by the crisis are focusing on restructuring their portfolios and that the existing, as well as projected consumption of capital buffers, significantly limit their ability to make new loans. So, we assume that in case of the COVID-19 pandemic the NPL level is predominantly affected by the portfolio structure of the bank and therefore the bank sector structure is an important determinant of the resistance of banks to the crisis (Hypothesis 2).
It may turn out that many of the debtors that will be in the NPL portfolio after COVID-19 are viable and solvent but their main problem will be liquidity. Designing effective NPL resolution policies for the post- COVID-19 NPL exposures is one of the most important financial policy issues for European banks. Ari, Chen and Ratnovski (2020) revealed factors affecting high and persistent NPL in some European countries. These authors compared NPL dynamics in Greece, Ireland, Italy, Portugal, Spain, Hungary and Slovenia with what could have been forecasted based on historical patterns.
Baudino (2020) undertook an analysis of government guarantee schemes that would increase the lending activity of banks during the pandemic, especially for small and medium-sized enterprises. The design of such programmes requires a certain balance to be struck between immediate support for businesses during a pandemic and an appropriate level of caution. The structuring elements in this case are: profile of the beneficiary, degree of coverage by the guarantees, spectrum of products covered by the guarantees, and duration of the scheme. A certain constraint on the expected effectiveness of the programme may be the complex operational procedure as well as reporting and fiscal capacity limits.
The impact of the COVID-19 crisis on the banking sector is not limited to the factor related to the industry structure of the portfolio. The macroeconomic situation of the country in which bank operations are carried out is also important. In this context, the results of the research carried out by Oravský, Tóth and Bánociová (2020), which determined the impact of the COVID-19 crisis on GDP, public debt, deficit, tax collection, interest rates, and consumer confidence index are valuable. The study covered selected European countries and the vital conclusion refers to the consumer confidence index since it fell sharply in the group of countries slightly affected by the crisis, i.e. Switzerland and Finland.
It is important to note that Banks portfolios are composed not only of credit exposures but also by financial instruments. Therefore, the volatility of security prices on the financial markets is another determinant of banks performance during the pandemic. Zhang, Hu and Ji (2020) mapped general patterns of country-specific risks and systemic risks in the global financial markets. The mentioned authors also examined the potential consequence of policy interventions like introduction of zero-percent interest rates and unlimited quantitative easing in the context of further uncertainties on global financial markets.
Donthu and Gustafsson (2020) analysed the impact of COVID-19 on 13 industries in terms of changes in consumer behaviour and businesses, ethical issues, and aspects related to employees and leadership. The research on the effects of spreading crises on the banking sector does not start with the COVID-19 pandemic. Studies of this type were carried out much earlier, on Spanish flu of 1918, Asian flu, Hong Kong flu, SARS-CoV, A/H1N1, MERS-CoV, and Ebola. For example, Barro, Ursua and Weng (2020) used data describing 1918-1920 Great Influenza Pandemic. 100 years ago the flu resulted in mortality accounting for 2.1% of world population, implying 150 million deaths due to COVID-19 if applied to the current population. This may contribute to the reduction of GDP and consumption by 6-8%. The authors proved also statistically significant negative correlation between flu death rates and real returns on financial markets. However, it is important to note that it was not until COVID-19 that the perception of the impact of global pandemics on the functioning of modern economies and banking sectors changed. Coronavirus has radically changed the economic and social environment, the conditions of functioning of non-financial enterprises, households and financial sector institutions.
3. Methodology
The research was conducted on a sample of 19 banks operating in the Portuguese banking sector (Table 1). The survey covered all banks that published information about credit quality of exposures by industry or counterparty type (CR1-B) in their annual reports for 2019. The aggregated total assets of the banks studied represents 92.98% of the banking sector assets in Portugal as of December 12, 2019. The financial information and values of the bank ratios were obtained from the BankScope database and annual reports of the banks.
Table 1 List of commercial banks analysed in the study
| Name of the Bank (Alphabetical order) |
| Banco ActivoBank, S.A. |
| Banco Comercial Portugues, S.A. |
| Banco Credibom, S.A. |
| Banco CTT, S.A. |
| Banco EuroBic, S.A. |
| Banco Finantia, S.A. |
| Banco Invest, S.A. |
| Banco Português de Investimento (BPI), S.A. |
| Banco Primus, S.A. |
| Banco Privado ATLANTICO - Europa, S.A. |
| Banco Santander Consumer Portugal, S.A. |
| Banco Santander Totta, S.A. |
| BEST - Banco Electrónico de Serviço Total, S.A. |
| Caixa - Banco de Investimento, S.A. |
| Caixa Central de Crédito Agrícola Mútuo, C.R.L. |
| Caixa Economica Montepio Geral, Caixa Economica Bancaria, S.A. |
| Caixa Geral de Depósitos, S.A. |
| Novo Banco, S.A. |
| Novo Banco dos Açores, S.A. |
Notes: The list is presented in alphabetical order. A different order was applied in the analysis.
Source: own elaboration.
The analysis was performed by using linear ordering methods based on a synthetic variable, which are included in Multiple-Criteria Decision Making (MCDM) techniques. Two pattern methods of variable aggregation − Hellwig (1968) and TOPSIS (Hwang & Yoon, 1981) − are based on determining the distance of individual objects from a defined model object. The other four techniques (Strahl, 1978, Nowak, 1977, Kukuła & Luty, 2015) are non-pattern ones. They consist in the operation of averaging the values of normalized variables. The designs of all aforementioned methods are presented in Table 2.
Table 2 Chosen linear ordering methods
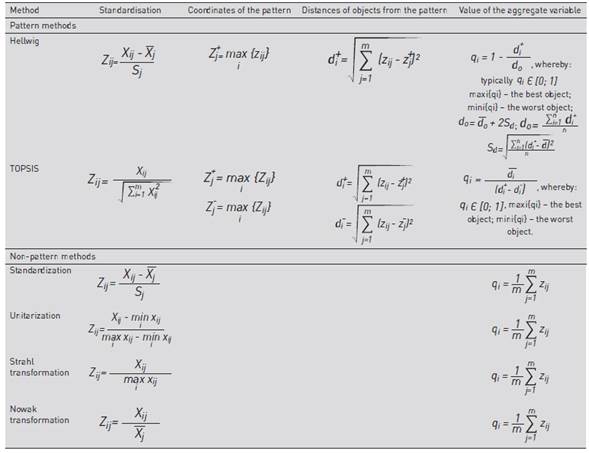
Where: xij - observation of the j-th variable for the object i, - arithmetic mean of observations of the j-th variable, Sj - standard deviation of observations of j-th variable.
Source: own elaboration.
The following diagnostic features were adopted for the analysis (Table 3): capital adequacy (Tier 1), liquidity (LCR), profitability (ROAE), cost to income ratio (C/I), the share of impaired exposures to date (NPL), the resilience of the credit portfolio of the bank to the risk resulting from its exposure to the most risky sectors in the context of the COVID-19 pandemic (RES), and credit rating calculated on the basis of long term credit rating held or implied by Moody's (RAT).
Table 3 Selected characteristics of adopted diagnostic variables
| Symbol | Selected diagnostic variables | Description | Variable profile | |
|---|---|---|---|---|
| Z1 | Tier1 | Capital adequacy | Tier 1 Capital | S |
| Z2 | LCR | ST Liquidity | Ratio of HQLA to net outflows within 30 days under extreme conditions | S |
| Z3 | ROAE | Profitability | Return on average equity | S |
| Z4 | C/I | Cost management | Cost to Income Ratio | D |
| Z5 | NPL | Credit portfolio quality | Impaired assets/Total interest bearing assets - NPL | D |
| Z6 | RES | Resilience of credit portfolio to the COVID-19 crisis | Variable determined by banks' portfolios sector risk profile in the context of the COVID - 19 crisis according to: Option 1 - Sector’s risk estimation, Option 2 - rates of return of sectors in IQ 2020 (based on quotations of shares listed on the Portuguese Stock Exchange) | Option 1 - D Option 2 - S |
| Z7 | RAT | External rating | Calculated on the basis of the long term credit rating held or implied by Moody's. In the absence of a bank rating, a country rating was used. Individual ratings were assigned values, assuming that the lowest value (1) corresponds to Aaa, the highest one (19) is assigned to the worst rating. | D |
Source: own elaboration.
The choice of diagnostic features was guided by substantive analysis taking into account the importance of the indicator in assessing the resilience of Portuguese banks to the crisis situation and statistical analysis, i.e. appropriate level of volatility. Then these indicators were divided into stimulants and deterrents of the studied phenomenon. The values of numerical diagnostic characteristics are shown in Table 4.
Table 4 The basic characteristics of selected diagnostic variables
| Specification | Z1 | Z2 | Z3 | Z4 | Z5 | Z6 Option 1 | Z6 Option 2 | Z7 |
|---|---|---|---|---|---|---|---|---|
| Max | 78.170 | 606.000 | 20.521 | 113.491 | 14.003 | 10.700 | 0.721 | 14.000 |
| Min | 10.900 | 100.000 | -35.650 | 32.314 | 0.130 | 7.198 | 0.533 | 5.000 |
| Arithmetic mean | 20.513 | 215.799 | 5.747 | 61.105 | 4.595 | 9.624 | 0.580 | 9.632 |
| Median | 15.200 | 166.000 | 8.260 | 59.630 | 3.500 | 9.957 | 0.562 | 10.000 |
| Standard deviation | 15.893 | 136.402 | 11.411 | 18.368 | 3.581 | 1.184 | 0.054 | 2.241 |
| V(x) variability coeff. | 0.775 | 0.632 | 1.986 | 0.301 | 0.779 | 0.123 | 0.093 | 0.233 |
Source: own elaboration.
This study classifies industries according to their vulnerability to the negative effects of the COVID-19 pandemic. The risk level of the industry is described in diagnostic feature N° 6 (RES). Based on the sector structures of the bank portfolios the level of vulnerability and sensitivity of banks to the effects of the COVID-19 crisis was determined. The sector risk was estimated with the use of 2 variants: estimating the expected decrease in sales revenue in each section for 2020 and determining the return on shares of all companies listed on the Portuguese Stock Exchange in the first quarter of 2020, and then calculating the median for each sector. The first variant (Option 1) is based on the calculation of the potential decline in sales of a given industry in 2020, which in turn is derived from the lockdown schedule and subsequent de-freezing of the economy (Table 5), as well as the assumed period of companies recovery resulting in reaching pre-pandemic levels of sales and profitability. Changes in social behaviour that result in permanent weakening or strengthening of specific industries were also considered.
Table 5 Calendar of COVID-19 in Portugal
| Key dates: | Action |
|---|---|
| 02.03.2020 | First recorded case of COVID-19 in Portugal |
| 18.03.2020 | Declaration of a 15-day state of emergency and freezing of the economy |
| 02.04.2020 | Extension by Parliament of the state of emergency (closure of airports, restrictions on movement of the population, increased border control) |
| 30.04.2020 | Announcement of the economy’s de-freeze plan |
| 02.05.2020 | Cancellation of the state of emergency |
| 04.05.2020 | Phase I of the de-freeze of the economy (opening of small shops, hairdressers, public transport) |
| 18.05.2020 | Phase II of the de-freeze of the economy (partial opening of nurseries, crèches and schools; opening of restaurants, medium-sized shops, obligation to use masks) |
| 01.06.2020 | Phase III of the de-freeze of the economy (opening of shopping malls, cinemas, theatres and hotels) |
Source: own elaboration.
The assumptions adopted for the expert method described above were based on data in the form of communications from listed companies representing particular sectors, analyses of banks, rating agencies and advisory entities, positions and recommendations of the European Commission, representatives of banks, Portuguese government, chambers of commerce, as well as data on the number of vehicles registered, card transactions and data from the real estate market. The impact of changes in macroeconomic parameters and the share of export and import in sales revenues and operating costs of particular industries, respectively, were also considered (Instituto Nacional de Estatística - INE, 2019).
As in Korzeb and Niedziółka (2020) , the measure of risk of a specific sector was determined as a weighted average decile of the share of export in sales, import in operating costs and the expected decrease in sales revenues in 2020. The sectors were then ranked according to their risk and assigned the following designations: low risk (1st quartile), moderate risk (median), significant risk (3rd quartile), and high risk (last quartile) (Table 6).
Table 6 Risk measures of individual sections of the economy in the context of COVID-19 impact
| Section | Risk measure | Risk level | |
| A | Agriculture, forestry, fishing | 4.50 | Moderate |
| B | Mining | 8.10 | High |
| C | Industrial manufacturing | 5.80 | Moderate |
| D | Electricity, gas, steam and hot water supply | 1.90 | Low |
| E | Water supply; sewerage, waste management; remediation | 3.40 | Low |
| F | Construction | 4.20 | Moderate |
| G | Trade and repair of motor vehicles | 7.70 | Significant |
| H | Transport and storage | 7.60 | Significant |
| I | Accommodation and catering | 7.80 | High |
| J | Information and communication | 3.60 | Low |
| K | Financial and insurance activities | 3.80 | Moderate |
| L | Real estate management | 5.80 | Moderate |
| M | Professional, scientific and technical activities | 5.60 | Moderate |
| N | Administration and support activities | 6.50 | Significant |
| O | Public administration and defence, obligatory social security | 1.00 | Low |
| P | Education | 7.80 | High |
| Q | Health and social care | 1.50 | Low |
| R | Culture, entertainment and recreation | 7.70 | Significant |
| S | Other service activities | 9.70 | High |
Source: own elaboration
The risk values obtained for the sectors were then related to the bank exposure to a given industry and the structure of the credit portfolio at the end of the year. The RES variable (Option 1) is therefore a weighted average of exposures to individual sectors (weights corresponding to sector risk) divided by the total interest-bearing portfolio value (assets).
In case of the second variant (Option 2) rates of return on shares of all companies listed on the Portuguese Stock Exchange in the first quarter of 2020 were determined and then medians were calculated for each sector. Due to the intention not to take into account low liquidity shares, the research did not include companies whose number of quotations in the analysed period was lower than half of all quotations. The values obtained in this way were used as indicators of potential loss resulting from the existing credit exposure of the bank, then they were multiplied by the value of on-balance sheet and off-balance sheet exposures to individual sectors in bank credit portfolios as of December 12, 2019 (or December 12, 2018 if 2019 figures were not available). The result obtained for each bank was then applied to the balance of the credit portfolio at the end of the year, and then the potential for impairment of the portfolio in % was calculated. Linear ordering methods require definitions of quantitative weights for the attributes (Ma, Fan, & Huang, 1999; Choo & Wedley, 1985; Schoemaker & Waid, 1982). In the study, the weights were adopted on the basis of subjective methods: i) w1 system - the same weights were adopted for all variables; ii) w2 system - the weights were determined on the basis of an expert method. The highest weights were given to 3 diagnostic features: capital adequacy, liquidity, and resistance of credit portfolio (Table 7).
Table 7 Values of weighting indicators
| Weights | Z1 | Z2 | Z3 | Z4 | Z5 | Z6 | Z7 |
| w1 | 0.143 | 0.143 | 0.143 | 0.143 | 0.143 | 0.143 | 0.143 |
| w2 | 0.200 | 0.200 | 0.100 | 0.100 | 0.100 | 0.200 | 0.100 |
Source: own elaboration.
Thus, objective methods derived from statistical procedures, such as those based on the variability or correlation of indicators, which are quite often used when defining weights in this type of research (Korzeb & Niedziółka, 2020) were abandoned. Moreover, statistical approaches pertain to information about the characteristics inherent only in the data matrix itself; additionally, in particular an analysis of the variability of characteristics and an analysis of correlation between characteristics are implemented. Its specificity is the mechanical treatment of the problem of weighing, abstracted from the actual position of a given feature determined by the factual premises.
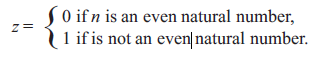
It was then verified which of the rankings drawn up according to six different methods is the most similar to the others. To achieve the above mentioned objective the Kukuła and Luty (2015, 2018) method was used. As the result of comparisons, the measure of similarity of rankings m pq will be used:
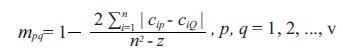 (1)
(1)
Where:
c ip - position of the i-th object in the ranking with the number p,
c iq - position of the i-th object in the ranking with the number q,
In order to determine the degree of similarity of the ranking obtained as a result of the application of the p-th linear ordering method to the other rankings, the sum of the elements p of row (or column) of the symmetric matrix M of dimensions (v × v) was calculated, where v is the number of rankings reduced by 1. Then the result was averaged as follows:
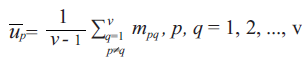 (2)
(2)
There the method for which up = max up p - - was chosen.
Additionally, in case of TOPSIS method, the sensitivity of the model was analysed due to its limitations in terms of weighting criteria. For this purpose, the method proposed by Moghassema and Fallahpour (2011) was used, which is based on decreasing and increasing all the weights of the criteria (5%, 10%, 15%, 20%) and repeating TOPSIS approach with new values:
 (3)
(3)
And there Spearman’s and Kendall’s correlation were estimated between initial ranking and rankings newly created in this way.
4. Results
In order to assess the resilience of commercial banks operating in the Portuguese banking sector to the potential impact of the COVID-19 pandemic, the rankings of banks were determined using six linear ordering methods taking into account two weighting procedures: i) w1 - as equal weights, ii) w2 - the expert method, and two variants of the diagnostic feature Z6: version 1 with risk estimation of individual sectors of the economy, and version 2 based on the rates of return of individual sectors of the economy in IQ 2020 on the Portuguese Stock Exchange.
In this way, 24 rankings were obtained, which we-re used to build the final classification of banks (Table 8 and Table 9). The arithmetic mean of the grades obtained is presented in Figure 1 and Figure 2.
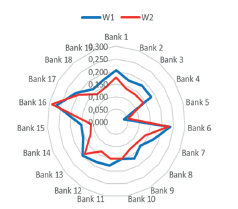
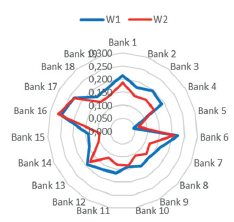
Table 8 Rankings of banks obtained in the first version
| Ranking | Hellwig | TOPSIS | Standardisation | |||||||||
| W1 | W2 | W1 | W2 | W1 | W2 | |||||||
| Scores | Rank | Scores | Rank | Scores | Rank | Scores | Rank | Scores | Rank | Scores | Rank | |
| Bank 1 | 0.395 | 2 | 0.346 | 5 | 0.594 | 5 | 0.460 | 5 | -0.033 | 14 | -0.033 | 13 |
| Bank 2 | 0.292 | 8 | 0.235 | 8 | 0.548 | 9 | 0.401 | 9 | -0.036 | 15 | -0.036 | 14 |
| Bank 3 | 0.311 | 7 | 0.226 | 9 | 0.585 | 6 | 0.422 | 7 | -0.055 | 18 | -0.065 | 18 |
| Bank 4 | 0.317 | 6 | 0.246 | 7 | 0.576 | 7 | 0.418 | 8 | -0.050 | 16 | -0.056 | 17 |
| Bank 5 | -0.014 | 19 | 0.112 | 19 | 0.268 | 19 | 0.214 | 19 | -0.088 | 19 | -0.090 | 19 |
| Bank 6 | 0.381 | 3 | 0.340 | 3 | 0.663 | 2 | 0.574 | 2 | 0.044 | 3 | 0.089 | 2 |
| Bank 7 | 0.191 | 12 | 0.128 | 13 | 0.542 | 13 | 0.391 | 13 | 0.019 | 8 | 0.015 | 5 |
| Bank 8 | 0.085 | 18 | 0.146 | 12 | 0.431 | 18 | 0.320 | 18 | 0.036 | 5 | 0.004 | 8 |
| Bank 9 | 0.186 | 13 | 0.107 | 15 | 0.545 | 10 | 0.388 | 15 | -0.005 | 10 | -0.007 | 11 |
| Bank 10 | 0.116 | 16 | 0.183 | 10 | 0.488 | 17 | 0.394 | 12 | 0.044 | 4 | 0.051 | 3 |
| Bank 11 | 0.110 | 17 | 0.115 | 14 | 0.517 | 16 | 0.397 | 11 | 0.064 | 2 | 0.049 | 4 |
| Bank 12 | 0.197 | 10 | 0.103 | 16 | 0.602 | 4 | 0.435 | 6 | -0.007 | 11 | -0.010 | 12 |
| Bank 13 | 0.343 | 4 | 0.324 | 4 | 0.611 | 3 | 0.509 | 3 | -0.012 | 12 | 0.012 | 7 |
| Bank 14 | 0.132 | 15 | 0.089 | 18 | 0.530 | 14 | 0.377 | 17 | 0.014 | 9 | 0.006 | 9 |
| Bank 15 | 0.196 | 11 | 0.095 | 17 | 0.544 | 11 | 0.385 | 16 | -0.053 | 17 | -0.044 | 15 |
| Bank 16 | 0.430 | 1 | 0.450 | 1 | 0.720 | 1 | 0.714 | 1 | 0.090 | 1 | 0.140 | 1 |
| Bank 17 | 0.333 | 5 | 0.371 | 2 | 0.565 | 8 | 0.477 | 4 | 0.027 | 6 | 0.014 | 6 |
| Bank 18 | 0.237 | 9 | 0.250 | 6 | 0.525 | 15 | 0.389 | 14 | -0.022 | 13 | -0.045 | 16 |
| Bank 19 | 0.182 | 14 | 0.185 | 11 | 0.543 | 12 | 0.398 | 10 | 0.023 | 7 | 0.005 | 10 |
| Ranking | Unitarisation | Strahl | Nowak | |||||||||
| W1 | W2 | W1 | W2 | W1 | W2 | |||||||
| Scores | Rank | Scores | Rank | Scores | Rank | Scores | Rank | Scores | Rank | Scores | Rank | |
| Bank 1 | 0.055 | 13 | 0.053 | 13 | 0.069 | 9 | 0.071 | 7 | 0.155 | 8 | 0.156 | 5 |
| Bank 2 | 0.051 | 15 | 0.048 | 15 | 0.061 | 17 | 0.063 | 14 | 0.124 | 16 | 0.124 | 17 |
| Bank 3 | 0.045 | 18 | 0.039 | 18 | 0.065 | 13 | 0.063 | 15 | 0.147 | 10 | 0.135 | 11 |
| Bank 4 | 0.046 | 17 | 0.041 | 17 | 0.062 | 16 | 0.062 | 17 | 0.134 | 12 | 0.128 | 14 |
| Bank 5 | 0.041 | 19 | 0.035 | 19 | 0.024 | 19 | 0.034 | 19 | -0.018 | 19 | 0.019 | 19 |
| Bank 6 | 0.075 | 3 | 0.084 | 2 | 0.079 | 4 | 0.088 | 2 | 0.174 | 4 | 0.195 | 2 |
| Bank 7 | 0.067 | 6 | 0.063 | 5 | 0.075 | 7 | 0.073 | 5 | 0.161 | 5 | 0.149 | 8 |
| Bank 8 | 0.069 | 5 | 0.058 | 9 | 0.075 | 6 | 0.071 | 10 | 0.154 | 9 | 0.141 | 10 |
| Bank 9 | 0.061 | 10 | 0.058 | 10 | 0.068 | 11 | 0.067 | 13 | 0.140 | 11 | 0.131 | 12 |
| Bank 10 | 0.073 | 4 | 0.072 | 3 | 0.066 | 12 | 0.071 | 9 | 0.115 | 18 | 0.130 | 13 |
| Bank 11 | 0.078 | 2 | 0.072 | 4 | 0.088 | 1 | 0.082 | 3 | 0.205 | 1 | 0.182 | 4 |
| Bank 12 | 0.060 | 11 | 0.057 | 11 | 0.074 | 8 | 0.071 | 8 | 0.166 | 6 | 0.148 | 9 |
| Bank 13 | 0.057 | 12 | 0.060 | 7 | 0.063 | 15 | 0.069 | 11 | 0.133 | 13 | 0.150 | 6 |
| Bank 14 | 0.065 | 9 | 0.061 | 6 | 0.068 | 10 | 0.067 | 12 | 0.132 | 14 | 0.125 | 16 |
| Bank 15 | 0.049 | 16 | 0.049 | 14 | 0.058 | 18 | 0.059 | 18 | 0.116 | 17 | 0.112 | 18 |
| Bank 16 | 0.085 | 1 | 0.094 | 1 | 0.084 | 2 | 0.095 | 1 | 0.198 | 2 | 0.231 | 1 |
| Bank 17 | 0.065 | 8 | 0.057 | 12 | 0.081 | 3 | 0.080 | 4 | 0.185 | 3 | 0.183 | 3 |
| Bank 18 | 0.052 | 14 | 0.042 | 16 | 0.064 | 14 | 0.062 | 16 | 0.130 | 15 | 0.127 | 15 |
| Bank 19 | 0.066 | 7 | 0.058 | 8 | 0.076 | 5 | 0.072 | 6 | 0.161 | 7 | 0.149 | 7 |
Source: own elaboration.
Table 9 Rankings of banks obtained in the second version
| Ranking | Hellwig | TOPSIS | Standardisation | |||||||||
| W1 | W2 | W1 | W2 | W1 | W2 | |||||||
| Scores | Rank | Scores | Rank | Scores | Rank | Scores | Rank | Scores | Rank | Scores | Rank | |
| Bank 1 | 0.391 | 2 | 0.344 | 3 | 0.594 | 5 | 0.460 | 5 | 0.009 | 8 | 0.027 | 5 |
| Bank 2 | 0.293 | 8 | 0.239 | 8 | 0.548 | 9 | 0.401 | 9 | -0.019 | 13 | -0.013 | 13 |
| Bank 3 | 0.322 | 6 | 0.244 | 7 | 0.585 | 6 | 0.422 | 7 | -0.010 | 10 | -0.003 | 10 |
| Bank 4 | 0.316 | 7 | 0.249 | 6 | 0.576 | 7 | 0.418 | 8 | -0.016 | 11 | -0.009 | 12 |
| Bank 5 | -0.005 | 19 | 0.118 | 14 | 0.268 | 19 | 0.212 | 19 | -0.049 | 18 | -0.035 | 14 |
| Bank 6 | 0.359 | 3 | 0.314 | 4 | 0.664 | 2 | 0.574 | 2 | 0.006 | 9 | 0.036 | 4 |
| Bank 7 | 0.180 | 13 | 0.119 | 13 | 0.542 | 13 | 0.392 | 13 | -0.018 | 12 | -0.037 | 15 |
| Bank 8 | 0.088 | 18 | 0.148 | 12 | 0.431 | 18 | 0.320 | 18 | 0.059 | 2 | 0.037 | 3 |
| Bank 9 | 0.176 | 14 | 0.100 | 16 | 0.546 | 10 | 0.389 | 14 | -0.042 | 16 | -0.058 | 17 |
| Bank 10 | 0.111 | 16 | 0.172 | 11 | 0.488 | 17 | 0.394 | 12 | 0.011 | 7 | 0.006 | 8 |
| Bank 11 | 0.104 | 17 | 0.107 | 15 | 0.517 | 16 | 0.398 | 11 | 0.027 | 5 | -0.003 | 9 |
| Bank 12 | 0.187 | 11 | 0.096 | 17 | 0.602 | 4 | 0.435 | 6 | -0.044 | 17 | -0.061 | 18 |
| Bank 13 | 0.324 | 5 | 0.301 | 5 | 0.612 | 3 | 0.509 | 3 | -0.025 | 15 | -0.007 | 11 |
| Bank 14 | 0.124 | 15 | 0.082 | 19 | 0.530 | 14 | 0.378 | 17 | -0.023 | 14 | -0.046 | 16 |
| Bank 15 | 0.185 | 12 | 0.089 | 18 | 0.545 | 11 | 0.385 | 16 | -0.090 | 19 | -0.095 | 19 |
| Bank 16 | 0.404 | 1 | 0.412 | 1 | 0.721 | 1 | 0.715 | 1 | 0.052 | 3 | 0.088 | 2 |
| Bank 17 | 0.347 | 4 | 0.389 | 2 | 0.565 | 8 | 0.476 | 4 | 0.121 | 1 | 0.144 | 1 |
| Bank 18 | 0.205 | 9 | 0.206 | 9 | 0.524 | 15 | 0.386 | 15 | 0.017 | 6 | 0.009 | 7 |
| Bank 19 | 0.188 | 10 | 0.194 | 10 | 0.543 | 12 | 0.398 | 10 | 0.033 | 4 | 0.020 | 6 |
| Ranking | Unitarization | Strahl | Nowak | |||||||||
| W1 | W2 | W1 | W2 | W1 | W2 | |||||||
| Scores | Rank | Scores | Rank | Scores | Rank | Scores | Rank | Scores | Rank | Scores | Rank | |
| Bank 1 | 0.055 | 7 | 0.054 | 5 | 0.070 | 7 | 0.073 | 5 | 0.158 | 7 | 0.161 | 5 |
| Bank 2 | 0.048 | 12 | 0.043 | 12 | 0.061 | 15 | 0.062 | 15 | 0.126 | 16 | 0.127 | 14 |
| Bank 3 | 0.050 | 10 | 0.046 | 9 | 0.067 | 10 | 0.066 | 8 | 0.152 | 10 | 0.141 | 11 |
| Bank 4 | 0.048 | 11 | 0.044 | 10 | 0.064 | 12 | 0.064 | 13 | 0.138 | 11 | 0.134 | 12 |
| Bank 5 | 0.044 | 16 | 0.040 | 14 | 0.026 | 19 | 0.037 | 19 | -0.014 | 19 | 0.025 | 19 |
| Bank 6 | 0.054 | 8 | 0.055 | 4 | 0.073 | 6 | 0.081 | 3 | 0.170 | 4 | 0.189 | 3 |
| Bank 7 | 0.047 | 13 | 0.035 | 15 | 0.069 | 8 | 0.065 | 10 | 0.157 | 8 | 0.143 | 9 |
| Bank 8 | 0.068 | 2 | 0.056 | 3 | 0.075 | 4 | 0.071 | 5 | 0.157 | 9 | 0.145 | 8 |
| Bank 9 | 0.040 | 17 | 0.029 | 17 | 0.062 | 14 | 0.059 | 17 | 0.136 | 12 | 0.126 | 15 |
| Bank 10 | 0.054 | 9 | 0.046 | 8 | 0.061 | 16 | 0.064 | 12 | 0.112 | 18 | 0.125 | 16 |
| Bank 11 | 0.058 | 5 | 0.043 | 11 | 0.082 | 2 | 0.075 | 4 | 0.201 | 1 | 0.177 | 4 |
| Bank 12 | 0.039 | 18 | 0.028 | 18 | 0.069 | 9 | 0.064 | 14 | 0.162 | 6 | 0.143 | 10 |
| Bank 13 | 0.044 | 15 | 0.042 | 13 | 0.060 | 17 | 0.065 | 11 | 0.132 | 14 | 0.148 | 7 |
| Bank 14 | 0.045 | 14 | 0.032 | 16 | 0.063 | 13 | 0.060 | 16 | 0.128 | 15 | 0.120 | 17 |
| Bank 15 | 0.028 | 19 | 0.020 | 19 | 0.052 | 18 | 0.052 | 18 | 0.112 | 17 | 0.106 | 18 |
| Bank 16 | 0.064 | 3 | 0.066 | 2 | 0.079 | 3 | 0.088 | 2 | 0.194 | 3 | 0.225 | 1 |
| Bank 17 | 0.085 | 1 | 0.085 | 1 | 0.087 | 1 | 0.089 | 1 | 0.196 | 2 | 0.197 | 2 |
| Bank 18 | 0.056 | 6 | 0.047 | 7 | 0.066 | 11 | 0.066 | 9 | 0.134 | 13 | 0.133 | 13 |
| Bank 19 | 0.060 | 4 | 0.051 | 6 | 0.075 | 5 | 0.071 | 7 | 0.162 | 5 | 0.151 | 6 |
Source: own elaboration.
The final ranking being the arithmetic sum of variant 1 and variant 2 is presented in Figure 3.
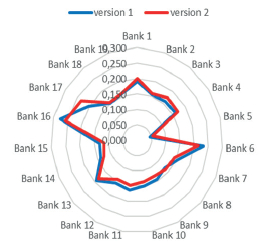
Although different assumptions were made for Option 1 and Option 2 for the Z6 variable, the results do not show major differences in the hierarchy of the three most resilient banks to potential COVID-19 effects and least resilient ones (Table 10 and Table 11). Banks N°5 and N°15 differ significantly from the others in their resistance level. Out of the 24 rankings performed, bank N°5 took last place 19 times, while bank N°15 was classified 7 times in the penultimate place and 4 times in the last. The situation is similar with the best banks. For example, bank N°16 was the highest ranked bank 15 times and 5 times it took second place. The results of the other 14 banks are no longer so clear since the positions occupied in the rankings are more diverse.
Table 10 Final ranking as the arithmetic mean of 6 methods - version 1
| No. | Ranking W1 | Ranking W2 | Ranking Total: W1+W2 | |||||||||
| Arithmetic mean - scores | Rank | Arithmetic mean - places | Rank | Arithmetic mean - scores | Rank | Arithmetic mean - places | Rank | Arithmetic mean - scores | Rank | Arithmetic mean - places | Rank | |
| Bank 1 | 0.206 | 4 | 8.5 | 6 | 0.176 | 5 | 8.0 | 6 | 0.191 | 5 | 8.3 | 7 |
| Bank 2 | 0.174 | 12 | 13.3 | 16 | 0.139 | 10 | 12.8 | 13 | 0.156 | 11 | 13.1 | 16 |
| Bank 3 | 0.183 | 6 | 12.0 | 14 | 0.137 | 12 | 13.0 | 14 | 0.160 | 9 | 12.5 | 14 |
| Bank 4 | 0.181 | 8 | 12.3 | 15 | 0.140 | 9 | 13.3 | 16 | 0.160 | 7 | 12.8 | 15 |
| Bank 5 | 0.036 | 19 | 19.0 | 19 | 0.054 | 19 | 19.0 | 19 | 0.045 | 19 | 19.0 | 19 |
| Bank 6 | 0.236 | 2 | 3.2 | 2 | 0.228 | 2 | 2.2 | 2 | 0.232 | 2 | 2.7 | 2 |
| Bank 7 | 0.176 | 10 | 8.5 | 6 | 0.137 | 12 | 8.2 | 7 | 0.156 | 12 | 8.3 | 6 |
| Bank 8 | 0.142 | 18 | 10.2 | 10 | 0.123 | 16 | 11.2 | 11 | 0.133 | 17 | 10.7 | 11 |
| Bank 9 | 0.166 | 13 | 10.8 | 11 | 0.124 | 15 | 12.7 | 12 | 0.145 | 15 | 11.8 | 12 |
| Bank 10 | 0.150 | 17 | 11.8 | 12 | 0.150 | 6 | 8.3 | 8 | 0.150 | 14 | 10.1 | 10 |
| Bank 11 | 0.177 | 9 | 6.5 | 4 | 0.150 | 7 | 6.7 | 5 | 0.163 | 6 | 6.6 | 5 |
| Bank 12 | 0.182 | 7 | 8.3 | 5 | 0.134 | 14 | 10.3 | 10 | 0.158 | 10 | 9.3 | 9 |
| Bank 13 | 0.199 | 5 | 9.8 | 9 | 0.187 | 4 | 6.3 | 4 | 0.193 | 4 | 8.1 | 4 |
| Bank 14 | 0.157 | 15 | 11.8 | 12 | 0.121 | 17 | 13.0 | 14 | 0.139 | 16 | 12.4 | 13 |
| Bank 15 | 0.152 | 16 | 15.0 | 18 | 0.109 | 18 | 16.3 | 18 | 0.130 | 18 | 15.7 | 18 |
| Bank 16 | 0.268 | 1 | 1.3 | 1 | 0.287 | 1 | 1.0 | 1 | 0.278 | 1 | 1.2 | 1 |
| Bank 17 | 0.209 | 3 | 5.5 | 3 | 0.197 | 3 | 5.2 | 3 | 0.203 | 3 | 5.3 | 3 |
| Bank 18 | 0.164 | 14 | 13.3 | 16 | 0.137 | 11 | 13.8 | 17 | 0.151 | 13 | 13.6 | 17 |
| Bank 19 | 0.175 | 11 | 8.7 | 8 | 0.145 | 8 | 8.7 | 9 | 0.160 | 8 | 8.7 | 8 |
Source: own elaboration.
Table 11 Final ranking as the arithmetic mean of 6 methods - version 2
| No. | Ranking W1 | Ranking W2 | Ranking Total: W1+W2 | |||||||||
| Arithmetic mean - scores | Rank | Arithmetic mean - places | Rank | Arithmetic mean - scores | Rank | Arithmetic mean - places | Rank | Arithmetic mean - scores | Rank | Arithmetic mean - places | Rank | |
| Bank 1 | 0.213 | 4 | 6.0 | 4 | 0.186 | 4 | 4.7 | 4 | 0.200 | 4 | 5.3 | 4 |
| Bank 2 | 0.176 | 9 | 12.2 | 14 | 0.143 | 9 | 11.8 | 13 | 0.160 | 9 | 12.0 | 13 |
| Bank 3 | 0.194 | 5 | 8.7 | 7 | 0.153 | 6 | 8.7 | 8 | 0.173 | 6 | 8.7 | 8 |
| Bank 4 | 0.188 | 7 | 9.8 | 9 | 0.150 | 7 | 10.2 | 11 | 0.169 | 7 | 10.0 | 10 |
| Bank 5 | 0.045 | 19 | 18.3 | 19 | 0.066 | 19 | 16.5 | 17 | 0.056 | 19 | 17.4 | 19 |
| Bank 6 | 0.221 | 3 | 5.3 | 3 | 0.208 | 3 | 3.3 | 3 | 0.215 | 3 | 4.3 | 3 |
| Bank 7 | 0.163 | 13 | 11.2 | 12 | 0.120 | 14 | 12.5 | 14 | 0.141 | 13 | 11.8 | 12 |
| Bank 8 | 0.146 | 15 | 8.8 | 8 | 0.129 | 13 | 8.2 | 6 | 0.138 | 14 | 8.5 | 7 |
| Bank 9 | 0.153 | 14 | 13.8 | 15 | 0.107 | 16 | 16.0 | 16 | 0.130 | 16 | 14.9 | 16 |
| Bank 10 | 0.139 | 17 | 13.8 | 15 | 0.135 | 11 | 11.2 | 12 | 0.137 | 15 | 12.5 | 15 |
| Bank 11 | 0.165 | 12 | 7.7 | 6 | 0.133 | 12 | 9.0 | 9 | 0.149 | 11 | 8.3 | 6 |
| Bank 12 | 0.169 | 10 | 10.8 | 11 | 0.117 | 15 | 13.8 | 15 | 0.143 | 12 | 12.3 | 14 |
| Bank 13 | 0.191 | 6 | 11.5 | 13 | 0.176 | 5 | 8.3 | 7 | 0.184 | 5 | 9.9 | 9 |
| Bank 14 | 0.145 | 16 | 14.2 | 17 | 0.104 | 17 | 16.8 | 18 | 0.124 | 17 | 15.5 | 17 |
| Bank 15 | 0.139 | 18 | 16.0 | 18 | 0.093 | 18 | 18.0 | 19 | 0.116 | 18 | 17.0 | 18 |
| Bank 16 | 0.252 | 1 | 2.3 | 1 | 0.266 | 1 | 1.5 | 1 | 0.259 | 1 | 1.9 | 1 |
| Bank 17 | 0.233 | 2 | 2.8 | 2 | 0.230 | 2 | 1.8 | 2 | 0.232 | 2 | 2.3 | 2 |
| Bank 18 | 0.167 | 11 | 10.0 | 10 | 0.141 | 10 | 10.0 | 10 | 0.154 | 10 | 10.0 | 10 |
| Bank 19 | 0.177 | 8 | 6.7 | 5 | 0.147 | 8 | 7.5 | 5 | 0.162 | 8 | 7.1 | 5 |
Source: own elaboration.
It seems that the authoritative results are also the data obtained by both pattern methods, i.e. Hellwig and TOPSIS, using weighting factors w2 established by the expert method, in which the diagnostic features of capital adequacy, short term liquidity and resilience of the credit portfolio play the most important role.
In case of the analysis of rankings (linear ordering methods used), the unitarization method turned out to be the most similar to the others in case of the first version for both weights 1 and 2. In the second version, also the unitarization method was the most similar to the others in case of weight 1, while for weight 2 it was the Nowak's method (Table 12). It should be noted, however, that in the case of selected linear ordering methods (as many as four are non-pattern methods) both methods determined by the Kukuła approach belong to this group.
Table 12 Vectors of probability’s measures
| Chosen linear ordering methods | 1 | 2 | 3 | 4 | 5 | 6 | |
|---|---|---|---|---|---|---|---|
| version 1 | Ranking w1 | 0.460 | 0.489 | 0.616 | 0.611 | 0.624 | 0.631 |
| Ranking w2 | 0.544 | 0.587 | 0.658 | 0.613 | 0.682 | 0.689 | |
| version 2 | Ranking w1 | 0.469 | 0.533 | 0.611 | 0.611 | 0.647 | 0.631 |
| Ranking w2 | 0.619 | 0.679 | 0.734 | 0.728 | 0.732 | 0.692 |
Source: own elaboration.
The sensitivity analysis of the TOPSIS ranking showed no significant differences (Tables 13, 14). Both the first three positions of the banks in the ranking and above all, the last two are unchanged in all adopted weights in both versions. Although some positions within the ranking change slightly, the correlations calculated using the Spearman and Kendall methods are very high (Table 15).
Table 13 Results of the sensitivity analysis in the first version
| Original ranking | Decrease in weight | |||||||
|---|---|---|---|---|---|---|---|---|
| -5% | -10% | -15% | -20% | |||||
| Scores | Rank | Scores | Rank | Scores | Rank | Scores | Rank | |
| 5 | 0.484 | 5 | 0.508 | 4 | 0.532 | 4 | 0.555 | 4 |
| 9 | 0.427 | 9 | 0.454 | 9 | 0.480 | 9 | 0.506 | 9 |
| 7 | 0.451 | 7 | 0.480 | 7 | 0.509 | 7 | 0.537 | 7 |
| 8 | 0.447 | 8 | 0.475 | 8 | 0.503 | 8 | 0.530 | 8 |
| 19 | 0.226 | 19 | 0.236 | 19 | 0.246 | 19 | 0.255 | 19 |
| 2 | 0.588 | 2 | 0.603 | 2 | 0.619 | 2 | 0.635 | 2 |
| 13 | 0.419 | 12 | 0.446 | 11 | 0.472 | 11 | 0.499 | 12 |
| 18 | 0.342 | 18 | 0.362 | 18 | 0.382 | 18 | 0.401 | 18 |
| 15 | 0.417 | 13 | 0.445 | 12 | 0.472 | 12 | 0.500 | 11 |
| 12 | 0.411 | 16 | 0.429 | 17 | 0.446 | 17 | 0.462 | 17 |
| 11 | 0.421 | 11 | 0.443 | 13 | 0.465 | 14 | 0.485 | 16 |
| 6 | 0.465 | 6 | 0.495 | 6 | 0.524 | 5 | 0.553 | 5 |
| 3 | 0.527 | 3 | 0.545 | 3 | 0.564 | 3 | 0.582 | 3 |
| 17 | 0.405 | 17 | 0.432 | 16 | 0.459 | 16 | 0.486 | 15 |
| 16 | 0.414 | 15 | 0.442 | 14 | 0.470 | 13 | 0.498 | 13 |
| 1 | 0.715 | 1 | 0.716 | 1 | 0.717 | 1 | 0.718 | 1 |
| 4 | 0.492 | 4 | 0.507 | 5 | 0.523 | 6 | 0.539 | 6 |
| 14 | 0.414 | 14 | 0.439 | 15 | 0.463 | 15 | 0.487 | 14 |
| 10 | 0.425 | 10 | 0.451 | 10 | 0.477 | 10 | 0.502 | 10 |
| Original ranking | Increase in weight | |||||||
| 5% | 10% | 15% | 20% | |||||
| Scores | Rank | Scores | Rank | Scores | Rank | Scores | Rank | |
| 5 | 0.437 | 5 | 0.414 | 5 | 0.392 | 5 | 0.372 | 5 |
| 9 | 0.374 | 10 | 0.347 | 11 | 0.321 | 11 | 0.295 | 11 |
| 7 | 0.393 | 7 | 0.363 | 7 | 0.333 | 9 | 0.303 | 9 |
| 8 | 0.389 | 8 | 0.361 | 8 | 0.332 | 8 | 0.304 | 8 |
| 19 | 0.202 | 19 | 0.190 | 19 | 0.177 | 19 | 0.164 | 19 |
| 2 | 0.560 | 2 | 0.548 | 2 | 0.537 | 2 | 0.527 | 2 |
| 13 | 0.364 | 14 | 0.336 | 14 | 0.308 | 14 | 0.280 | 14 |
| 18 | 0.299 | 18 | 0.277 | 18 | 0.255 | 18 | 0.234 | 18 |
| 15 | 0.360 | 15 | 0.331 | 15 | 0.303 | 15 | 0.274 | 15 |
| 12 | 0.376 | 9 | 0.359 | 9 | 0.342 | 7 | 0.326 | 6 |
| 11 | 0.373 | 11 | 0.348 | 10 | 0.323 | 10 | 0.298 | 10 |
| 6 | 0.404 | 6 | 0.373 | 6 | 0.342 | 6 | 0.311 | 7 |
| 3 | 0.490 | 3 | 0.473 | 3 | 0.457 | 3 | 0.441 | 3 |
Source: own elaboration.
Table 14 Results of the sensitivity analysis in the second version
| Original ranking | Decrease in weight | |||||||
|---|---|---|---|---|---|---|---|---|
| -5% | -10% | -15% | -20% | |||||
| Scores | Rank | Scores | Rank | Scores | Rank | Scores | Rank | |
| 5 | 0.484 | 5 | 0.508 | 4 | 0.511 | 5 | 0.555 | 4 |
| 9 | 0.427 | 9 | 0.454 | 9 | 0.465 | 9 | 0.506 | 9 |
| 7 | 0.451 | 7 | 0.480 | 7 | 0.496 | 7 | 0.537 | 7 |
| 8 | 0.446 | 8 | 0.474 | 8 | 0.487 | 8 | 0.530 | 8 |
| 19 | 0.224 | 19 | 0.235 | 19 | 0.255 | 19 | 0.254 | 19 |
| 2 | 0.589 | 2 | 0.604 | 2 | 0.582 | 2 | 0.636 | 2 |
| 13 | 0.419 | 12 | 0.446 | 11 | 0.455 | 12 | 0.499 | 12 |
| 18 | 0.341 | 18 | 0.362 | 18 | 0.376 | 18 | 0.401 | 18 |
| 15 | 0.417 | 13 | 0.445 | 12 | 0.455 | 11 | 0.500 | 11 |
| 12 | 0.412 | 15 | 0.429 | 17 | 0.428 | 17 | 0.462 | 17 |
| 11 | 0.421 | 11 | 0.444 | 13 | 0.449 | 14 | 0.485 | 15 |
| 6 | 0.465 | 6 | 0.495 | 6 | 0.505 | 6 | 0.553 | 5 |
| 3 | 0.527 | 3 | 0.546 | 3 | 0.534 | 3 | 0.582 | 3 |
| 17 | 0.405 | 17 | 0.433 | 16 | 0.443 | 16 | 0.486 | 14 |
| 16 | 0.414 | 14 | 0.442 | 14 | 0.453 | 13 | 0.498 | 13 |
| 1 | 0.716 | 1 | 0.717 | 1 | 0.654 | 1 | 0.719 | 1 |
| 4 | 0.491 | 4 | 0.507 | 5 | 0.511 | 4 | 0.539 | 6 |
| 14 | 0.411 | 16 | 0.436 | 15 | 0.446 | 15 | 0.485 | 16 |
| 10 | 0.425 | 10 | 0.451 | 10 | 0.462 | 10 | 0.502 | 10 |
| Original ranking | Increase in weight | |||||||
| 5% | 10% | 15% | 20% | |||||
| Scores | Rank | Scores | Rank | Scores | Rank | Scores | Rank | |
| 5 | 0.437 | 5 | 0.414 | 5 | 0.392 | 5 | 0.371 | 5 |
| 9 | 0.374 | 10 | 0.347 | 11 | 0.321 | 11 | 0.295 | 11 |
| 7 | 0.392 | 7 | 0.363 | 7 | 0.333 | 8 | 0.303 | 8 |
| 8 | 0.389 | 8 | 0.360 | 8 | 0.331 | 9 | 0.302 | 9 |
| 19 | 0.199 | 19 | 0.186 | 19 | 0.173 | 19 | 0.159 | 19 |
| 2 | 0.561 | 2 | 0.548 | 2 | 0.537 | 2 | 0.527 | 2 |
| 13 | 0.364 | 13 | 0.336 | 13 | 0.308 | 14 | 0.280 | 14 |
| 18 | 0.298 | 18 | 0.276 | 18 | 0.254 | 18 | 0.232 | 18 |
| 15 | 0.360 | 15 | 0.332 | 15 | 0.303 | 15 | 0.274 | 15 |
| 12 | 0.376 | 9 | 0.359 | 9 | 0.342 | 7 | 0.326 | 6 |
| 11 | 0.374 | 11 | 0.349 | 10 | 0.324 | 10 | 0.298 | 10 |
| 6 | 0.404 | 6 | 0.374 | 6 | 0.342 | 6 | 0.311 | 7 |
| 3 | 0.491 | 3 | 0.473 | 3 | 0.457 | 3 | 0.442 | 3 |
| 17 | 0.350 | 17 | 0.322 | 17 | 0.294 | 17 | 0.265 | 17 |
| 16 | 0.357 | 16 | 0.328 | 16 | 0.299 | 16 | 0.270 | 16 |
| 1 | 0.715 | 1 | 0.714 | 1 | 0.713 | 1 | 0.712 | 1 |
| 4 | 0.461 | 4 | 0.448 | 4 | 0.435 | 4 | 0.424 | 4 |
| 14 | 0.360 | 14 | 0.335 | 14 | 0.309 | 13 | 0.284 | 13 |
| 10 | 0.371 | 12 | 0.344 | 12 | 0.316 | 12 | 0.289 | 12 |
Source: own elaboration.
Table 15 Results of sensitivity analysis - correlations
| Specification | -5% | -10% | -15% | -20% | 5% | 10% | 15% | 20% |
|---|---|---|---|---|---|---|---|---|
| Version 1 | ||||||||
| Spearman's correlation | 0.9807 | 0.9561 | 0.9439 | 0.9246 | 0.9860 | 0.9825 | 0.9649 | 0.9474 |
| Kendall's correlations | 0.9415 | 0.8830 | 0.8596 | 0.8246 | 0.9415 | 0.9298 | 0.8947 | 0.8713 |
| Version 2 | ||||||||
| Spearman's correlation | 0.9807 | 0.9561 | 0.9456 | 0.9246 | 0.9877 | 0.9842 | 0.9667 | 0.9561 |
| Kendall's correlations | 0.9415 | 0.8830 | 0.8713 | 0.8246 | 0.9532 | 0.9415 | 0.9064 | 0.8947 |
Source: own elaboration.
5. Discussion
This study is based on selected methodologies of linear ordering methods, i. e. Hellwig (1968) , TOPSIS (Hwang & Yoon, 1981), Strahl (1978) , Nowak (1977) , Kukuła and Luty (2015) , which were adapted to the needs of quantifying the resilience of individual banks to the effects of the COVID-19 crisis, nevertheless, the proposed approach makes it possible to modify the set of variables according to the type of crisis and the nature of its impact on banks. The results obtained are consistent with those of Aldasoro et al. (2020) who indicated that the COVID-19 crisis has relatively milder impact on well capitalised and highly profitable banks. The impact of the pandemic on the condition of individual sectors of the economy and thus the quality of credit portfolios indicated in this study largely corresponds to the conclusions of the paper prepared by Donth and Gustafsson (2020) and presents solid evidences in favour of Hypothesis 1. The established ranking of banks and the possibility to determine the relative differences in the resilience of banks to the COVID-19 crisis may form the basis for an index algorithm for bank resilience to crisis on the model proposed by Leiva-Leon et al. (2020) , i.e. the Global Weakness Index.
This research has many links with the study conducted by Korzeb and Niedziółka (2020) , however, in this case the Portuguese banking sector was chosen for the analysis, which in many aspects is the opposite of the Polish banking sector (functioning in the euro area, a significant number of small and medium-sized banks, greater industry specialization, smaller shareholding of the state, much larger share of COVID-19-sensitive sectors in the portfolios of large banks, greater internationalization of the banking sector in Portugal). Asking whether in Portugal the resistance of banks to the crisis is more dependent on the structure of the portfolio than on other determinants, it was decided to adjust the methodology to the formulated research questions, primarily by individualizing the construction of a set of explanatory variables, broadening the spectrum of linear ordering methods, analyzing the sensitivity of the obtained results and conducting a procedure aimed at selecting the optimal linear ordering method for the sample. The above actions are a far-reaching development of the concept described in Korzeb and Niedziółka (2020).
Thus, one of the important contributions of the study in question is the creation of an algorithm for the linear ordering of banks within a given banking sector, indicating the optimum method for that sector.
The results of the research of the Portuguese banking sector yielded different results from those of the Polish banking sector, where the largest commercial banks in terms of balance sheet total, equity and net profit generated were most resilient. The results of this study for Portugal show that the best banks in the rankings are mainly characterised by a high Tier 1 ratio, an above-average LCR level, and a relatively low C/I ratio compared to the industry. Two of them are relatively small banks. This may mean that their specialization (in this case resulting in a relatively low concentration of COVID-19-sensitive industries in their portfolios) or the specificity of their business (retail or private banking) allows them to manage their assets and liabilities in a way that ensures their stable operation in a turbulently changing business environment. It thus appears that the level of capital adequacy and liquidity are critical determinants of banks resilience to a pandemic crisis. Taking the above into account, to some extent the results of the conducted study are consistent with the conclusions formulated by Hardy and Takáts (2020). Thus, having the aforementioned conclusion on capital buffers and their relation with resistance to COVID-19 we can find strong evidences that favour Hypothesis 2.
The results obtained can also be used in supervisory policy, helping to determine the optimal relationship between permitted capital and liquidity buffers consumption and restrictions on the payment of dividends and bonuses. In this sense, the conclusions of the study complement those formulated by Borio and Restoy (2020) .
6. Conclusions
Based on the previous analyses, a number of important conclusions and some contributions to subsequent studies can be highlighted and applied in the bank management and supervisory practice. The use of multidimensional statistical analysis is a useful tool for research on the impact of the crisis on the situation of banks operating in the Portuguese banking sector. The results of the research indicate that the choice of the linear ordering method did not significantly affect the identification of the most and of the least resistant banks to the effects of the pandemic. The resilience of Portuguese banks to the potential impact of the COVID-19 pandemic crisis is not evenly distributed among individual banks. Rankings of banks using six linear ordering methods, taking into account two weighting procedures and two variants of the Z6 diagnostic feature, clearly indicated the most resistant banks: bank N°16, bank N°6 and bank N°17, and also the weakest ones: bank N°5 and bank N°15. The resilience of Portuguese banks to the COVID-19 crisis varies but it should be stressed that the banking system is as strong as its weakest link of the chain. In this context it is worthy to stress that the two banks with lower resilience ability are quite different; one of them has assets 25 times larger than the other. Anyway, together they represent 14% of the whole assets in the Portuguese banking system in 2019 and the bigger one was one of the only two banks that presented losses in December 2019.
Meanwhile, Portugal's experience of rescuing banks in financial distress in previous crises clearly shows the risks stemming from the level of resources needed for this purpose. It is quite symptomatic that among the four largest Portuguese banks in terms of assets, none of them is among the most resilient to the crisis. On one hand this may indicate that these banks, by virtue of their status, are forced to finance those sectors of the economy that are more vulnerable to the effects of the crisis being at the same time the most important ones, while on the other hand, it may cause an increasing systemic risk in the event of a protracted pandemic in Portugal or in the countries where they are most involved. However, it should be noticed that the largest banks are subject to systematic stress-testing by EBA.
There are certain limitations in the approaches used in this research, which include, first of all, the relatively short period of time since the pandemic began and the final extent and economic and social consequences are still quite uncertain. This study does not take into account the extent to which credit exposures are collateralised and the amount of provisions already created. Another limitation is the high aggregated level of the sectoral analysis of the risk as within the sections the risk may be very differentiated. Credit exposure by industry was generated by use of EU CRB-D template, which does not include more precise data on sub-sectors, e.g. decomposition of manufacturing.
In addition, there are relatively few players (including banks, which make difficult an in-depth sector analysis of the portfolio) represented on the stock market in Portugal. Nevertheless, the proposed tool allows to determine the degree of vulnerability of the banks to the effects of the shock in the form of COVID-19 and other (future) shocks, which to a different extent (from very negative to extremely positive) affect individual sectors and indirectly the condition of banks.

