


 English (pdf)
 Article in xml format
 Article references
 Send this article by e-mail
 Cited by SciELO
  Cited by Google
  Similars in
SciELO
Similars in
SciELO  Similars in Google
 Permalink
1. Introduction
The literature on innovation indicates that companies that have established and structured innovation processes can achieve better results than those that do not (Kahn, 2018). Thus, many works have tried to analyze this and have focused on answering how to materialize a successful new product after an efficient and reliable innovation process (Gronlund, Ronnberg, Sjodin, and Frishammar, 2010). The fact that less than 25% of new products introduced to the market are successful (Evanschitzky, Eisend, Calantone and Jiang, 2012), warrants the study of this innovation process.
Traditionally, literature on the New Product Development Process (NPDP) has been a dominant approach that deeply influences the practice and research (Bianchi et al., 2020). The most innovative companies have at least one version of it (Salerno, de Vasconcelos Gomes, da Silva, Bagno & Freitas, 2015); although a lot of research on the NPDP has been made in developed countries, it has been limited in developing ones (Salerno et al., 2015). Highincome countries and upper-middle-income countries such as South Korea (Im, Nakata, Park & Ha, 2003), Taiwan (Liu & Tsai, 2009), China (Song & Parry, 1994), and Indonesia (Wang et al., 2012) have tried to replicate NPDP studies. In medium-sized firms in middle or low-income countries, the size factor and the lack of formal work in this type of processes is very different from formal larger companies that have considerable resources to explore the market (DaSilva & Kampa, 2016). Furthermore, the impact of national traits regarding entrepreneurship, informality, frugality, vertical hierarchy, and limited academic groundwork of managers may affect success on NPDP.
Peru was one of the most dynamic economies in Latin America between 2002 and 2013, with an average GDP growth rate of 6.1% per year. Moreover, the manufacturing sector represents the highest percentage of contribution to the GDP (13.3%) followed by the oil and minerals sector (INEI, 2021). In the last 10 years, the Peruvian government actively encouraged and supported product innovation created by companies. However, research on NPDP still is scarce in the country (Seclen-Luna, 2019).
Based on the previous arguments, this work poses a central research question that goes further: Does the quality of NPDP activities have a positive association with the success of the new product? To address this issue, this original research aims to empirically evaluate said relationship by studying a sample of 140 medium-sized manufacturing companies from the Lima and Callao regions in Peru, using data collected through surveys. These regions were selected because they concéntrate about 60% of the Peruvian manufacturing companies (INEI, 2021).
An OLogit regression was used, and the results show a positive relationship between NPDP activities and new product success. However, these relationships can differ depending on the structure of their NPDP and its management (Seclen-Luna & Ponce-Regalado, 2020). The results indicate that although most companies performed these activities, only three out of eighteen are positively associated with the success of the new product. Therefore, this process may not have been well structured or managed. Also, companies may not properly perform these activities. Our study contributes empirically to the understanding of these relationships in the Peruvian context.
The paper is structured as follows: the second section introduces the literature review and establishes the research hypotheses. The third section details the population and sample, the description of the variables and datasets, and the method to tests the hypotheses. The fourth section discusses the empirical results. Lastly, the fifth section provides some brief conclusions, limitations, and suggestions for future research.
2. Conceptual Framework and Hypothesis Development
This study contributes to the theory of innovation processes (Salerno, de Vasconcelos Gomes, da Silva, Bagno & Freitas, 2015) by reinforcing the assumption that a structured process (Cooper, 2019) is determinant for the success of a new product. Nevertheless, evidence shows risks leading to new product development failures, such as grouping different forms of excessive producto development, from scope creep to over specification and feature creep (Marzi, 2022). Also, not considering agile methodologies or hybrid models (Gomes et al., 2022), and the role of institutional factors, especially in the context of emerging economies (Bao, Su, & Noble, 2021), could be relevant. In any case, the literature on the New Product Development Process (NPDP) has been a dominant approach traditionally, and deeply influences the practice and research (Salvato & Laplume, 2020).
2.1 Success of the New Product
As defined by the Oslo Manual (OCDE & Eurostat, 2005), business innovation can be understood as a process that enables combining the technical, financial, productive, organizational, and commercial capabilities to créate or improve a product. Hence, the innovation process includes the invention of technological development combined with the successful market introduction to end-users (Kumar & Phrommathed, 2005). Previous studies have used multi-indicators to measure the success of new products such as profits, product share of total sales, product share of total profits, etc., and several researchers have studied those indicators, e.g., Barczak, Griffin & Kahn (2009), Cooper & Kleinschmidt (1986) and Tih et al. (2016). That is, if the new producto has not been accepted by the market, innovation is not successful because introducing it to the public implies recovering the investment.
2.2 NPDP: Phases and activities
Although many authors have studied the NPDP, one of the predominant processes that ensure the success of new products involves various activities grouped by stages (Ulrich & Eppinger, 2016). Therefore, their structuring is key because it helps reduce uncertainty (Gaubinger, Rabl, Swan & Werani, 2015). The literature provides multiple examples of the relationship between new product success and an array of variables in different categories of analysis such as organizational and strategic factors; systems, processes, and methodologies; and other drivers for individual new product projects. In this context, the NPDP has been deeply influenced by many models that indicate best management practices (Salerno et al., 2015), for example, some models start with the opportunity identification phase and end with the management of the new product phase (Urban & Hauser, 1993). However, other models begin with the early innovation strategy and end with product maintenance (Gaubinger, et al., 2015).
Since the beginning of the NPDP approach, Cooper & Kleinschmidt (1986) suggested that companies should execute 13 main activities. As time has gone by, however, they have been changing and increasing their degree of complexity. Recently, Cooper (2017) included more activities in the NPDP that are grouped in five stages (Table 1).
Table 1 Stages and Activities of the NPDP.
| Stages | Activities |
|---|---|
| Scoping | 01 Preliminary market assessment |
| 02 Preliminary technical assessment | |
| 03 Preliminary financial assessment | |
| Build the Business Case | 04 Market analysis and concept test |
| 05 Detailed technical operations assessment | |
| 06 Legal assessment | |
| 07 Business and financial analysis | |
| Development | 08 Development of the prototype |
| 09 In-house prototype test | |
| 10 Limited customers prototype test | |
| 11 Development of manufacturing process | |
| 12 Updated financial analysis | |
| Testing and Validation | 13 Market tests |
| 14 Continued in-house prototype tests | |
| 15 Operation trials | |
| 16 Updated final financial analysis | |
| Launch | 17 Full productions |
| 18 Promoted launches |
Source: own elaboration from Cooper (2017).
2.2.1 Scoping Stage
The scoping stage includes preliminary market, technical, and financial assessments (Cooper, 2017). That is, first, the company must test if the new product meets the needs of the target customer. Subsequently, an evaluation of the resources needed to manufacture the new product is required, which may include the development of the concept and the definition of suppliers and products (Ulrich & Eppinger, 2016). Finally, the economic and financial viability is evaluated (Forcellini & Rozenfeld, 2006) to verify that the price of the new product covers the costs and enables obtaining the expected profit. Nevertheless, empirical evidence has shown that these preliminary activities in the early phase of NPDP or the fuzzy front-end are crucial (Dziallas, 2020) and characterized by high technical and market uncertainty (Verworn, 2009), especially in emerging countries (Seclen-Luna & Lopez-Valladares, 2020). Thus, based on these arguments, we propose the following hypotheses:
Hypothesis 1a: The quality of the Preliminary market assessment is positively associated with the new product success.
Hypothesis 1b: The quality of the Preliminary technical assessment is positively associated with the new product success.
Hypothesis 1c: The quality of the Preliminary financial assessment is positively associated with the new product success.
2.2.2 Build the Business Case.
This stage includes the Market analysis and concept test, the Detailed technical operations assessment, the Legal assessment, and the Business and financial analysis (Cooper, 2017). Hence, the Market analysis and concept test include positioning, targeting, and sales forecasting (Urban & Hauser, 1993), and it aims to assess the attractiveness of the market in a formal investigation (e.g., needs and wishes of the users, the possible size of the market, the opinion on the producto concept that would be offered, and the products and prices of competitors). Nevertheless, firms need to carefully manage market information in NPDP to avoid the negative consequences of over-reliance on it (Cui & Xiao, 2019). Then, a Detailed technical operations assessment is required to design or model the new product, consequently, the partial laboratory tests, the list of possible technical collaborators, and the detail of the supply and production processes are needed (Cooper, 2017). Moreover, the Legal assessment must cover the patent review and legal approvals to be obtained (Urban & Hauser, 1993) and, eventually, the evaluation of possible environmental, safety, health, and other issues (Cooper, 2017). Finally, the Business and financial analysis involves a formal estimate of product sales, costs, and expenses, a discounted revenue stream, a return-oninvestment analysis, and an estimated recovery period of the investment. Notwithstanding the above, evidence shows that in some cases companies choose not to carry out these activities; consequently, the stage of building the business case usually is incomplete and weak, which can lead to a failure to launch new products (Palomino et al., 2019). Based on these arguments, we propose the following hypotheses:
Hypothesis 2a: The quality of the Market analysis and concept test are positively associated with the new product success.
Hypothesis 2b: The quality of the Detailed technical operations assessment is positively associated with the new product success.
Hypothesis 2c: The quality of the Legal assessment is positively associated with the new product success.
Hypothesis 2d: The quality of the Business and financial analysis is positively associated with the new producto success.
2.2.3 Development Stage.
This stage is characterized by the prototyping and creation of the new product. Thus, the Development of the prototype, In-house prototype test, Limited customers prototype test, Development of manufacturing process, and Updated financial analysis are required. The Development of the prototype aims to reach a real-scale product with real characteristics after the ideas have been approved on marketing, technical, and financial grounds (Cooper, 2017; Parry & Song, 1994). The Inhouse prototype test involves a well-done laboratory testing under controlled conditions, with or without the presence of users, and the collection of the information obtained (Mishra, Kim & Lee, 1996). Ulrich & Eppinger (2016) stated that the overall performance, reliability, and durability of the product should be tested. Regarding limited customers test, it initially includes the opinions of real clients at their homes or facilities of the company about the prototype in almost real conditions (Cooper, 2017). Therefore, the manufacturing process is critical and production capacity and its flexibility are key (Seclen-Luna & Barrutia-Guenaga, 2019). Finally, the Updated financial analysis involves the revision of previous analysis with new data, plus the evaluation of “cannibalism” of the new product (Cooper, 2017). Based on these arguments, we propose the following hypotheses:
Hypothesis 3a: The quality of the Development of the prototype is positively associated with the new product success.
Hypothesis 3b: The quality of the In-house prototype test is positively associated with the new product success.
Hypothesis 3c: The quality of the limited customers’ prototype test is positively associated with the new product success.
Hypothesis 3d: The quality of the manufacturing process is positively associated with the new product success.
Hypothesis 3e: The quality of the Updated financial analysis is positively associated with the new producto success.
2.2.4 Testing and Validation Stage.
This stage involves internal tests and the integration of co-creation processes with users or customers to achieve innovation outcomes (Leminen et al., 2019). Thus, Market tests, Continued in-house prototype tests, Operation trials, and Updated final financial analysis are required. The Market tests seek that the new product is available to a limited group of people, or a limited geographical area, to verify the reaction of real customers (Ulrich & Eppinger, 2016). In-house prototype tests depend on the additional information received from potential customers that are used to adjust the product at the company’s laboratory. The goal is to check product quality and product performance under controlled conditions. The fact that laboratory tests are performed in several stages is an indicator of the continuous quality of the process. Operation trials are internal tests that verify the process flows and determine more precise production costs and throughput (Cooper, 2017). The final financial analysis is key before the new product moves to full-scale commercialization, and it aims to assess the tested and improved product considering new information (Cooper, 2011). At this point, it is important to mention that involving the consumer in an innovation process implies considerable changes in traditional innovation practices and management. Consumers become partners in cocreation, a form of open innovation, and not mere objects of study (Roberts, Palmer & Hughes, 2022). Based on these arguments, we propose the following hypotheses:
Hypothesis 4a: The quality of the Market tests is positively associated with the new product success.
Hypothesis 4b: The quality of the Continued in-house prototype tests is positively associated with the new product success.
Hypothesis 4c: The quality of the Operation trials is positively associated with the new product success.
Hypothesis 4d: The quality of the Updated final financial analysis is positively associated with the new product success.
2.2.5 Launch Stage.
The last activities of the NPDP are Full production and Promoted launch. The former includes commercial production and restocking distribution channels. Cooper (2017) considers that this activity begins with the purchase-if necessary-of machinery and equipment for production on a commercial scale, the start of production, stocking warehouses, sales points, or delivery to the final customer. The latter, Promoted launch, is not only the placement of the product on the market (Ulrich & Eppinger, 2016), it also includes a launch campaign, the use of advertising, and sales testing (Cooper, 2019). It may also involve salesforce training (Cooper, 2017). Additionally, businesses can obtain real-time feedback about the expectations and experiences of the new product launches through digital technologies (Kumar & Vigneswara, 2020). Based on these arguments, we propose the following hypotheses:
Hypothesis 5a: The quality of the Full production is positively associated with the new product success.
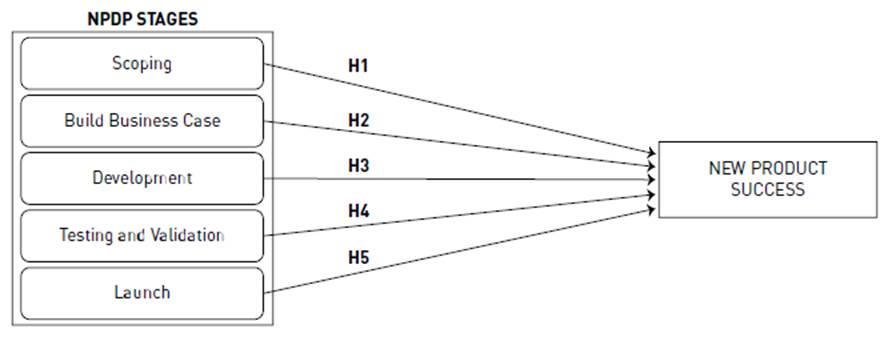
Hypothesis 5b: The quality of the Promoted launch is positively associated with the new product success.
Figure 1 presents the hypotheses formulated in a conceptual model.
3. Methodology
3.1 Population and Sample.
Peru has been making progress in achieving United Nations Sustainable Development Goal #8 related to decent work and economic growth (World Bank, 2020). It is at the third place in South America as the best country for doing business after Chile and Uruguay (Forbes, 2022). In terms of Competitiveness, Peru is ranked 65 among 141 countries in the world, but 90 in Innovation Capability (World Economic Forum, 2019). The manufacturing industry was one of the highest productive sectors in the country in 2019 with a 13.3% contribution to the economy's added value, followed by the mining industry with 12.4% (INEI, 2021). Nevertheless, some of the main barriers to conduct studies on innovation, especially NPDP, in Peruvian companies is the lack of databases with up-to-date contact information, as well as the lack of confidence in and diffusion of these topics (Seclen-Luna, 2019). The strategy to deal with this obstacle was to consider medium-sized manufacturing companies from the Top 10,000 firms with the highest sales ranking in Peru in 2017 (Cavanagh, 2017). This annual ranking has been used in previous studies on management issues and has been published in international journals such as Wong et al. (2018).
The study was limited to Lima and Callao regions because about 60% of the Peruvian manufacturing companies are there (INEI, 2021). A total of 817 mediumsized manufacturing companies were identified and defined as a population for the surveys. 140 companies sent their answers, which is equivalent to a response rate of 17%. This rate is similar to that of previous studies on the success of new product development (Souder, Buisson, & Garrett, 1997). Table 2 summarizes the sample composition by industrial branches.
Table 2 Sample Composition by industrial branches.
| Industrial Branch | Companies | Percentage |
|---|---|---|
| Metals and metal engineering | 33 | 24% |
| Food products and beverages | 29 | 21% |
| Chemicals and chemical products | 27 | 19% |
| Textiles | 20 | 14% |
| Rubber and plastic products | 16 | 11% |
| Others | 15 | 11% |
| Total | 140 | 100% |
Source: own elaboration.
Respondents were CEOs (19%), managers (38%), department chiefs (23%), area coordinators (14%), and others (6%). Hence, most of them participate in the decision-making team at their companies. To verify the hypotheses proposed, the empirical research was based on probabilistic sampling by online surveys. The survey was carried out between April and July 2019 and had a set of questions divided into five sections and 18 subsections, each one corresponding to NPDP. The structure of this questionnaire has been used in previous research on this topic, e.g., Barczak et al. (2009); De Wall & Knott (2009), and Cooper (2017, 2019). Furthermore, as in previous research (Seclen-Luna & Ponce-Regalado, 2020), the analysis unit in this study was each NPDP activity.
3.2 Description of Variables
On the one hand, the dependent variable-the new product success-was measured through one question: What is your perception of the new product success compared to the expectations that it generated? on a Likert scale of 5 points, where 5 was “much more than expected” and 1 was “much less than expected”. On the other hand, the independent variables deal with each NPDP activity and respondents were asked: How adequately do you think the activity was performed? on a Likert scale of 5 points, where 1 was “very poorly done” and 5 was “very well done.” This study considers that a five-point Likert scale allows a sufficient degree of differentiation to assess the analyzed variables (Lederer et al., 2008). Moreover, this way of measuring the perceptions of managers has been used by previous studies such as Cooper & Kleinschmidt (1986) or Cheng & Shiu (2015), and it is useful to show how their managerial experience (Kunc and Morecroft, 2010) helps to perceive the quality of decisions and the success of the company’s new products. Perception, in this context, includes all the cognitively interpreted information that managers use to make decisions (Mezias & Starbuck, 2003). Finally, in terms of the internal consistency of the scale, an alpha Cronbach value of α = 0.839 was obtained, thus indicating a high level of reliability.
3.3 Method and Test.
Under the research objectives, this work estimated the effects of the quality of the NPDP activities on the new product success in manufacturing companies. The descriptive data and regression models were computed using the SPSS software. The research measured the Tau-c coefficient to test the relationship between the variables and OLogit to test the dependency hypotheses.
4. Results and Discussion
4.1 Descriptive statistics.
Most companies in the sample (65%) launched their latest product in the last 12 months, and it was quite different from other products of the company in 39% of the cases. In addition, the main sources of the new product idea were the CEO (26%) and the clients (23%). However, to begin the NPDP, the new idea was approved by a group of people, not by a single person, in 82% of the cases. The NPDP activity most frequently done was Preliminary Market Assessment carried out by 90.1% of the firms (Table 3), followed by Preliminary Technical Assessment (88.7%), Preliminary Financial Assessment (86.5%), and Development of the Prototype (85.8%). These results show that the companies are concerned about the scoping stage and the development stage, and they are quite different from previous studies (Cooper & Kleinschmidt, 1986), which found that companies were concerned about the development stage. Moreover, regarding the quality of the performed NPDP activities, responders rated 33% of activities between 3.50 and 3.99 on average, and 66% between 4.00 and 4.49 on average. Hence, an asymmetric and skewed distribution was found. The respondents’ perception was that they had exceptionally good quality. Results show that the success of the new product was “greater or much greater than expected” in 58.5% of cases and 31.4% were considered “the same as expected” (Table 4).
Table 3 NPDP activities performed by manufacturing companies.
| Stages | Activities | (%) | Mean Points (1 to 5) |
|---|---|---|---|
| Scoping | 01 Preliminary market assessment | 90.1 | 3.8 |
| 02 Preliminary technical assessment | 88.7 | 4.0 | |
| 03 Preliminary financial assessment | 86.5 | 3.9 | |
| Build the Business Case | 04 Market analysis and concept test | 46.1 | 3.9 |
| 05 Detailed technical operations assessment | 78.7 | 4.0 | |
| 06 Legal assessment | 49.6 | 4.0 | |
| 07 Business and financial analysis | 55.3 | 4.1 | |
| Development | 08 Development of the prototype | 85.8 | 4.3 |
| 09 In-house prototype test | 82.3 | 4.2 | |
| 10 Limited customers prototype Test | 59.6 | 4.2 | |
| 11 Development of manufacturing process | 74.5 | 4.2 | |
| 12 Updated financial analysis | 53.2 | 4.1 | |
| Testing and validation | 13 Market tests | 56.0 | 4.0 |
| 14 Continued in-house prototype tests | 64.5 | 4.2 | |
| 15 Operation trials | 81.6 | 4.3 | |
| 16 Updated final financial Análisis | 56.0 | 4.2 | |
| Launch | 17 Full productions | 82.3 | 4.1 |
| 18 Promoted launches | 49.6 | 4.1 |
Source: own elaboration.
Table 4 Descriptive Statistics. Level of product success.
| Success Level | Companies | Percentage |
|---|---|---|
| Much less than expected | 5 | 3.6% |
| Less than expected | 9 | 6.4% |
| Same as expected | 44 | 31.4% |
| More than expected | 65 | 46.4% |
| Much more than expected | 17 | 12.1% |
| Total | 140 | 100% |
Source: own elaboration.
Therefore, it seems that the trade-off between timeto-market (less than one year) and success (greater or much greater than expected) was professionally managed in these companies, which concentrated their efforts on the most productive stages (Cohen et al., 1996). There are positive associations between NPDP activities and their new product success.
4.2 Hypothesis Testing
One way to verify the relationship between the NPDP activities and the new product success, is by the nonparametric Kendall's Tau-c correlation. It is one of the most used coefficients to measure the association of two ordinal variables (Goktas & Isci, 2011). This test has been cited in several business investigations in recent years, such as Antonucci et al. (2020) and Urbanikova et al. (2020). The results indicate that there are positive relationships between the quality in most of the NPDP activities across the different stages and the success of a new product (Table 5). First, all activities performed in the Scoping stage have a weak but positive relationship with the new product success. Thus, these results support hypotheses 1a, 1b, and 1c, respectively. Perhaps, a possible explanation for these results is that a high proportion of companies carried out these activities (mean: 88.4%), and 58.5% of the companies affirm that the success of the new product was much greater than expected. However, this result is not consistent with previous studies made in Peru, which found that companies do not manage their initial stages of NPDP properly, e.g., Seclen-Luna & Lopez-Valladares (2020) and Palomino et al. (2019).
Table 5 Relationship between quality of NPDP activities and New Product Success Kendall´s Tau-c Correlation Coefficient.
| Results: Symmetric measures for 140 valid cases | ||||||
| Stages | Quality of Activities | Aprox. Sig. | Kendall´s τ Correlation Coefficient | Aprox. T a | ||
| 01. Quality of Preliminary Market Assessment | H1a | 0.002 | 0.184 | * | 3.124 | |
| Scoping (H1) | 02. Quality of Preliminary Technical Assessment | H1b | 0.007 | 0.174 | * | 2.689 |
| 03. Quality of Preliminary Financial Assessment | H1c | 0.001 | 0.204 | * | 3.280 | |
| 04. Quality of Market Analysis and Concept Test | H2a | 0.058 | n.s. | 1.896 | ||
| Buid the Business Case (H2) | 05. Quality of Detailed Technical - Operts. Assessment | H2b | 0.000 | 0.241 | * | 1.386 |
| 06. Quality of Legal Assessment | H2c | 0.166 | n.s. | 1.386 | ||
| 07. Quality of Business and Financial Analysis | H2d | 0.097 | n.s. | 1.661 | ||
| 08. Quality of Development of the Prototype | H3a | 0.004 | 0.167 | * | 2.865 | |
| 09. Quality of In-house Prototype Test | H3b | 0.092 | n.s. | 1.685 | ||
| Development (H3) | 10. Quality of Limited Customers Test | H3c | 0.000 | 0.282 | * | 5.044 |
| 11. Quality of Development Manufacturing process | H3d | 0.000 | 0.237 | * | 4.037 | |
| 12.Quality of Updated Financial Analysis | H3e | 0.003 | 0.175 | * | 3.009 | |
| 13. Quality of Market Test | H4a | 0.000 | 0.210 | * | 3.633 | |
| 14. Quality of Continued in-house Prototype Tests | H4b | 0.000 | 0.251 | * | 4.324 | |
| Testing and Validation (H4) | 15. Quality of Operation Trials | H4c | 0.000 | 0.288 | * | 4.923 |
| 16. Quality of Final Financial Analysis | H4d | 0.001 | 0.203 | * | 3.379 | |
| Launch (H5) | 17. Quality of Full Production | H5a | 0.000 | 0.351 | * | 6.443 |
| 18. Quality of Promoted Launch | H5b | 0.080 | n.s. | 1.750 |
a. Use of the asymptotic standard error that assumes the null hypothesis.
τ: Tau-c
* value for p < 0.01
n.s. No significant
Source: own elaboration.
Second, in the Build the business case stage, only the Detailed technical operations assessment is correlated with the new product success. These results only support hypothesis 2b. A possible explanation is that a low proportion of companies carried out activities in this stage (mean: 57.4%) and the only activity carried out in a high proportion of companies was Detailed technical operations assessment (78.7%). In any case, this result is consistent with previous studies such as Cooper (2017) and, particularly, Palomino et al. (2019), who found that Building the business case is usually weak in Peruvian companies. This can lead to a failure to launch new products.
Third, almost all activities carried out in the Development stage have weak but positive relationships with the new product success. That is, the Development of the prototype (0.167*), limited customer test (0.282*), Development of manufacturing process (0.237*), and Updated financial analysis (0.175*) are positively associated with the new product success. This supports hypotheses 3a, 3c, 3d, and 3e, respectively. A possible explanation for this result is that a high proportion of companies (mean: 71.1%) carried out these activities. These results are consistent with previous studies such as Cooper (2017), and Ulrich & Eppinger (2016).
Fourth, all activities carried out by companies in the Testing and validation stage have weak but positive relationships with the new product success. That is, a market test (0.210*), Continued in-house prototype test (0.251*), Operation trials (0.288*), and Final financial analysis (0.203*) are positively associated with the new product success. Thus, these results support hypotheses 4a, 4b, 4c and 4d, respectively, and are consistent with previous studies such as Cooper (2017), Ulrich & Eppinger (2016), and Cooper (2011).
Fifth, in the Launch stage, the full production activity has a low positive relationship. Thus, this result supports hypothesis 5a. A possible explanation is that this activity was carried out by a high proportion of companies (82.3%). In any case, it can be established that the findings are consistent with previous studies such as Cooper (2017) and, particularly, with Palomino et al. (2019), who discovered that in the Launch phase, Peruvian companies often do not make their value proposition clear.
All this evidence does not support the conclusión that would establish the dependence of the new product success on the NPDP activities. Although the correlation analysis is instructive, the hypotheses must be tested through OLogit regressions as another alternative. Ordinal or logistic regression has been used previously in products or services research and in new products research, e.g., Youn and Gu (2010), Jespersen (2012), and De Sousa & Devos (2013). Thus, this research uses Ordinal Regression instead of a Linear Regression such as OLS because it does not fit well with ordinal variables. Also, using a Multinomial logistic regression was discarded because it assumes that categories are nominal, not ordinal. An Ordered Probit regression, similar to Ordinal Regression, could have been used, but the interpretation of the coefficients would have been different (UCLA, 2021). Table 6 shows that there are statistically significant results only for three variables: Quality in Preliminary technical assessment, Quality in Continued in-house prototype tests, and Quality in Full production. These three variables have positive values, which means that a greater probability of success in the new product should be expected if they are performed properly. Thus, the results support hypotheses 1b, 4b, and 5a.
Table 6 OLogit regressions for NPDP Activities and new product success.
| Parameter Estimates | |||||||
| 95% Confidence Interval | |||||||
| Stages | Activities whose quality was measured | Sig. | Coeficient Estimation | Lower Bound | Upper Bound | Desv. Error | |
| 01. Preliminary Market Assesment | H1a | 0.514 | 0.101 | -0.203 | 0.405 | 0.155 | |
| 02. Preliminary Technical Assesment | H1b | 0.022 | 0.333 | 0.047 | 0.619 | 0.146 | |
| 03. Preliminary Financial Assesment | H1c | 0.995 | 0.001 | -0.257 | 0.259 | 0.132 | |
| 05. Detailed Technl.- Operations Assesment | H2b | 0.882 | -0.019 | -0.263 | 0.226 | 0.125 | |
| 08. Development of the Prototype | H3a | 0.198 | -0.151 | -0.380 | 0.079 | 0.117 | |
| 10. Limited Customers Prototype Tests | H3c | 0.116 | 0.164 | -0.040 | 0.368 | 0.104 | |
| 11. Development of Manufacturing Process | H3d | 0.960 | 0.005 | -0.205 | 0.216 | 0.107 | |
| 12. Updated Finantial Analysis | H3e | 0.450 | -0.093 | -0.335 | 0.149 | 0.124 | |
| 13. Market Test | H4a | 0.916 | 0.011 | -0.186 | 0.207 | 0.100 | |
| 14. Continued in-house Prototype Tests | H4b | 0.017 | 0.231 | 0.041 | 0.420 | 0.097 | |
| 15. Operation Trials | H4c | 0.074 | 0.218 | -0.021 | 0.457 | 0.122 | |
| 16. Updated Final Financial Analysis | H4d | 0.419 | 0.095 | -0.136 | 0.327 | 0.118 | |
| 17. Full Production (stocking warehouse) | H5a | 0.002 | 0.401 | 0.144 | 0.658 | 0.131 |
Link function: ordened Logit.
Source: own elaboration.
Furthermore, in the model analysis, Full production (and stocking warehouses) has more impact on the success of the new product (coefficient 0.41) than the execution of the other two statistically significant variables: Preliminary technical assessment (coefficient 0.333) and Continued in-house prototype tests (coefficient 0.231). In other words, the launch stage is the most important through full production activities (Cooper, 2017) when associated activities are tested. Then, the second-best is the evaluation of resources needed to manufacture the new product evaluated in the Preliminary technical assessment (Ulrich & Eppinger, 2016). In third place, the quality of Continued in-house prototype tests based on more information received from potential customers (Cooper, 2017). These results were corroborated by evaluating the model fit using the Goodness-of-fit index (F = 0.500) and the Pseudo R-Square index (0.339), which show the significance of the regression model and a moderate dependency in these relationships.
5. Conclusions
5.1 Theoretical implications
From a theoretical perspective, this study contributes to the theory on innovation processes (Salerno et al., 2015) by reinforcing the assumption that a structured process (Cooper, 2019) is determinant for the success of the new product. In this sense, the study contributes empirically by showing positive relationships between new product development process activities and the success of the new product in a sample of 140 Peruvian manufacturing mid-sized companies. The results show that a high percentage of firms performed many of these activities in the different NPDP stages, especially in the first one (88.4%). This evidence is consistent with previous studies (Liu & Tsai, 2009; Wang et al., 2012). However, under harder scrutiny, the regression análisis reveals that there are statistically significant results only for three activities located in the Scoping, Testing and validation, and Launch stages, as found in previous studies (Cooper, 2017; Palomino et al., 2019). Therefore, most activities-15 out of 18-are not positively associated with the new product success.
Although companies affirm that they perform NPDP activities, probably they are not well structured, and/or not properly performed. In any case, all this unexpected evidence needs further contrast. For instance, the importance of the fuzzy-front end (Scoping and Build the Business Case) mentioned in the literature (Spieth & Joachim, 2017) is not corroborated in the present investigation. It seems that front-end stages in Peruvian companies are not perceived as critical (Seclen-Luna & Lopez-Valladares, 2020), as many scholars have pointed out in developed countries (Dziallas, 2020).
5.2 Practical implications
In a broad sense, despite NPDP activities could have a positive relationship with the success of a new product, it differs depending on the structure of their process and its management (Seclen-Luna & Ponce-Regalado, 2020). However, other additional factors may affect the process (Droge, Calantone & Harmancioglu, 2008) such as Listening to the Voice of the Customer (VoC). It is a very important input to develop a product that costs so much in terms of time and money (Melander, 2020). It is noteworthy that the findings in this research do not coincide with previous research regarding the importance of marketing activities at any stage. One of the practical implications of the present research could be that it is not necessary to listen to the VoC for the new product to succeed if it is not very different from the previous. Participants answered that only 11% of the developed products were quite different from those that had been produced and launched by the company before. Thus, there would not be a greater need to listen to the VoC if the new product has already been approved by the market. Another reason is that 55% of the ideas of the new product come from a single source, in 36% of cases from the CEO or the Board, and in some companies this could not be questioned. This is reinforced by the fact that 45% of new ideas are approved informally, not in a written document, and only 3% of the ideas come from a strategic plan. An additional reason could be how expensive it is for medium-sized companies in developing countries to conduct quality market research. It is not the case for large companies in developed countries with greater availability of resources. These companies have been previously investigated and have given rise to the reviewed publications.
Finally, the findings may be of interest to policymakers to promote innovation management among enterprises in an emerging country.
5.3 Limitations and future research.
This study of the New Product Development Process has limitations that could be overcome in future research. First, the number of observations does not allow reaching conclusions about all the manufacturing industry, but only for a sample of medium-sized manufacturing companies established in the cities of Lima and Callao, Peru. Second, due to the timeline of the survey, which is cross-sectional, the study does not assess the dynamics of the process, so future studies should focus on this issue. Third, because there may be other factors that have not been included in the model, future research should corroborate the results in specific contexts, such as the service sector and at regional levels in a country. Finally, other approaches can be useful to analyze the new product development process in future research, such as the New Product Development Ability (Panizzon, Milan, Dorion, & Munhoz Olea, 2021) or hybrid approaches (Gomes et al., 2022).

