


 English (pdf)
 Article in xml format
 Article references
 Send this article by e-mail
 Cited by SciELO
  Cited by Google
  Similars in
SciELO
Similars in
SciELO  Similars in Google
 Permalink
1. Introduction
Since the seminal works of Modigliani and Miller (1958, 1963), the capital structure decision has been extensively studied in modern corporate finance. Its relevance lies in the implications it has on the firms’ value. Firms’ quality, as well as information asymmetries, agency costs or tax advantages attributable to debt, are determinant factors to make the capital structure choice.
In the literature, several theories that explain the corporate capital structure decision can be found. Two of the main theoretical contributions are the trade-off and pecking order theories. The first one indicates that firms decide their capital structure by balancing bankruptcy costs (Bradley, Jarrell, & Kim, 1984), tax incentives, and corporate control over agency conflicts (Jensen & Mecking, 1976). It suggests the existence of a target capital structure to which firms partially adjust. The latter predicts that firms establish the capital structure by selecting their financing in a hierarchical way based on the costs of information asymmetries (Myers, 1984; Myers & Majluf, 1984). The empirical discussion on this issue is still open in both developed and emerging markets, and without a clear consensus as to which theory best predicts the capital structure decision (De Jong, Verbeek & Verwijmeren, 2011; Dang, Kim & Shin, 2012; Dang, 2013; Serrasqueiro & Caetano, 2015; Jarallah, Saleh & Salim, 2019; Agyei, Sun & Abrokwah, 2020). More recent studies have analyzed both approaches together and have concluded that they are not exclusive and their dynamic behaviors would affect the capital structure adjustment (Dang, 2013; Kannadhasan, Singh, Gupta & Charan, 2018).
This analysis has become relevant for firms, investors, and policy makers in Latin American markets due to the scarce empirical literature. De Gregorio, Garcia, and Jara-Bertin (2017) warned that after the subprime crisis, Latin American firms significantly increased their level of corporate debt. This implied changes in capital structures and debt adjustment mechanisms that have not been investigated in firms in the region. It is still necessary to analyze whether the target capital structure of Latin American firms is dynamic and depends on adjustment costs. This would have significant effects on the way firms adjust their financing structure. Therefore, our research addresses these empirical gaps and analyzes the capital structure decision of Latin American firms based on the trade-off and pecking order theories. The empirical contributions of this research can be summarized in two points. First, we separately and jointly analyzed the trade-off and pecking order theories in determining the capital structure of Latin American firms. At this point, we evaluated the speed of adjustment of the capital structure and the explanatory power of the financial deficit (surplus) in the leverage change. Second, through GMM estimators for dynamic panel data, we used the error correction model (ECM) to evaluate the speed of adjustment of the firms’ capital structure for both theories. The specific objective was to verify that the target capital structure is dynamic and depends on adjustment costs, as well as its potential impact on the convergence of leverage mechanism towards its target level.
We used a panel data for 975 non-financial firms for the period 2000-2017. The estimates were based on the GMM, and GMM-SYS methods proposed by Arellano and Bond (1991) and Arellano and Bover (1995), respectively. Our results support the existence of a target capital structure and reveal that Latin American firms adjust their indebtedness in accordance with the trade-off theory. Adjustment speeds ranged from 48.9% to 74.3%, indicating a rapid convergence of leverage towards its target level. On the other hand, financial deficits (surplus) explained less than half of the debt change, which clearly contradicts the pecking order theory. The results of the ECM showed that convergence speeds in the partial adjustment model increased to a range from 69.5% to 91.7%, and also indicated that firms dynamically deviate from their long-term capital structure. These results are relevant for firms and investors due to their implications in investment and financing decisions; as well as for policy makers, since they guide the design of regulations aimed at strengthening the cost-benefit relationship of corporate debt.
This article is structured as follows: Section 2 presents a literature review on the trade-off and pecking order theories; Section 3 presents the data and analysis methodologies; Section 4 shows the results obtained; and Section 5 groups together the conclusions and implications of this research.
2. Literature review
2.1 The trade-off and pecking order theories
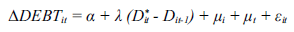
The trade-off theory is one of the most discussed approaches in modern corporate finance. According to it, firms determine their capital structure by balancing the benefits and costs of debt. On the benefits side, leverage reduces agency costs associated with asset substitution (Jensen & Meckling, 1976) and generates tax advantages that increase the firm value (Modigliani & Miller, 1963). On the cost side, indebtedness increases bankruptcy costs and liquidity risk (Jensen & Meckling, 1976; Bradley et al., 1984). The trade-off between these costs and benefits establishes an optimal capital structure in which firms adjust over time and maximize their market value. According to previous studies, the representation of the partial adjustment model is:
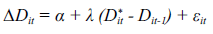 (1)
(1)
 (2)
(2)
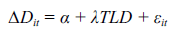
Where ΔD it is the variation in current leverage and D it * represents the target debt level. We define TLD=(D it * - D it-1 ) as the deviation of the capital structure at t-1 from the target leverage, while Ɛ it is the error term. The parameter λ represents the speed of adjustment between the current capital structure change and the desired target change. The trade-off model predicts that in the absence of adjustment costs, firms will instantly adjust their capital structure to their target level, so the adjustment speed will be λ = 1. However, the presence of adjustment costs makes this speed lower (between 0 and 1), validating the trade-off predictions when α=0 and λ>0.3 (Dang, 2013; Kannadhasan et al., 2018).
The international empirical evidence that has evaluated the partial adjustment model has not been conclusive, and the results vary for different markets. The North American market has been the most studied in this matter. Fama and French (2002) concluded that the partial adjustment model predictions are not fulfilled in US firms because the speed of adjustment of the capital structure towards its target leverage is low and fluctuates between 7% and 18% of the desired change. Other studies also support these conclusions and warn that the convergence mechanism describes a speed between 17% and 25% for this market (Lemmon, Roberts & Zender, 2008; Huang & Ritter, 2009). However, Leary and Roberts (2005) provided favorable evidence for the trade-off theory and showed that US firms adjust their capital structure based on bankruptcy costs and the inherent tax benefits. Even Flannery and Rangan (2006), in a later study, found favorable evidence for this approach because the parameter λ registered speeds greater than 30% per year. More recently, Dang and Garrett (2015), in a study carried out for US firms between 1971 and 2003, concluded that the adjustment of the capital structure towards its target level was rapid, especially when they were above said level. Nunkoo and Boateng (2010) analyzed 7,098 Canadian firms between 1996 and 2004, and their results demonstrated the existence of a target capital structure. However, the adjustment towards target leverage was slow.
For European markets and emerging countries, the results have not been conclusive either. Ozkan (2001) analyzed the partial adjustment model in UK firms. His findings were favorable to the trade-off approach because he detected a high speed of convergence (greater than 50%). Antoniou, Guney, and Paudyal (2008) also supported these conclusions for German and French firms. Gonzalez and Gonzalez (2012) analyzed 3,439 Spanish firms for the period 1995-2003. Their results partially demonstrated the validity of the trade-off theory in the capital structure decision. Although their results did not reveal relevant differences in the adjustment speeds of large and small firms, some qualities of the firms had effects on leverage consistent with the pecking order theory. Cabrer and Rico (2015) agreed that the speed of adjustment for Spanish companies was low and close to 12% in relation to the target leverage. The discussion on emerging markets has been somewhat more limited. Zeitun, Temimi, and Mimouni (2017) carried out a study of 270 firms belonging to six countries of the Gulf Cooperation Council (GCC) for the period 2003-2013. Their results suggest that firms in these countries determine their capital structure according to the trade-off approach. However, after the subprime crisis, the speed of adjustment slowed significantly. Nguyen, Ho and Vo (2019) studied the case of Vietnamese firms between 2008 and 2017 and found favorable evidence of trade-off with speeds above 70%.
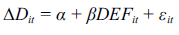
The pecking order theory formulated by Myers (1984) and Myers and Majluf (1984) offers a different point of view on the choice of the firm’s capital structure since it is not based on a target financing structure. This theory holds that in a context of information asymmetry, firms’ insiders have better information about the value of assets in relation to external investors. Faced with this situation, firms with lower credit quality will have incentives to issue overvalued securities, generating an adverse selection problem for investors. Moreover, firms with higher credit quality will prefer to issue securities with lower levels of risk and information asymmetries for investors to demonstrate their quality. This would lead them to prefer internal financing in the first instance, then debt, and finally equity. Shyam-Sunders and Myers (1999) proposed a widely used model to test this:
 (3)
(3)
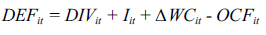
Where ΔD it is the variation of the current leverage (issued or retired) of firm i in period t, and Ɛ it is the stochastic error of the model. DEF it is the financial deficit of firm i at time t, which is calculated as follows:
 (4)
(4)
Where DIV it is the dividend payment, Iit is the net investment in fixed assets, ΔWC it is the net working capital change, and OCF it is the operating cash flow, all for firm i at time t. Shyam-Sunder and Myers (1999) stated that this theory is valid if α=0 and the pecking order adjustment parameter is β=1, with which a firm adjusts its capital structure according to its spontaneous financing needs. Normally, this theory emphasizes the role of information asymmetry as a determinant of the adverse selection problem for investors and that ultimately defines the firms’ capital structure. Therefore, if the degree of information asymmetry is less, the pecking order theory loses predictive power on the arbitrations that determine the firms’ capital structure.
The empirical evidence that has evaluated the pecking order theory has also been deficient and has not provided a clear explanation of the differences in capital structure between different markets, both developed and emerging. Frank and Goyal (2003) analyzed US firms, and their results were also inconclusive. Seifert and Gonenc (2008) analyzed firms from the United States, United Kingdom, and Germany and found little significant evidence in favor of the pecking order theory. Lemmon and Zender (2010) warned that, if this theory considers the debt capacity of firms, its predictions are more accurate in relation to the capital structure decision. In another study, De Jong, Verbeek and Verwijmeren (2010) analyzed 22,197 US firms between 1971 and 2005 and found that the validity of the pecking order theory depends on the magnitude of financial deficits (surplus). Their estimates held that firms with financial surpluses and normal deficits register an adjustment parameter equal to 0.90 and 0.74, respectively, in which case the pecking order theory tends to explain the capital structure decision of these firms. However, this theory would not be fulfilled in firms with high financial deficits since its parameter was 0.09. Studies that contribute to the analysis of this approach have also been carried out in other developed countries. Noulas and Genimakis (2011) studied 259 Greek firms between 1998 and 2006 and concluded that they choose their capital structure according to the pecking order theory. Dong, Loncarski, Horst and Veld (2012) reached the same conclusion in a study of Canadian firms. More recently, Jarallah et al. (2019) analyzed 1,362 Japanese companies between 1991 and 2015 and using GMM techniques they concluded that corporate debt issuances corresponded to the internal financial deficits of the firms. Therefore, the pecking order would explain the financing of these firms.
The pecking order theory has also been studied in emerging markets. Seifert and Gonenc (2010) studied companies from 23 emerging countries between 1985 and 2004. Their results showed that the pecking order theory was not fulfilled, despite the greater information asymmetries in these countries. Chakraborty (2013) studied 92 Indian firms between 2002 and 2010, and their results showed little support for the pecking order theory, even in small firms characterized by greater information asymmetries. Along the same lines, Chen, Chen, Chen, and Huang (2013) warned that the pecking order theory was not fulfilled in Taiwanese firms either because they financed their financial deficits with equity. These results were contrary to those of Chang, Su, Weng, and Chen (2010), who in another study carried out on Taiwanese firms between 1990 and 2007, provided evidence favorable to the pecking order theory and even added that this behavior would be maintained during periods of financial stress. Other recent studies offered more favorable results for this theory. Bhama, Jain, and Yadav (2017) analyzed 405 Indian firms and 312 Chinese firms between 2003 and 2014 and obtained favorable results for the pecking order theory. However, the Authors warned that the validity of this approach depends on the size of the deficit (surplus) and the industry. Yildirim and Celik (2020) also showed that the pecking order theory is fulfilled in general terms in a sample of Turkish firms studied between 2000 and 2018. The authors indicated that in firms with low or high leverage the pecking order approach is not fulfilled, as financial deficits tend to be financed with internal funds or equity, respectively. Nguyen, Vuong, Nguyen, Wu, and Wong (2020) examined both theories in Chinese manufacturing companies using a panel data from 2001 to 2018. They pointed out that the financing decisions of listed Chinese companies in the manufacturing sector can be best explained by the pecking order theory.
2.2 Which theory best predicts the capital structure decision?
Several empirical studies have tried to evaluate which of these theories best explains the capital structure decision. Joint evidence remains varied and inconclusive, as do the evaluations of each approach (Zhou, Tan, Faff & Zhu, 2016; Allini, Rakha, McMillan & Caldarelli, 2017). Watson and Wilson (2002) developed a model capable of evaluating both theories together, which was applied to a sample of 2,581 small and medium-sized companies in the United Kingdom. Their results were consistent with the pecking order theory, and the authors argued that this result was more evident in firms with greater information asymmetries and agency conflicts. In contrast, Dang (2013) argued that the capital structure of UK firms was better explained by the trade-off rather than by the pecking order theory.
Other studies have found mixed results in different markets. De Jong et al. (2011) analyzed the case of US companies and found that the pecking order theory was a better predictor of capital structure compared to the trade-off approach. However, they cautioned that when firms repurchased shares, the capital structure was guided by the trade-off theory. Gonzalez and Gonzalez (2012) also found mixed results for Spanish firms. Serrasqueiro and Caetano (2015) analyzed 53 Portuguese SMEs for the period 1998-2005. They used a leverage model that incorporated control variables associated with firms’ characteristics and concluded that both theories were fulfilled and were not exclusive. Similar conclusions were obtained for emerging markets. Yang, Chueh, and Lee (2014) studied Taiwanese firms and showed that the existence of a target capital structure was consistent with the trade-off approach. However, firms characterized by high information asymmetries exhibited an adverse selection cost that guided their capital structure through the pecking order theory. In other study, Rodrigues, Moura, Santos, and Sobreiro (2017) analyzed 1,091 US and Latin American companies between 2009 and 2013 and concluded that Latin American firms adjusted their capital structure through pecking order, while US firms were guided by trade-off.
Some studies have used the econometric ECM in the partial adjustment and pecking order models to evaluate both theories, separately or together. This is because ECM has significant advantages over other traditional estimation methods. On the trade-off side, it allows us to assume that the target capital structure is also dynamic and is not independent of adjustment costs. This implies that the speed of adjustment of the capital structure not only depends on the distance between the current and target leverage, but also on the speed of adjustment of the target structure (Byoun, 2008). In this way, ECM extends the partial adjustment model by explicitly modeling the changes in target leverage and past deviations from this target as determinants of the dynamic process of adjusting companies’ leverage. On the pecking order side, this method would assume a different response from the financial deficit (surplus) when the actual capital structure is closer to or further from the target leverage. Through this method, Dang (2013) analyzed firms from the United Kingdom, France, and Germany and concluded that the capital structure decision of these firms was explained by the trade-off theory. The author also showed that the speed of adjustment increased by more than 30% with the ECM method in relation to the partial adjustment model, confirming that the target capital structure of these companies was dynamically dependent on the adjustment costs. The author also noted that the pecking order parameter was practically unchanged. More recently, Kannadhasan et al. (2018) used this method to study 1,183 firms from China, India, and South Africa between 1999 and 2016. The authors found that the trade-off better explained the behavior of the capital structure of these companies compared to the pecking order. They also observed a significant increase in the speed of adjustment through the ECM method.
In Latin American markets, there are few empirical studies that have analyzed the trade-off and pecking order theories as determinants of capital structure. Mongrut, Fuenzalida, Pezo, and Teply (2012) analyzed a sample of firms from Argentina, Brazil, Chile, Mexico, and Peru. They demonstrated the validity of the trade-off and discarded the pecking order as determinant of the corporate debt decision. Other studies have also agreed with this conclusión from the empirical point of view (Huertas, 2018; Ramirez, Armas, Rios, Sotelo & Bustamante, 2019). De Oliveira, Bambino and Da Silva (2019), in an analysis applied to Latin American firms, describe that the incidence of cash flow on indebtedness is consistent with the trade-off approach. However, Gutierrez, Moran and Posas (2019) stated that the pecking order had better explanatory power than the tradeoff in Ecuadorian firms. The authors argued that this was due to the role of information asymmetries in the analyzed market. Similar results were found in Brazilian firms (De Medeiros & Daher, 2004; Correa, Basso & Nakamura, 2013). Other studies present mixed results that depend directly on the productive sector of the analyzed companies (Virgen & Rivera, 2012; Medina, Salinas, Ochoa & Molina, 2014; Cabanilla & Sanchez, 2021). Apart from this little evidence, there are no studies that use the ECM method to evaluate the behavior and adjustment mechanisms of financing structure. This aspect defines the novelty of this research, whose potential implications could be relevant for companies, investors, and policy makers, particularly to understand the significant increase in corporate debt in these markets after the subprime crisis pointed out by De Gregorio et al. (2017), and how firms decided on a capital structure.
3. Data and methods
3.1 Data
The data corresponded to 975 non-financial companies belonging to the markets of Argentina, Brazil, Chile, Colombia, Peru, and Mexico. The information was extracted from the EconomaticaR database for the period 2000-2017. Institutional and financial development characteristics were obtained from the World Bank. The information was organized in an unbalanced panel composed of 5,194 firm-year observations. Table 1 presents the conceptual description of the variables.
Table 1 Variables.
| Variable | Name | Description |
|---|---|---|
| Dependent variable | ||
| DEBT | Debt level | Total debt to total assets ratio at market and book value |
| ΔDEBT | Debt change | Annual change in book debt to total debt ratio |
| Financial policy | ||
| DEF | Financial deficit | Deficit according to Equation (4) |
| Institutional environment variables | ||
| IE1 | Control of corruption | Control of corruption index |
| IE2 | Government effectiveness | Government effectiveness index |
| IE3 | Political stability | Political stability index |
| IEPP | Public-politic development | Average of control of corruption, government effectiveness and political stability indexes |
| IE4 | Regulation of quality | Quality of regulation index |
| IE5 | Rule of law | Rule of law index |
| IE6 | Accountability | Accountability index |
| IEPR | Private-regulatory development | Average of quality of regulation, rule of law and accountability indexes |
| Financial development variables | ||
| BOND | Bond market development | Bond issues to GDP ratio |
| STOCK | Stock market development | Stock market capitalization to GDP ratio |
| BANK | Bank market development | Bank credit to GDP ratio |
| PENS | Pension fund | Pension fund to GDP ratio |
| AFD | Average financial development | Average of financial development ratios |
| Firms’ qualities | ||
| OWN | Controlling-shareholder | Percentage of stock of the controlling shareholder |
| FPROF | Firm profitability | Net income to total assets ratio |
| FCRED | Firm credit quality | Credit quality measured by Altman’s Z-Score |
| GROP | Growth opportunities | Tobin’ Q ratio |
| SIZE | Firm size | Natural logarithm of total assets |
| TANG | Assets tangibility | Long-term assets to total assets ratio |
| ACST | Agency costs | Assets turnover ratio |
| NDTS | Non-debt tax shields | Depreciation to total assets ratio |
Notes: Information extracted from EconomaticaR and the World Bank.
Source: own elaboration.
The dependent variable of this research was the leverage change (ΔDEBT), measured as the annual change in the debt-to-assets ratio. The debt was measured at market value using the same ratio, and assets corresponded to the sum of the market value of equity and the book value of debt. For the robustness analysis, debt was also measured by the debt-to-assets ratio, all of them at book value.
To estimate the partial adjustment model with which the trade-off approach was evaluated, some qualities of the firms and systematic variables at the country level were used as controls for the target leverage (D*). Among the firms’ characteristics, the controlling shareholder ownership (OWN), firm profitability (FPROF), firm credit quality (FCRED), growth opportunities (GROP), firm size (SIZE), assets tangibility (TANG), agency costs (ACST), and non-debt tax shields (NDTS) were used. These variables have been suggested by previous studies (DeAngelo & Masulis, 1980; Titman & Wessels, 1988; Rajan & Zingales, 1995; Cespedes, Gonzalez & Molina, 2010; Dang et al., 2012; Dang, 2013; Serrasqueiro & Caetano, 2015; Rodrigues et al., 2017; Kannadhasan et al., 2018; Vasquez & Lamothe, 2018). At the country level, control variables were used. According to various studies, they quantify institutional development in the public-political (IEPP), private-regulatory (IEPR), and financial development (AFD) spheres (Zeitun et al., 2017; Kannadhasan et al., 2018).
To evaluate the pecking order theory, we used the firm’s financial deficit (surplus) as a control variable, which is denoted by DEF and calculated according to Equation (4). This variable was rescaled by total assets and has been suggested by previous empirical evidence (Frank & Goyal, 2003; Shyam-Sunders & Myers, 1999; De Jong et al., 2010; Dang, 2013; Serrasqueiro & Caetano, 2015; Kannadhasan et al., 2018; Jarallah et al., 2019).
3.2 Econometric methodology
The econometric analysis was structured according to the capital structure approaches. First, we estimated the partial adjustment model to analyze the trade-off approach in the capital structure of Latin American firms. The empirical model was:
 (5)
(5)
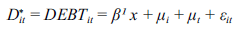
Where ΔDEBTit is the change in the market debt to total assets ratio, (Dit*- Dit-1) is the deviation of the capital structure in t-1 with respect to the target capital structure Dit*, and Ɛit is the random residual of the model. The parameter λ represents the speed of adjustment of the current capital structure towards its desired change. Model (5) was estimated using the GMM and GMM-SYS methods proposed by Arellano and Bond (1991) and Arellano and Bover (1995), respectively. The lags in t-2 and t-3 were used as instruments to correct the endogeneity problem caused by the lag of the dependent variable ΔDEBTit-1. This model included individual fixed effects (μi) associated with firm I and time effects (μt) associated with period t. On the other hand, the target capital structure Dit* was calculated from a prediction of the following model:
 (6)
(6)
Where Dit* is the market debt-to-assets ratio (DEBTit) that represents the target leverage of firm i in period t. According to previous studies, the matrix x includes the control variables associated with the firms’ qualities and the institutional and financial characteristics of the countries (Titman & Wessels, 1988; Rajan & Zingales, 1995; Dang, 2013; Kannadhasan et al., 2018). Then, the expression (6) can be rewritten as:
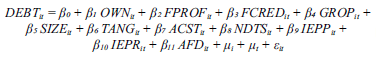 (7)
(7)
Where DEBTit is the market debt-to-assets ratio of firm i in period t. The model included the controlling shareholder ownership (OWNit), firm profitability (FPROFit), firm credit quality (FCREDit), growth opportunities (GROPit), firm size (SIZEit), asset tangibility (TANGit), agency costs (ACSTit), and non-debt tax shields (NDTSit) as control variables of firm I in period t. The average public-political institutional development (IEPPjt), the average of the private-regulatory institutional development (IEPRjt), and the average development of the financial markets as a percentage of GDP, denoted as (AFDjt), were included as control variables for country j in period t. This model was estimated using the fixed effects method, which includes individual fixed effects (μi) associated with firm i and temporary effects (μt) associated with period t. Finally, Ɛit is the random residual.
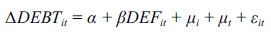
Second, we used the following model to analyze the pecking order approach:
 (8)
(8)
Where ΔDEBTit is the dependent variable measured by the change in the market debt-to-assets ratio of firm i at time t, while the DEFit variable is the financial deficit calculated according to Equation (4). According to Shyam-Sunder and Myers (1999), the pecking order theory is valid if α=0 and β=1. Then, firms would adjust their capital structure according to their spontaneous financing needs. Model (8) is a static specification that was estimated through the fixed effects method, which includes individual effects (μi) associated with firm i and temporary effects (μt) associated with period t. Finally, Ɛit is the random residual of the model.
Third, we estimated the augmented partial adjustment model. This model allows us to simultaneously evaluate the trade-off and pecking order theories and to analyze the possible predominance of one approach over the other. The empirical model was:
 (9)
(9)
Where ΔDEBTit is the dependent variable measured by the change in the market debt-to-assets ratio of firm i at time t. The variables (Dit*-Dit-1) and DEFit are defined in the same way as in models (5) and (8), respectively. If α=0 and β=1, the pecking order theory explains the adjustment of the capital structure better than the tradeoff theory, especially if λ is close to 0. However, if λ>0.3 and β is significantly less than 1, the trade-off theory is better. Model (9) was estimated using the GMM and GMMSYS methods suggested by Arellano and Bond (1991) and Arellano and Bover (1995), respectively. This model included the lag of the dependent variable ΔDEBTit-1, as well as the individual fixed effects (μi) associated with firm i and time effects (μt) associated with period t. Furthermore, the endogeneity problem caused by the lag of the dependent variable was corrected by using lags in t-2 and t-3 as instruments.
Finally, models (5), (8), and (9) were re-estimated using the ECM. To do so, we included the variable LECM=(Dit-1*-Dit-1), which measures the deviation of the actual leverage from the target leverage in period t-1, and the variable TLC=(Dit*-Dit-1* ) as the change in target leverage over time. Including these deviations makes it possible to evaluate the dynamics of both theories, particularly when incorporating a target capital structure that depends on adjustment costs and causes the speed of convergence to vary over time. Adjustment costs can typically be lower if leverage approaches its target level. Furthermore, this would imply that the capital structure adjustment could be greater the further it is from the target (Byoun, 2008). Then, the models to estimate by ECM were:
 (10)
(10)
 (11)
(11)
For the augmented partial adjustment model indicated in (11), the pecking order is fulfilled if α=0, β=1, λ=0, and γ=0. Otherwise, the trade-off explains the capital structure. Models (10) and (11) were estimated using the GMM and GMM-SYS methods suggested by Arellano and Bond (1991) and Arellano and Bover (1995), respectively. These models included the lag of the dependent variable ΔDEBTit-1 as well as the individual fixed effects (μi) associated with firm i and time effects (μt) associated with period t. Furthermore, the endogeneity problem caused by the lag of the dependent variable was corrected by using lags in t-2 and t-3 as instruments.
All estimated models used robust variances to control possible heteroskedasticity patterns and included dummy variables to control heterogeneity by economic sector.
4. Empirical results
4.1 Data description
Table 2 presents the statistical description of the variables. The capital structure (DEBT) of Latin American firms revealed that 41.23% and 48.16% of their assets are financed through debt at market and book value, respectively. Brazilian and Chilean firms stood out for having capital structures with higher indebtedness compared to the regional average.
Table 2 Statistical summary
| Argentina | Brazil | Chile | Colombia | Mexico | Peru | Full Sample | ||||||||
| 69 firms | 428 firms | 221 firms | 27 firms | 111 firms | 119 firms | 975 firms | ||||||||
| 342 obs. | 2228 obs. | 1187 obs. | 145 obs. | 618 obs. | 674 obs. | 5194 obs. | ||||||||
| Variables | Mean | S.D. | Mean | S.D. | Mean | S.D. | Mean | S.D. | Mean | S.D. | Mean | S.D. | Mean | S.D. |
| Dependent variable | ||||||||||||||
| DEBT, market (%) | 31.47 | 37.29 | 45.02 | 25.65 | 42.26 | 38.07 | 32.73 | 23.51 | 41.68 | 29.52 | 36.21 | 23.03 | 41.23 | 27.66 |
| DEBT, book (%) | 36.85 | 34.74 | 52.36 | 20.83 | 49.02 | 42.18 | 39.11 | 19.26 | 47.50 | 32.77 | 40.85 | 17.64 | 48.16 | 28.45 |
| Financial policy | ||||||||||||||
| DEF | 0.58 | 0.41 | 0.66 | 0.47 | 0.29 | 0.35 | 0.18 | 0.24 | 0.35 | 0.31 | 0.21 | 0.36 | 0.39 | 0.33 |
| Firms-level qualities as leverage determinants | ||||||||||||||
| OWN (%) | 64.64 | 16.60 | 47.29 | 27.74 | 45.52 | 21.85 | 42.37 | 19.25 | 47.04 | 23.39 | 56.24 | 31.08 | 48.59 | 26.57 |
| FPROF (%) | 1.92 | 7.44 | 6.89 | 17.63 | 4.20 | 10.32 | 5.49 | 15.37 | 4.03 | 12.21 | 5.43 | 7.37 | 4.65 | 11.36 |
| FCRED | 29.11 | 79.19 | 10.73 | 22.47 | 59.50 | 41.12 | 22.52 | 28.31 | 21.43 | 52.17 | 46.98 | 31.02 | 33.29 | 27.94 |
| GROP | 2.35 | 5.54 | 2.40 | 23.80 | 2.17 | 6.98 | 1.17 | 0.81 | 2.32 | 2.29 | 1.73 | 2.00 | 2.47 | 12.21 |
| SIZE | 19.31 | 1.49 | 20.32 | 2.01 | 19.77 | 1.95 | 20.56 | 1.57 | 21.25 | 1.48 | 19.11 | 1.62 | 20.04 | 1.95 |
| TANG (%) | 57.70 | 24.26 | 61.89 | 25.79 | 65.16 | 22.07 | 69.68 | 13.04 | 63.84 | 20.16 | 65.42 | 19.68 | 61.53 | 22.85 |
| ACST | 1.74 | 0.61 | 2.63 | 0.51 | 3.63 | 2.48 | 1.97 | 1.49 | 2.36 | 2.47 | 2.63 | 2.45 | 2.64 | 2.52 |
| NDTS (%) | 3.22 | 2.51 | 2.77 | 3.56 | 2.29 | 2.16 | 3.03 | 1.79 | 3.10 | 2.25 | 2.44 | 2.01 | 2.93 | 2.41 |
| Institutional-financial qualities as leverage determinants | ||||||||||||||
| IEPP | -0.13 | 0.10 | -0.12 | 0.13 | 1.05 | 0.08 | -0.52 | 0.08 | -0.43 | 0.06 | -0.48 | 0.08 | 0.14 | 0.59 |
| IEPR | -0.33 | 0.15 | 0.12 | 0.07 | 1.28 | 0.04 | 0.01 | 0.08 | -0.04 | 0.04 | -0.03 | 0.09 | 0.40 | 0.55 |
| AFD (%) | 7.71 | 0.43 | 29.19 | 5.69 | 64.20 | 8.23 | 30.63 | 4.34 | 21.74 | 0.38 | 21.73 | 3.89 | 37.73 | 18.32 |
Source: own elaboration.
The ownership structure of Latin American firms revealed its high concentration. The controlling shareholder (OWN) concentrated 48.59% of the ownership. Argentine (64.64%) and Peruvian (56.24%) firms registered the highest concentration levels. These figures coincide with the markets that register lower averages for financial and institutional development, which corroborates that investors concentrate ownership in markets whose institutional or financial qualities offer a weak protection for their rights.
Regarding asset investments (TANG), 61.53% of the firm’s assets corresponded to long-term investments, while the average tax shield indicated a depreciation to total assets ratio of 2.93%. On the other hand, the average profitability of firms (FPROF) registered a return of 4.65% on assets, which is consistent with a Tobin's Q of 2.47 as growth opportunities measure (GROP). The credit quality of firms (FCRED) measured by the Z-Score was 33.29 on average; therefore, their future bankruptcy probability is significantly low.
The institutional environment and financial development had a heterogeneous behavior among countries. On the one hand, the public-political (IEPP) and private-regulatory (IEPR) institutional environment obtained averages close to 0. Even countries such as Brazil, Argentina, Colombia, Mexico, and Peru had some negative records that show institutional weaknesses. Corruption problems in public institutions, political instability, weak regulations, fragile protection of investors’ rights or lack of transparency are some examples that describe the institutional environment of these countries. Chile has the highest institutional development in Latin America, both in the public-political and private-regulatory spheres. Moreover, the financial development (AFD) that measures the average penetration of the markets of bonds, stocks, pension funds, and banks amounted to 37.73% of the GDP. The average figures for the different countries were heterogeneous and revealed that Chile has the highest financial development.
4.2. Determinants of the target capital structure.
Table 3 presents the results of model (7) that determine the target capital structure for Latin American firms. Model (7) was estimated using the fixed effects method. The significance of the Hausman test indicated that the fixed effects estimator (within) offers better estimators than the random effects method. Likewise, the model included dummy variables to control temporary effects and differences between productive sectors.
Table 3 Fixed-effects panel data regression for target market debt level.
| Expected sign | Dependent variable: Market debt to total assets ratio as debt target | |||||||
| TOT | POT | Argentina | Brazil | Chile | Colombia | Mexico | Peru | |
| Constant | -1.2943** | -0.7496*** | -1.1165** | -1.2641** | -1.3391** | -1.6931*** | ||
| (-2.45) | (-2.61) | (-2.36) | (-2.57) | (-2.33) | (-3.02) | |||
| Firms-level qualities as leverage determinants | ||||||||
| OWN | - | + | -0.1831*** | -0.2637*** | -0.0349 | -0.1313** | -0.4461*** | -0.1479*** |
| (-3.94) | (-4.15) | (-1.23) | (-2.54) | (-5.07) | (-3.36) | |||
| FPROF | + | - | -0.4982*** | -0.3028*** | -0.4169*** | -0.2298*** | -0.3475*** | -0.5716*** |
| (-3.67) | (-5.23) | (-4.70) | (-3.75) | (-3.31) | (-4.02) | |||
| FCRED | + | - | 0.0058*** | 0.0080*** | 0.0064*** | 0.0073*** | 0.0042** | 0.0069*** |
| (3.02) | (4.18) | (3.32) | (3.56) | (2.51) | (2.83) | |||
| GROP | - | + | -0.0614*** | -0.0038 | -0.0557*** | -0.0081 | -0.0342*** | -0.0211* |
| (-4.21) | (-0.69) | (-3.98) | (-0.93) | (-4.85) | (-1.90) | |||
| SIZE | + | - | -0.0481*** | -0.0792*** | -0.0546*** | -0.0096 | -0.0142 | -0.0829*** |
| (-3.44) | (-3.63) | (-4.27) | (-0.88) | (-1.19) | (-4.61) | |||
| TANG | + | - | 0.1211*** | 0.4382*** | 0.2015*** | 0.0413 | 0.3684*** | 0.5172*** |
| (3.10) | (4.02) | (3.89) | (1.43) | (4.21) | (3.26) | |||
| ACST | + | - | 0.0417*** | 0.0941*** | 0.0733*** | 0.1283*** | 0.1053*** | 0.0604*** |
| (3.19) | (4.04) | (3.15) | (3.97) | (4.16) | (3.81) | |||
| NDTS | - | -0.0069 | -0.6284*** | -0.3683*** | -0.0526** | -0.5517*** | -0.4381*** | |
| (-0.93) | (-4.02) | (-3.89) | (-1.99) | (-4.61) | (-5.24) | |||
| Institutional-financial qualities as leverage determinants | ||||||||
| IEPP | + | + | 0.2562** | 0.1783* | 0.3162*** | 0.2589** | 0.3934*** | 0.2901*** |
| (1.99) | (1.75) | (2.74) | (2.26) | (3.14) | (2.59) | |||
| IEPR | + | + | 0.5631*** | 0.4129*** | 0.4819*** | 0.5215*** | 0.6104*** | 0.4493*** |
| (3.13) | (3.68) | (3.52) | (4.08) | (4.26) | (3.75) | |||
| AFD | + | + | 0.0134*** | 0.0253*** | 0.0139*** | 0.0351*** | 0.0228*** | 0.0135*** |
| (3.28) | (4.82) | (3.75) | (4.27) | (3.51) | (4.11) | |||
| Observations | 342 | 2228 | 1187 | 145 | 618 | 674 | ||
| Hausman test | 49.60*** | 195.20*** | 106.94*** | 36.15*** | 57.51*** | 76.29*** | ||
| Time effects | Yes | Yes | Yes | Yes | Yes | Yes | ||
| Individual effects | Yes | Yes | Yes | Yes | Yes | Yes | ||
| Dummy sector | Yes | Yes | Yes | Yes | Yes | Yes | ||
| Robust variance | Yes | Yes | Yes | Yes | Yes | Yes |
Notes: Fixed-effects correspond to F-test for significance of firms fixed-effects. Hausman is a chi-square test that compares fixed-effects and random-effects. The abbreviations TOT and POT correspond to the trade-off and pecking order theories, respectively. Values in parentheses are t-statistics to test individual significance. Superscripts ***, ** and * indicate significance at 1%, 5% and 10%, respectively.
Source: own elaboration.
In general, the results of the estimates were comparable across countries. They offered mixed results for the trade-off and pecking order theories in terms of their ability to explain the target capital structure for Latin American companies and in terms of parameters significance. Results related to ownership structure (OWN), credit quality (FCRED), growth opportunities (GROP), assets tangibility (TANG), agency costs (ACST) and non-debt tax shield (NDTS) indicate that the target capital structure for Latin American companies is explained by the tradeoff approach. The OWN variable had a negative impact that reveals that the ownership concentration reduces leverage and increases equity issuances (Cespedes et al., 2010). This fact mitigates the insolvency risk of companies. The positive effect of the firm credit quality (FCRED) reveals that firms with higher credit quality have incentives to finance themselves with more debt (Ross, 1977; Maquieira, Olavarrieta & Zutta, 2007). Growth opportunities (GROP) negatively and significantly affected target leverage. Greater growth opportunities reduce leverage because they replace the debt control role in the incentives to use investment policy in a non-optimal way (Myers & Majluf, 1984; Jensen, 1986; Espinosa, Maquieira, Vieito & Gonzalez, 2012). The positive impact of the assets tangibility (TANG) indicates that Latin American firms face lower bankruptcy costs because they can guarantee debt issuances with their long-term assets (Rajan & Zingales, 1995; Espinosa et al., 2012). Asset turnover, as an inverse measure of agency costs (ACST), had a positive impact on target leverage that supports that firms with lower agency costs have higher leverage. This policy mitigates the discretionary behavior of managers and the underinvestment problem (Jensen & Meckling, 1976; Jensen, 1986). Finally, the negative relationship between the non-debt tax shield (NDTS) and leverage indicates that firms use this tax shield as a mechanism that replaces the tax benefit related to debt (DeAngelo & Masulis, 1980; Kannadhasan et al., 2018).
On the other hand, the results related to firm profitability (FPROF) and firm size (SIZE) were consistent with the pecking order theory as a determinant of the target capital structure of the companies in the region. Firm profitability (FPROF) had a significant negative effect on target leverage. This result indicates that firms with lower profitability prefer debt issuance as a way to finance themselves at a lower cost (Rajan & Zingales, 1995; Antoniou et al., 2008; Dang, 2013; Kannadhasan et al., 2018). Firm size (SIZE) also had a significant negative effect on target leverage. Thus, larger firms issue less debt (they prefer more equity) to control liquidity risk and prorate it with longer-term financing (Munoz & Sepulveda, 2016).
The variables of public-political (IEPP) and privateregulatory (IEPR) institutional development, as well as the financial development (AFD) of the countries had a significant positive impact on target leverage. This result shows that both institutional and financial development promote debt issuance as they systematically reduce information asymmetries related to corporate financing (Zeitun et al., 2017; Kannadhasan et al., 2018).
4.3. Capital structure decision and error correction model
Table 4 presents the results of the partial adjustment model indicated in Equation (5) and the ECM-based partial adjustment model indicated in Equation (10). Panels A and B of Table 4 show that the GMM estimators are consistent because the AR1 test validated the presence of first-order autocorrelation, while the AR2 test ruled out secondorder autocorrelation. Furthermore, the Sargan test supported that the models estimated by the GMM methods of Arellano and Bond (1991) and Arellano and Bover (1995) are overidentified.
Table 4 Trade-off theory and error correction approach
| Dependent variable: Annual change of market debt to total assets ratio as debt target | ||||||||||||
| Argentina | Brazil | Chile | Colombia | Mexico | Peru | |||||||
| GMM | GMM- SYS | GMM | GMM- SYS | GMM | GMM- SYS | GMM | GMM- SYS | GMM | GMM- SYS | GMM | GMM- SYS | |
| Panel A. Trade-off theory | ||||||||||||
| Constant | 0.047*** | 0.031*** | -0.008*** | -0.007*** | -0.016*** | -0.011*** | 0.398*** | 0.358*** | -0.068*** | -0.077*** | -0.009* | -0.014** |
| (3.49) | (2.67) | (-6.12) | (-5.04) | (-6.74) | (-3.45) | (3.16) | (2.94) | (-4.21) | (-3.82) | (-1.78) | (-2.38) | |
| TLD | 0.734*** | 0.663*** | 0.689*** | 0.602*** | 0.743*** | 0.647*** | 0.593*** | 0.702*** | 0.489** | 0.564** | 0.736*** | 0.623*** |
| (5.16) | (4.01) | (4.52) | (4.39) | (4.15) | (4.87) | (3.10) | (3.37) | (2.55) | (2.39) | (3.89) | (4.11) | |
| Sample | 222 | 301 | 1404 | 1805 | 712 | 1068 | 91 | 126 | 408 | 476 | 425 | 546 |
| AR1 | -3.17*** | -3.41*** | -4.01*** | -3.84*** | -3.77*** | -3.26*** | -3.95*** | -4.12*** | -3.43*** | -2.99*** | -2.98*** | -3.18*** |
| AR2 | -0.46 | -0.85 | -1.19 | -1.03 | -0.62 | -0.95 | -0.88 | -1.12 | -0.94 | -0.72 | -1.10 | -0.97 |
| Sargan test | 41.15 | 49.72 | 150.18 | 161.39 | 88.47 | 107.24 | 24.19 | 29.98 | 67.58 | 85.20 | 71.82 | 90.66 |
| Time effect | Yes | Yes | Yes | Yes | Yes | Yes | Yes | Yes | Yes | Yes | Yes | Yes |
| Dummy sector | Yes | Yes | Yes | Yes | Yes | Yes | Yes | Yes | Yes | Yes | Yes | Yes |
| Panel B. Trade-off theory with ECM | ||||||||||||
| GMM | GMM- | GMM | GMM- | GMM | GMM- | GMM | GMM- | GMM | GMM- | GMM | GMM- | |
| SYS | SYS | SYS | SYS | SYS | SYS | |||||||
| Constant | 0.033*** | 0.023** | -0.004*** | -0.011*** | -0.020*** | -0.016*** | 0.274*** | 0.312*** | -0.053*** | -0.061*** | -0.007 | -0.019** |
| (3.31) | (2.51) | (-4.28) | (-5.23) | (-5.28) | (-2.87) | (3.01) | (3.49) | (-3.52) | (-3.35) | (-1.26) | (-2.15) | |
| TLC | 0.845*** | 0.702*** | 0.816*** | 0.791*** | 0.971*** | 0.751*** | 0.854*** | 0.917*** | 0.609*** | 0.695*** | 0.931*** | 0.818*** |
| (5.17) | (4.91) | (5.21) | (5.62) | (5.03) | (5.26) | (3.84) | (3.32) | (4.01) | (4.66) | (4.92) | (5.03) | |
| LECM | 0.801*** | 0.529*** | 0.605*** | 0.460*** | 0.741*** | 0.589*** | 0.477*** | 0.561*** | 0.527*** | 0.608*** | 0.548*** | 0.443*** |
| (5.29) | (3.16) | (4.17) | (6.85) | (4.36) | (4.69) | (5.15) | (6.33) | (4.14) | (5.27) | (5.87) | (4.39) | |
| Sample | 222 | 301 | 1404 | 1805 | 712 | 1068 | 91 | 126 | 408 | 476 | 425 | 546 |
| AR1 | -3.46*** | -3.90*** | -4.91*** | -5.21*** | -4.32*** | -4.04*** | -4.39*** | -4.16*** | -4.15*** | -3.51*** | -3.87*** | -4.09*** |
| AR2 | -0.53 | -1.02 | -1.27 | -1.12 | -0.69 | -1.23 | -1.14 | -1.42 | -1.19 | -0.89 | -1.50 | -1.36 |
| Sargan test | 42.36 | 51.19 | 156.39 | 167.45 | 90.55 | 109.91 | 25.37 | 30.06 | 66.27 | 86.74 | 70.07 | 91.28 |
| Time effect | Yes | Yes | Yes | Yes | Yes | Yes | Yes | Yes | Yes | Yes | Yes | Yes |
| Dummy sector | Yes | Yes | Yes | Yes | Yes | Yes | Yes | Yes | Yes | Yes | Yes | Yes |
Notes: AR1 and AR2 correspond to z-tests for first and second order autocorrelation, respectively. Sargan test is a chi-square test that evaluates overidentification of restrictions. All these models were estimated with robust variance. Values in parentheses are z-statistics to test individual significance. Superscripts ***, ** and * indicate significance at 1%, 5% and 10%, respectively.
Source: own elaboration.
Table 4 (Panel A) shows that the impact of the leverage deviation from the target level (TLD) was positive and significant in all cases. The adjustment speeds fluctuated between 48.9% and 74.3% according to the GMM estimator, and between 56.4% and 70.2% for the GMM-SYS estimator. These results indicate that the capital structure of Latin American firms is guided by the trade-off theory and their adjustment speeds describe a mechanism of rapid convergence from the actual leverage change to the desired change. These adjustment speeds are comparatively higher than those described in several studies carried out in developed markets (Fama & French, 2002; Flannery & Rangan, 2006; Nunkoo & Boateng, 2010; Dang, 2013; Cabrer & Rico, 2015), and similar to those found in some emerging markets (Kannadhasan et al., 2018; Nguyen et al., 2019).
Table 4 (Panel B) shows that the adjustment speeds of the capital structure of Latin American firms increased when the error correction mechanism was introduced. The adjustment speeds λ estimated using the GMM method ranged between 60.9% and 97.1%, while those calculated using the GMM-SYS estimator fluctuated between 69.5% and 91.7%. Adjustment speeds increased on average 17.4% and 14.6% with each estimation method, respectively. Mexico registered the most moderate adjustment speeds compared to the other countries. These results reinforce the view that Latin American firms decide their capital structure based on the tradeoff approach and that their target capital structure is dynamic and depends on adjustment costs. Additionally, the impact of the LECM variable on the change of leverage ratio was positive and significant at 1%. This shows that past deviations in relation to target leverage also affect the financing decision of Latin American companies. However, the capital structure adjusted more quickly to changes in target leverage over time (TLC) than to past deviations from target leverage (LECM). The latter showed adjustment speeds that varied between 44.3% and 80.1%. This empirical finding coincides with the conclusions of other studies conducted in both developed and emerging markets (Dang, 2013; Kannadhasan et al., 2018; Nguyen et al., 2019).
Table 5 presents the results of model (8) that analyzes the pecking order theory. The static pecking order model was estimated using the fixed effects (FE) method. The Hausman test was significant at 1%, showing that the fixed-effects are consistent estimators in comparison to the random-effects estimator. The estimates results show that the financial deficit (DEF) had a positive and significant impact on the leverage ratio change. This result supports that financing needs lead to higher corporate indebtedness. However, the magnitude of the pecking order parameter β fluctuated between 0.11 and 0.49, records that are below the value 1 predicted by this theory. Furthermore, the constant was significant in all cases. These findings reveal that the financial deficit explains no more than half of the issued debt, which clearly does not validate the pecking order theory in Latin American markets. The POT F-test reaches the same conclusion and coincides with other studies conducted in emerging markets (Seifert & Gonenc, 2010; Chakraborty, 2013; Chen et al., 2013; Kannadhasan et al., 2018; Nguyen et al., 2019).
Table 5 Fixed effects regression for pecking order theory.
| Dependent variable: Annual change of market debt to total assets ratio as debt target | ||||||
| Variable | Argentina | Brazil | Chile | Colombia | Mexico | Peru |
| Pecking order theory | ||||||
| Constant | 0.039*** | -0.012*** | -0.021*** | 0.301*** | -0.053*** | 0.031** |
| (3.27) | (-4.19) | (-3.97) | (3.02) | (-3.62) | (2.55) | |
| DEF | 0.491*** | 0.372*** | 0.463*** | 0.163* | 0.361** | 0.111* |
| (3.17) | (3.26) | (4.16) | (1.69) | (2.27) | (1.73) | |
| Observations | 342 | 2228 | 1187 | 145 | 618 | 674 |
| Hausman test | 49.32*** | 178.25*** | 98.02*** | 37.58*** | 63.19*** | 65.22*** |
| POT F-test | 29.58*** | 384.85*** | 167.16*** | 24.98*** | 95.80*** | 101.09*** |
| Robust variance | Yes | Yes | Yes | Yes | Yes | Yes |
| Time effect | Yes | Yes | Yes | Yes | Yes | Yes |
| Dummy sector | Yes | Yes | Yes | Yes | Yes | Yes |
Notes: All these models were estimated with fixed-effects and robust variance. The POT F-test indicates under the null hypothesis that α=0 and β=1. Values in parentheses are z-statistics to test individual significance. Superscripts ***, ** and * indicate significance at 1%, 5% and 10%, respectively.
Source: own elaboration.
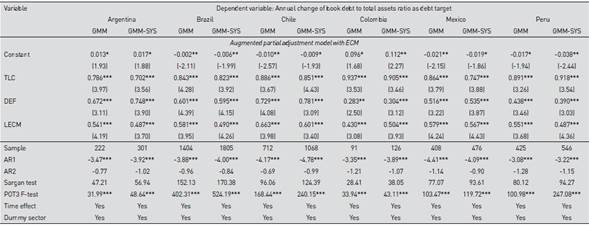
Table 6 presents the results of the augmented partial adjustment model indicated in Equation (9) and the model that included the error correction mechanism indicated in Equation (11). In both cases, the AR1 and AR2 autocorrelation tests confirmed the consistency of the GMM estimators, while the Sargan test supported that the models were instrumentally overidentified. The results shown in Table 6 (Panel A) confirm the results obtained for the trade-off (Table 4) and pecking order (Table 5) theories. On the one hand, the adjustment speeds λ estimated using the GMM method ranged between 46.3% and 72.5%, while those calculated using the GMM-SYS estimator fluctuated between 53.2% and 68.0%. These results again support that firms decide their capital structure balancing the bankruptcy costs and the tax benefits and corporate control associated with the debt. Moreover, the parameters associated with the financial deficit, variable β, had a positive and significant impact in the leverage ratio change and were not significant in some cases. However, the results reveal that the financial deficit explains less than half of the debt issued, which clearly does not validate the pecking order approach. In fact, the POT1 F-test, which under the null hypothesis indicated that α=0, β=1, and λ=0 was systematically rejected at a significance level of 1%.
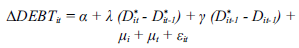
Table 6 Augmented partial adjustment model and error correction approach.
| Variable | Dependent variable: Annual change of market debt to total assets ratio as debt target | Peru | ||||||||||
| Argentina | Brazil | Chile | Colombia | Mexico | ||||||||
| GMM | GMM-SYS | GMM | GMM-SYS | GMM | GMM-SYS | GMM | GMM-SYS | GMM | GMM-SYS | GMM | GMM-SYS | |
| Panel A. Augmented partial adjustment model | ||||||||||||
| Constant | 0.043*** | 0.036*** | -0.016*** | -0.009*** | -0.014*** | -0.009*** | 0.283*** | 0.301*** | -0.046*** | -0.055*** | -0.018** | -0.032*** |
| (3.11) | (2.84) | (-4.71) | (-4.22) | (-3.21) | (-3.02) | (3.54) | (3.89) | (-3.18) | (-2.97) | (-2.23) | (-2.77) | |
| TLD | 0.691*** | 0.615*** | 0.661*** | 0.594*** | 0.725*** | 0.612*** | 0.561*** | 0.680*** | 0.463** | 0.532** | 0.707*** | 0.592*** |
| (3.61) | (3.38) | (4.87) | (4.80) | (3.34) | (3.65) | (2.83) | (2.75) | (2.10) | (2.02) | (2.88) | (3.27) | |
| DEF | 0.447** | 0.574*** | 0.274*** | 0.271*** | 0.387*** | 0.316*** | 0.149* | 0.103 | 0.291** | 0.258** | 0.092 | 0.217** |
| (2.19) | (2.67) | (2.98) | (3.03) | (3.48) | (3.10) | (1.77) | (1.41) | (2.11) | (2.44) | (0.99) | (2.35) | |
| Sample | 222 | 301 | 1404 | 1805 | 712 | 1068 | 91 | 126 | 408 | 476 | 425 | 546 |
| AR1 | -3.19*** | -3.97*** | -4.83*** | -4.61*** | -4.27*** | -3.88*** | -4.21*** | -3.37*** | -4.17*** | -3.72*** | -3.71*** | -3.99*** |
| AR2 | -0.43 | -0.92 | -1.35 | -1.50 | -0.73 | -1.09 | -1.11 | -1.15 | -1.06 | -0.84 | -1.29 | -1.42 |
| Sargan test | 43.29 | 52.88 | 142.34 | 165.70 | 90.09 | 110.19 | 26.55 | 32.16 | 70.29 | 89.71 | 74.47 | 91.53 |
| POT1 F-test | 32.86*** | 45.05*** | 390.16*** | 465.39*** | 169.63*** | 247.29*** | 28.57*** | 37.78*** | 93.13*** | 110.36*** | 107.08*** | 228.33*** |
| Time effect | Yes | Yes | Yes | Yes | Yes | Yes | Yes | Yes | Yes | Yes | Yes | Yes |
| Dummy sector | Yes | Yes | Yes | Yes | Yes | Yes | Yes | Yes | Yes | Yes | Yes | Yes |
| Panel B. Augmented partial adjustment model with ECM | ||||||||||||
| GMM | GMM-SYS | GMM | GMM-SYS | GMM SYS | GMM-SYS | GMM | GMM- | GMM | GMM-SYS | GMM | GMM-SYS | |
| Constant | 0.026** | 0.024** | -0.007*** | -0.013*** | -0.014*** | -0.016*** | 0.206*** | 0.197*** | -0.028*** | -0.034*** | -0.025** | -0.046*** |
| (2.51) | (2.32) | (-3.94) | (-4.26) | (-3.33) | (-2.91) | (2.89) | (3.12) | (-2.63) | (-2.79) | (-2.47) | (-2.81) | |
| TLC | 0.817*** | 0.688*** | 0.794*** | 0.807*** | 0.948*** | 0.723*** | 0.872*** | 0.898*** | 0.628*** | 0.671*** | 0.919*** | 0.799*** |
| (4.12) | (3.83) | (4.16) | (4.37) | (4.15) | (4.72) | (3.22) | (3.79) | (3.37) | (3.64) | (3.95) | (3.06) | |
| DEF | 0.691*** | 0.763*** | 0.549*** | 0.568*** | 0.715*** | 0.837*** | 0.291** | 0.336*** | 0.557*** | 0.508*** | 0.411*** | 0.450*** |
| (3.55) | (4.14) | (4.26) | (4.37) | (4.27) | (3.60) | (2.47) | (3.03) | (2.97) | (4.13) | (2.77) | (3.25) | |
| LECM | 0.568*** | 0.506*** | 0.596*** | 0.474*** | 0.694*** | 0.586*** | 0.451*** | 0.532*** | 0.544*** | 0.582*** | 0.539*** | 0.460*** |
| (4.38) | (3.96) | (3.79) | (4.48) | (4.12) | (3.75) | (3.66) | (4.07) | (4.37) | (4.84) | (3.55) | (4.14) | |
| Sample | 222 | 301 | 1404 | 1805 | 712 | 1068 | 91 | 126 | 408 | 476 | 425 | 546 |
| AR1 | -3.31*** | -4.03*** | -3.69*** | -4.13*** | -4.48*** | -4.52*** | -3.93*** | -4.18*** | -4.54*** | -3.95*** | -3.56*** | -3.67*** |
| AR2 | -0.59 | -0.81 | -1.12 | -0.91 | -0.66 | -1.13 | -1.34 | -1.28 | -1.21 | -0.93 | -1.30 | -1.27 |
| Sargan test | 45.64 | 55.28 | 150.28 | 173.04 | 94.35 | 122.06 | 29.78 | 38.34 | 75.85 | 92.98 | 77.50 | 95.01 |
| POT2 F-test | 30.53*** | 47.23*** | 405.52*** | 514.21*** | 174.32*** | 254.29*** | 31.40*** | 40.08*** | 99.70*** | 124.45*** | 104.23*** | 231.20*** |
| Time effect | Yes | Yes | Yes | Yes | Yes | Yes | Yes | Yes | Yes | Yes | Yes | Yes |
| Dummy sector | Yes | Yes | Yes | Yes | Yes | Yes | Yes | Yes | Yes | Yes | Yes | Yes |
Notes: AR1 and AR2 correspond to z-test for first and second order autocorrelation, respectively. Sargan test is a chi-square test that evaluates overidentification of restrictions. The POT1 F-test indicates under the null hypothesis that α=0, β=1 and λ=0. The POT2 F-test indicates under the null hypothesis that α=0, β=1, λ=0 and γ=0. All these models were estimated with robust variance. Values in parentheses are z-statistics to test individual significance. Superscripts ***, ** and * indicate significance at 1%, 5% and 10%, respectively.
Source: own elaboration.
Table 6 (Panel B) demonstrates that the magnitude of the parameters associated with TLC and DEF increase when the error correction is incorporated. On the one hand, the adjustment speeds λ estimated using the GMM method ranged between 62.8% and 94.8%, while those calculated using the GMM-SYS estimator fluctuated between 67.1% and 89.8%. Given that these speeds were higher than 30%, the adjustment of the current leverage change towards the desired change was rapid and supports the trade-off theory as a determinant of the capital structure in Latin American firms. On the other hand, the pecking order parameter β increased significantly. However, and despite the observed increase, the POT2 F-test, which under the null hypothesis indicated that α=0, β=1, λ=0, and γ=0 was systematically rejected at a significance level of 1%. This fact ruled out this theory as a determinant of firms’ leverage.
4.4. Robustness check.
This section presents the robustness analyzes. To corroborate them, the debt to total assets ratio was used considering the debt at book value (Shyam-Sunder & Myers, 1999; Dang, 2013; Kannadhasan et al., 2018). With this debt measure at book value, the target debt (Equation 7) and the augmented partial adjustment model with ECM (Equation 11) were estimated. The objective was to confirm the validity of the trade-off and pecking order theories, as well as to analyze the adjustment speeds of the ECM method.
Table 7 shows the determinants of target debt (Equation 7), using the debt at book value. In general terms, the results were similar to those described in Table 3. The signs of the coefficients associated with the variables OWN, FCRED, GROP, TANG, ACST, and NDTS were consistent with the trade-off precepts, while the rest of the variables behaved according to the pecking order approach. Changes were observed in the significance of the variables OWN, GROP, SIZE, TANG, and NDTS in the different countries. Finally, the systematic variables related to institutional and financial development maintained the same statistical and economic significance.
Table 7 Fixed-effects panel data regression for target book debt level.
| Expected sign | Dependent variable: Book debt to total assets ratio as debt target | |||||||
| TOT | POT | Argentina | Brazil | Chile | Colombia | Mexico | Peru | |
| Constant | -0.7475*** | -0.3951** | -0.6493*** | -0.8638** | -0.7742** | -1.0352*** | ||
| (-2.86) | (-2.38) | (-2.67) | (-2.24) | (-2.54) | (-3.48) | |||
| Firms-level qualities as leverage determinants | ||||||||
| OWN | - | + | -0.1346*** | -0.2281*** | -0.0127 | -0.0582 | -0.4736*** | -0.0845* |
| (-3.06) | (-3.73) | (-0.42) | (-1.20) | (-4.15) | (-1.93) | |||
| FPROF | + | - | -0.4047** | -0.2694*** | -0.4306*** | -0.1826** | -0.3785*** | -0.5138*** |
| (-2.41) | (-3.09) | (-3.65) | (-2.54) | (-3.04) | (-2.96) | |||
| FCRED | + | - | 0.0046*** | 0.0073*** | 0.0058*** | 0.0077*** | 0.0050*** | 0.0064** |
| (3.16) | (2.94) | (3.01) | (3.12) | (2.80) | (2.55) | |||
| GROP | - | + | -0.0467** | -0.0083 | -0.0609*** | -0.0054 | -0.0267*** | -0.0196 |
| (-2.16) | (-1.13) | (-3.07) | (-0.78) | (-2.89) | (-1.63) | |||
| SIZE | + | - | -0.0310** | -0.0199 | -0.0481*** | -0.0141 | -0.0103 | -0.0572*** |
| (-2.31) | (-0.26) | (-2.99) | (-0.43) | (-0.95) | (-3.14) | |||
| TANG | + | - | 0.0435 | 0.4066*** | 0.2528*** | 0.0205 | 0.3192*** | 0.5509*** |
| (1.66) | (3.17) | (3.41) | (0.79) | (3.69) | (3.45) | |||
| ACST | + | - | 0.0366** | 0.0762*** | 0.0586*** | 0.1157*** | 0.1369*** | 0.0688*** |
| (2.51) | (3.17) | (2.84) | (3.08) | (3.72) | (4.24) | |||
| NDTS | - | -0.0035 | -0.5419*** | -0.2976*** | -0.0303 | -0.5689*** | -0.3805*** | |
| (-0.41) | (-3.91) | (-4.13) | (-1.00) | (-3.94) | (-3.02) | |||
| Institutional-financial qualities as leverage determinants | ||||||||
| IEPP | + | + | 0.3035*** | 0.2146** | 0.2013** | 0.1635* | 0.3203*** | 0.4375*** |
| (2.64) | (2.56) | (1.97) | (1.71) | (2.78) | (3.80) | |||
| IEPR | + | + | 0.6453*** | 0.3865*** | 0.4366*** | 0.4409*** | 0.5683*** | 0.5726*** |
| (3.01) | (3.22) | (2.97) | (3.45) | (3.87) | (4.31) | |||
| AFD | + | + | 0.0091*** | 0.0302*** | 0.0085*** | 0.0194*** | 0.0241*** | 0.0119*** |
| (2.73) | (4.15) | (2.69) | (3.14) | (3.27) | (3.66) | |||
| Observations | 342 | 2228 | 1187 | 145 | 618 | 674 | ||
| Hausman test | 57.25*** | 203.68*** | 119.17*** | 44.97*** | 71.93*** | 83.11*** | ||
| Time effects | Yes | Yes | Yes | Yes | Yes | Yes | ||
| Individual effects | Yes | Yes | Yes | Yes | Yes | Yes | ||
| Dummy sector | Yes | Yes | Yes | Yes | Yes | Yes | ||
| Robust variance | Yes | Yes | Yes | Yes | Yes | Yes |
Notes: Fixed-effects correspond to F-test for significance of firms’ fixed effects. Hausman is a chi-square test that compares fixed-effects and random-effects. The abbreviations TOT and POT correspond to the trade-off and pecking order theories, respectively. Values in parentheses are t-statistics to test individual significance. Superscripts ***, ** and * indicate significance at 1%, 5% and 10%, respectively.
Source: own elaboration.
Table 8 shows the results of the augmented partial adjustment model considering market leverage. The results were similar to those indicated in Table 6. On the one hand, the high adjustment speeds support the trade-off theory as a determinant of the capital structure in Latin American firms. Even these speeds were comparatively higher than those shown in Table 4, thus demonstrating the relevance of ECM to evaluate adjustment costs over target leverage. On the other hand, the coefficients associated with the financial deficit (surplus) revealed that the pecking order theory was not fully met.
Table 8 Augmented partial adjustment model and error correction approach.
Notes: AR1 and AR2 correspond to z-test for first and second order autocorrelation, respectively. Sargan test is a chi-square test that evaluates overidentification of restrictions. The POT3 F-test indicates under the null hypothesis that that α=0, β=1, λ=0 and γ=0. All these models were estimated with robust variance. Values in parentheses are z-statistics to test individual significance. Superscripts ***, ** and * indicate significance at 1%, 5% and 10%, respectively.
Source: own elaboration.
5. Conclusions and discussion
The decision on the capital structure has been a relevant and widely discussed topic in the field of corporate finance. In this regard, several theories have been proposed as determinants of this decision, with the trade-off and pecking order theories being the most studied. The empirical evidence that has studied them in both developed and emerging markets has not reached a consensus on which of them determines the capital structure. Even several empirical studies have shown that both theories are not exclusive.
This issue has not been addressed in depth in Latin American markets, for which it has become of great relevance due to the significant increase in corporate debt after the 2008 subprime crisis (De Gregorio et al., 2017). Our research covers this empirical gap and, according to its results, provides two important contributions to the explanatory power of these theories on the capital structure in emerging markets. First, the trade-off and pecking order approaches as determinants of the capital structure of Latin American firms were analyzed separately and together. The results showed that the trade-off theory determines the financing decision of the firms, not the pecking order theory. The empirical findings confirmed the existence of a target capital structure, which under the trade-off approach would be explained by firms’ specific qualities such as ownership structure, credit quality, growth opportunities, assets tangibility, agency costs, and non-debt tax shields. Variables at the country level such as institutional development in the public-political and private-regulatory spheres and the level of penetration of the financial system are also significant determinants of target leverage. Other variables such as profitability and firm size showed results consistent with the pecking order theory. Once the target capital structure was determined, the results of the partial adjustment model revealed a rapid convergence towards this target structure in all Latin American markets. The adjustment speeds showed that the deviation from the target leverage explains between 48.9% and 74.3% of the actual change in leverage ratio. Regarding the pecking order theory, the financial deficit explained less than half of the issued debt, which clearly contradicts the predictions of this theory. All these findings were also confirmed in the augmented partial adjustment model.
Second, using the ECM, we assessed whether the target capital structure depended on adjustment costs and, as a result, its convergence speeds were altered. The results showed that the target leverage depends on the adjustment costs, and therefore has a dynamic behavior that affects its convergence speeds. Following the ECM application, the adjustment speeds of the partial adjustment model increased to a range that fluctuated between 69.5% and 91.7% (between GMM and GMM-SYS estimations). The increase in the speeds revealed that Latin American firms require a faster adjustment the further their leverage is from the target structure (Byoun, 2008). Similar results were obtained for the augmented partial adjustment model, which validated the trade-off theory as a determinant of the capital structure of Latin American firms. Regarding the pecking order theory, the explanatory power of the financial deficit (surplus) also increased to a range between 0.33 and 0.83. However, in no case did this explain the full leverage change. This fact supports the previous results in the sense that the capital structure of firms in the region is not governed by the pecking order theory.
These results have important implications for companies, investors, and policy makers. For companies, it allows them to evaluate their financing decisión considering the potential bankruptcy costs, as well as the tax benefits and corporate control associated with leverage. In addition, the results allow firms to assess rapid adjustments of their capital structure towards dynamic target leverage and guide corporate decisions to maximize the firm’s value. For investors, these findings allow them to guide their investment decision by incorporating the relevance of debt creditors as a means of external monitoring. Finally, for policy makers, these results offer an empirical framework that contributes to the design of regulations aimed at reducing the costs of debt associated with bankruptcy or information asymmetries and strengthening the corporate governances.
A limitation of this research lies in the type of firms analyzed. The database consisted solely of public companies that are listed on the stock market. Therefore, SMEs in which information asymmetries would potentially be more relevant were not included. This fact could cause a different capital structure adjustment that has not been analyzed and would constitute a future research line. Econometrically, some patterns of non-normality of the residuals could affect the conclusions, particularly in the estimates of those countries with fewer observations (e.g., Colombia).

