


 English (pdf)
 Article in xml format
 Article references
 Send this article by e-mail
 Cited by SciELO
  Cited by Google
  Similars in
SciELO
Similars in
SciELO  Similars in Google
 Permalink
1. Introduction
Research on the marketing-finance interface has had a significant development since 2004 (Edeling, Srinivasan, & Hanssens, 2021). It has also evidenced a need to demonstrate value creation through advertising actions due to the growth of investments in this field and the measured and produced effects on firm performance and firm value (Joshi & Hanssens, 2010; Bayer, Srinivasan, Riedl, & Skiera, 2020).
The market microstructure theory (Hasbrouck, 2007) predicts that asymmetric information is related to stock returns, thus stimulating the development of several valid measures for it (Roll, 1984; Easley, Hvidkjaer, & O'Hara, 2002; Corwin & Schultz, 2012). It can be applied to various studies in finance, including financial institutions (Ripamonti, 2020). Thus, we deduce that such information can also relate to advertising and contribute to the marketing-finance interface.
The theoretical framework indicates that advertising actions would occur prior to the generation of value for the firm (Joshi & Hanssens, 2010). Then, they are strategic activities whose information is treated by only the corporation’s managers (Akerlof, 1970).
This research examines the relationship between the concepts of asymmetric information and advertising expenditure. For this purpose, we selected a sample of corporations from the developing stock market from 2007 to 2019, and the data were assessed using the panel cointegration technique (Larsson, Lyhagen, & Lothgren, 2001). The results indicate that asymmetric information anticipates the generation of value due to advertising actions up to four quarters. It is consistent with the marketing-finance interface and contributes to understanding the enormous relevance of advertising actions as a substantive research topic (Edeling, Srinivasan, & Hanssens, 2021).
Although research in the area of marketing-finance interface (Edeling, Srinivasan, & Hanssens, 2021) has increased in recent decades-including the perspective on asymmetric information-this paper applies a specific measure to the developing stock market, filling part of a gap on the validity of international findings for this type of market, where a greater amount of information on advertising issues is expected.
This paper is structured as follows: the introduction section is followed by the theoretical framework, methodology, results, and concluding remarks.
2. Theoretical Framework
According to the advertising theory (Joshi & Hanssens, 2010), the company’s value creation indicates the existence of direct and indirect effects of advertising on stock prices. This is consistent with the rational expectations theory (Muth, 1961) and the efficient market hypothesis (Fama, 1970; 1991). Therefore, planning advertising campaigns includes relevant strategic information (Akerlof, 1970); it allows us to assume a long-term relationship (Johansen, 1988; 1991) between asymmetric information and advertising, thus unfolding the market microstructure theory (Hasbrouck, 2007).
Since high advertising expenditures are related to asymmetric information, our hypothesis is that this relationship is positive because asymmetric information impacts improvements on stock returns (Hasbrouck, 2007).
2.1 Advertising and Finance
The literature on advertising and finance is very extensive and approaches interesting aspects, for instance, funding activities. Ding et al. (2017) observed that smaller companies with higher advertising expenditures are more likely to obtain access to bond financing, although those with greater financial restrictions do not intentionally use advertising for this purpose. The authors used the log variables of advertising expenditures, advertising/revenue, and advertising/total assets in their models.
When the resources come from the stock market, Chemmanur and Yan (2017) verified that product market advertising prior to the initial public offering is associated with subsequent upward price revisions, with lower returns in the long term, even when controlled for the purpose of investor attention.
Even in turbulent moments, advertising has a central role. Garcia-Zambrano et al. (2018) observed that advertising expenses incurred before crises had a significant impact on the stock prices of companies listed on the Spanish stock exchange. They used the sum of the three previous years divided by net revenue from the current year as a measure for advertising.
As shown in Mian et al. (2018) investor sentiment in the stock market can influence advertising expenditure, precisely because it makes fundraising difficult. They found a positive association between these concepts and observed greater effectiveness of advertising expenditure in periods of lower investor sentiment.
Hsu and Chen (2018) studied the difference in returns between stocks with high maximum daily returns and low maximum daily returns, called the MAX effect. They verified that advertising influences it through the dissemination of information in periods of high investor sentiment, thus stimulating overconfidence in search for actions through greater advertising.
Kim et al. (2019) argued that investors' interpretation of debt securities issuance can be strategically orient-ed, leading corporations to adopt capital structures at different levels. This affects the market value of shares. Their results show that marketing activities moderate the effect of capital structure on firm valuation.
Du and Osmonbekov (2020) confirmed the effects of advertising on the market value of firms not covered by analysts in a sample of 40-year-old corporations. The authors used the several variables, including Tobin’s Q, total advertising onsales lagged by one year, and dummies as well.
Examining only companies, Guenther and Guenther (2020) observed that advertising in the business-to-business (B2B) market leads to more intense sales growth and boosts the significance of quality and sales force spending. This supports the view that advertising would be responsible for sales growth as predicted by Joshi and Hanssens (2010) .
Bayer et al. (2020) compared the main advertising channels and their effects on the generation of value for corporations. They observed that online display advertising generates more sales than offline advertising, and that paid search advertising generates more firm value than offline advertising.
Swani et al. (2020) indicated the need to improve in-vestment analysis techniques in B2B advertising to help corporations make financial decisions. Hsieh et al. (2020) observed that the level of individual investor attention-measured by the Google Search volume index for a given company-is associated with hoarding behavior from buying in bull markets and selling to the bear market.
A quite different industry such as education is also affected by advertising. Nguyen et al. (2021) proposed two measures of social media interaction-use and validation-and evaluated their association with university brand value. Their conclusions indicate that social interaction generates university brand value, especially regarding the choice of the course and the level of guarantee of career success.
Back to trading activities, Kupfer and Schmidt (2021) observed that the retention of individual investor attention through search engine advertising determines the quantity and return of purchase orders less than 100 shares, with positive and significant differences for more expensive ones. This is consistent with the hypothesis of attention-induced trading.
Que and Zhang (2021) examined how investor attention, captured by a direct measure based on aggregate search frequency-the abnormal search volume index-influences valuation in the venture capital market. The results indicate that an increase in this index predicts higher valuations in proportions greater than those expected by the information-based fundamental premium. This justifies the long-term reversal of the obtained return.
Morlacco and Zeke (2021) developed a model that demonstrates that the largest companies invest more in advertising to capture customers from their competitors’ base when there is a decrease in the economy’s basic interest rate.
Edeling et al. (2021) conducted an extensive review of research on finance and marketing and observed emerging research areas like digital marketing and firm value, the trade-off between ‘doing good’ and ‘doing well’, and the mechanisms of firm-value and feedback effects.
2.2 Problem Statement
The theory of market microstructure (Hasbrouck, 2007) predicts that the difference in the quantity and quality of information between managers and investors- asymmetric information-is associated with stock returns (Akerlof, 1970). The communication and advertising of corporations is strategic information, and advertising expenses generate short- and long-term impacts (Joshi & Hanssens, 2010) on stock returns.
Therefore, some strategic information about advertising could be captured by asymmetric information measures. This point was first discussed in the seminal work of Roll (1984) ; followed by Easley et al. (2002) , which has become a standard in the literature; and Corwin and Schultz (2012) , who discuss greater access. Thus, this point is validated in different contexts (Ripamonti, 2016; 2020), and asymmetric information can be observed in different research, including products and real estate industries.
Schmidbauer and Stock (2018) developed a price signaling model in which uninformed consumers infer the quality of products from not only the current price but also the previous price. This allows high-quality product firms to benefit, especially when there is a reduction in production costs.
Myers (2020) noted that asymmetric information also exists in the property rental market, specifically in relation to energy issues, with uninformed tenants assuming that higher energy costs and advertising campaigns for energy efficiency standards directly affect the analyzed market.
In relation to leases and energy expenses, Cornago and Dressler (2020) analyzed data from rental advertisements in Brussels and found that tenants do not necessarily evaluate energy expenditure rationally to decide on the choice of a property. This encourages property owners to not provide such information, even when certified.
Arnold and Zhang (2020) examined the asymmetric information on prices between companies with different customer loyalty bases and observed that the high cost of advertising and the absence of a significant difference in customer loyalty generates competition for customers. They concluded that the probability of advertising decreases as the size of the loyal customer base increases.
With the digital generating more sales, it is interesting to note what Belhadj et al. (2020) observed: private information about the demand for products leads platforms to activate the resale mode in the case of more expensive products presenting fewer problems and consumers having greater desire to purchase them. This enables the development of a model for automatic separation of the mode to be used.
3. Methodology
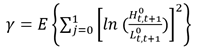
In general, panel data analysis studies predominate on the marketing-finance interface (Edeling, Srinivasan, & Hanssens, 2021). However, some phenomena may show a lag among variables (Granger, 1981), with the possibility of assesing the relationship between asymmetric information and advertising in the long term (Johansen, 1988; 1991), especially when the effects can be seen over even longer periods (Joshi & Hanssens, 2010). In addition, panel analysis of the data from non-stationary variables can lead to long-term spurious regressions (Granger, 1981; Engle & Granger, 1987). Cointegration is the long-term relationship between non-stationary variables whose residual is stationary; it is adjusted in the short-term error correction models (Johansen, 1988; 1991) applicable to panel data (Larsson, Lyhagen, & Lothgren, 2001), as showed in Equation 1.
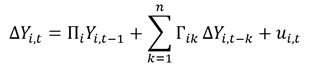 (1)
(1)
Among the measures used in the literature, selling expenses on the total assets were selected as the measure for advertising (Ding, Jia, Wu, & Yuan, 2017), considering that since the internationalization of accounting standards, all advertising investments are recorded as selling expenses. For this reason, the sample period starts in 2007.
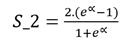
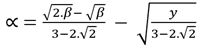
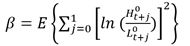
The asymmetric information is measured by S_2 (equations 2 to 5) or the Corwin-Schultz bid-ask spread estimator (Corwin & Schultz, 2012), duly validated for the stock market of the sample companies (Ripamonti, 2016). This measure requires only high (H), low (L), open, and close price data for its calculation, and its immediate availability determines the period of coverage of the sample until 2019.
 (2)
(2)
 (3)
(3)
 (4)
(4)
 (5)
(5)
The results are set up for growth opportunities set, size, leverage, and return using the traditional finance variables (Titman & Wessels, 1988) of the M/B ratio (market value on book value of equity), size (ln of total assets), D/E (market value of debt on market value equity), and return (stock price changes). Consistent with the theoretical framework, this research assumes that there is a positive and significant relationship between asymmetric information and advertising.
The sample included data from 82 corporations listed on the Brazilian stock market during 57 quarters between 2007 and 2019. The most liquid stocks in this developing market in 2019 and the accounting of investments in advertising only for 2007 are adopted. Precautions in the analysis are necessary to avoid the survival biases and rejection of null cointegration that could be derived from the extension of the time series (Timmermann, 1995). The survival bias could possibly be explained by the liquidity of the sample stocks. The data analyzed in this research were obtained from Comdinheiro.com financial platform.
The main descriptive statistics of the sample are presented in Table 1. It shows that the average S_2 was 0.0148 per day, while the average advertising was approximately 0.0485 for the assets. In general, relative consistency with other studies on the same market was observed (Ripamonti, 2016), including control variables with an average return of 0.699 per quarter, M/B of 2.62, D/E of 0.68, and size of 10.25.
Table 1 Descriptive statistics.
| S_2 | Advertising | Return | M/B | D/E | Size | |
|---|---|---|---|---|---|---|
| Mean | 0.014832 | 0.048537 | 0.699471 | 2.626226 | 0.685994 | 10.25943 |
| Median | 0.014020 | 0.014793 | 0.012344 | 1.781578 | 0.347947 | 9.965290 |
| Maximum | 0.050524 | 0.443674 | 472.2759 | 70.84703 | 26.42921 | 14.29419 |
| Minimum | 0.000486 | 0.000000 | -0.839575 | -598.6021 | 0.000000 | 6.303168 |
| Std. Dev. | 0.005563 | 0.078937 | 16.43587 | 14.49078 | 1.238011 | 1.732824 |
| Skewness | 1.262790 | 2.433897 | 26.47930 | -31.15820 | 7.608594 | 0.582447 |
| Kurtosis | 6.828576 | 9.080672 | 724.0368 | 1,251.279 | 113.7776 | 2.648111 |
| Jarque-Bera | 2,131.703 | 6,147.891 | 52,966,800 | 1.58E+08 | 1,266,994. | 150.0549 |
| Probability | 0.000000 | 0.000000 | 0.000000 | 0.000000 | 0.000000 | 0.000000 |
| Sum | 36.07112 | 118.0411 | 1,701.114 | 6,386.980 | 1,668.337 | 24,950.93 |
| Sum Sq. Dev. | 0.075244 | 15.14783 | 656,704.9 | 510,467.8 | 3,725.922 | 7,299.515 |
| Observations | 2,432 | 2,432 | 2,432 | 2,432 | 2,432 | 2,432 |
Note: This table presents the main descriptive statistics of the study variables. S_2 is daily asymmetric information, and Advertising refers to the average selling expenses on total assets. Return is the quarterly change in stock price. M/B is the market value on the book value of equity (market-to-book ratio). D/E is the market value of debt on the market value of equity (debt-on-equity ratio). Size is the natural logarithm of total assets.
Source: own elaboration.
Table 2 shows the correlation between the variables assessed in this study, with no evidence of problems in the data. It indicates that advertising and S_2 have a negative correlation, contrary to the theoretical framework. This result may be due to a lag between the effects, which is confirmed by the reversal of direction in the coefficients of the short-term error correction mechanisms. Interestingly, the positive correlation between S_2 and D/E is consistent with the capital structure theories (Modigliani & Miller, 1963; Ripamonti, 2020).
Table 2 Correlation matrix.
| S_2 | Advertising | Return | M/B | D/E | Size | |
|---|---|---|---|---|---|---|
| S_2 | 1.000000 | -0.052041 | 0.003412 | -0.040983 | 0.346077 | -0.046134 |
| Advertising | -0.052041 | 1.000000 | -0.012352 | 0.068315 | -0.060340 | -0.390593 |
| Return | 0.003412 | -0.012352 | 1.000000 | 0.005446 | -0.013926 | 0.010210 |
| M/B | -0.040983 | 0.068315 | 0.005446 | 1.000000 | -0.066979 | -0.028561 |
| D/E | 0.346077 | -0.060340 | -0.013926 | -0.066979 | 1.000000 | 0.099655 |
| Size | -0.046134 | -0.390593 | 0.010210 | -0.028561 | 0.099655 | 1.000000 |
Note: This table presents the correlation matrix of the variables in this study. S_2 is daily asymmetric information, and Advertising refers to the average selling expenses on total assets. Return is the quarterly change in stock price. M/B is the market value on the book value of equity (market-to-book ratio). D/E is the market value of debt on the market value of equity (debt-on-equity ratio). Size is the natural logarithm of total assets.
Source: own elaboration.
4. Results
The main result is the long-term relationship between advertising and asymmetric information, as shown in Table 4, with a lag of two quarters in all possible specifications of the applied technique. This result indicates that information on the development of advertising campaigns is captured by the measure of asymmetric information and confirms the relevance of this field of study (Edeling, Srinivasan, & Hanssens, 2021).
One assumption of cointegration is the non-stationarity of variables, which is measured by the augmented Dickey-Fuller (ADF) test. Table 3 presents the stationary statistics of the examined variables through several tests, and it shows that all variables are stationary according to the statistics of the ADF-Fisher test (Dickey & Fuller, 1979; 1981; Larsson, Lyhagen, & Lothgren, 2001). This would be the opposite of the cointegration assumption (Dickey & Fuller, 1979), posing no problem when considering the existence of up to five cointegration posts, as shown in Table 4.
Table 3 Unit root tests.
| Variable | sig | Levin-Lin-Chu | Breitung | Im, Pesaran, and Shin | ADF-Fisher | PP-Fisher |
|---|---|---|---|---|---|---|
| S_2 | statistic | -9.17376 | -11.4058 | -9.33515 | 390.181 | 932.182 |
| prob | 0.0000 | 0.0000 | 0.0000 | 0.0000 | 0.0000 | |
| Advertising | statistic | -3.31779 | -1.70135 | -2.95614 | 164.235 | 182.922 |
| prob | 0.0005 | 0.0444 | 0.0016 | 0.0000 | 0.0000 | |
| Return | statistic | -2,065.93 | -10.845 | -384.835 | 1,559.62 | 2,164.89 |
| prob | 0.0000 | 0.0000 | 0.0000 | 0.0000 | 0.0000 | |
| M/B | statistic | -3.2313 | -0.2863 | -2.44532 | 187.81 | 190.856 |
| prob | 0.0006 | 0.3873 | 0.0072 | 0.0001 | 0.0001 | |
| D/E | statistic | -0.08408 | -1.44072 | -1.01414 | 135.515 | 141.74 |
| prob | 0.4665 | 0.0748 | 0.1553 | 0.0342 | 0.0224 | |
| Size | statistic | -5.81929 | 3.69261 | -1.00553 | 155.86 | 250.206 |
| prob | 0.0000 | 0.9999 | 0.1573 | 0.0278 | 0.0000 |
Note: This table presents the unit root test statistics and p-values of the variables of this study with the null of common non-stationarity (Levin-Lin-Chu and Breitung) or individual (Im, Pesaran, and Shin; augmented Dickey-Fuller [ADF]; and Phillips-Perron [PP]). S_2 is daily asymmetric information, and Advertising refers to the average selling expenses on total assets. Return is the quarterly change in stock price. M/B is the market value on the book value of equity (market-to-book ratio). D/E is the market value of debt on the market value of equity (debt-on-equity ratio). Size is the natural logarithm of the total assets.
Source: own elaboration.
Table 4 Vector error correction model estimates for asymmetric information.
| Cointegrating equation | Intercept | Intercept CE | Intercept CE/VAR | Intercept and trend CE | Intercept and trend CE/VAR |
|---|---|---|---|---|---|
| Optimal lag choice | 2 | 2 | 2 | 2 | 2 |
| Max and trace statistics - rank | 5 | 5 | 5 | 5 | 5 |
| S_2(-1) | 1.000000 | 1.000000 | 1.000000 | 1.000000 | 1.000000 |
| SELL_EXPENSES/ASSET(-1) | 0.265669 | 0.861475 | 0.863642 | 0.870859 | 0.871405 |
| (0.05810) | (0.24212) | (0.24280) | (0.28635) | (0.28660) | |
| [4.57234] | [3.55798] | [3.55702] | [3.04124] | [3.04047] | |
| RETURN(-1) | -1.189653 | -4.418665 | -4.429983 | -4.453302 | -4.456216 |
| (0.02386) | (0.08856) | (0.08881) | (0.08928) | (0.08935) | |
| [-49.8641] | [-49.8940] | [-49.8828] | [-49.8828] | [-49.8716] | |
| M_B(-1) | -0.001475 | -0.005683 | -0.005699 | -0.005730 | -0.005736 |
| (0.00073) | (0.00270) | (0.00271) | (0.00272) | (0.00272) | |
| [-2.03330] | [-2.10473] | [-2.10461] | [-2.10484] | [-2.10514] | |
| D_E(-1) | 0.010624 | 0.042943 | 0.043069 | 0.043232 | 0.043271 |
| (0.00399) | (0.01481) | (0.01485) | (0.01538) | (0.01539) | |
| [2.66298] | [2.89926] | [2.89966] | [2.81128] | [2.81135] | |
| SIZE(-1) | -0.000592 | -0.013863 | -0.013890 | -0.013776 | -0.013783 |
| (0.00063) | (0.01095) | (0.01098) | (0.01523) | (0.01524) | |
| [-0.94604] | [-1.26555] | [-1.26449] | [-0.90463] | [-0.90428] | |
| TREND (07Q1) | -4.66E-07 | 1.12E-05 | |||
| (2.6E-05) | |||||
| [-0.01788] | |||||
| C | 0.168281 | 0.175172 | 0.174928 | 0.155963 | |
| (0.11914) | |||||
| [1.41250] | |||||
| Error Correction: | D(S_2) | D(S_2) | D(S_2) | D(S_2) | D(S_2) |
| CointEq1 | 0.001232 | 0.000352 | 0.000351 | 0.000349 | 0.000349 |
| (0.00039) | (0.00010) | (0.00010) | (0.00010) | (0.00010) | |
| [ 3.16376] | [3.35624] | [3.35924] | [3.35975] | [3.35848] | |
| D(S_2(-1)) | -0.372500 | -0.373562 | -0.374523 | -0.374526 | -0.374521 |
| (0.02277) | (0.02269) | (0.02269) | (0.02269) | (0.02270) | |
| [-16.3622] | [-16.4609] | [-16.5039] | [-16.5041] | [-16.5000] | |
| D(S_2(-2)) | -0.238873 | -0.239263 | -0.239754 | -0.239755 | -0.239750 |
| (0.02128) | (0.02126) | (0.02125) | (0.02125) | (0.02125) | |
| [-11.2243] | [-11.2566] | [-11.2828] | [-11.2828] | [-11.2800] | |
| D(SELL_EXPENSES_ASSET(-1)) | 0.011369 | 0.011364 | 0.011893 | 0.011893 | 0.011893 |
| (0.00836) | (0.00836) | (0.00836) | (0.00836) | (0.00836) | |
| [1.35961] | [1.35949] | [1.42225] | [1.42220] | [1.42188] | |
| D(SELL_EXPENSES_ASSET(-2)) | 0.004629 | 0.004596 | 0.005105 | 0.005104 | 0.005107 |
| (0.00859) | (0.00859) | (0.00859) | (0.00859) | (0.00860) | |
| [0.53872] | [0.53500] | [0.59403] | [0.59398] | [0.59413] | |
| C | -0.000157 | -0.000157 | -0.000144 | ||
| (9.5E-05) | (9.5E-05) | (0.00018) | |||
| [-1.65609] | [-1.65608] | [-0.78733] | |||
| TREND(07Q1) | -7.94E-09 | ||||
| (9.5E-08) | |||||
| [-0.08314] |
Note: This table presents the coefficients for the long-run relationship (cointegration equation) and error correction mechanisms in the short run (only for asymmetric information). Standard errors in ( ) and t-statistics in [ ]. The estimates of error correction for control variables are available under request.
Source: own elaboration.
The optimal lag period for the relationship examined in this paper was two to eight quarters. For this study, we used the selection performed by the Schwarz information criteria, as it is more intuitive that the advertising investment effect that occurs in two quarters, although the long-term effect can occur in eight quarters.
The effective existence of cointegration is observed through trace and max tests, which indicate the number of possible cointegration ranks in the specified model. As shown in Table 4, the necessary convergence between the statistics was observed for at least five cointegration ranks. It confirmed the long-term relationship, even with the stationarity of the studied variables.
As predicted by the theoretical framework (Hasbrouck, 2007; Joshi & Hanssens, 2010), the most significant variables for the relationship with asymmetric information were advertising and return in all types of trends for long and short runs (Larsson, Lyhagen, & Lothgren, 2001), as shown in Table 4. Such a relationship has been observed in more stock returns (Du & Osmonbekov, 2020), sales, (Guenther & Guenther, 2020) and both (Bayer, Srinivasan, Riedl, & Skiera, 2020).
There is an interesting result regarding capital structure. The results of all types of specifications indicate a significant relationship with the D/E variable, consistent with greater access to financing by companies with more advertising expenditures verified by Ding et al. (2017) . This evidence is also presented in Kim et al. (2019) .
The M/B variable, which measures the value of shares in relation to the book value of equity and demonstrates the set of growth opportunities for corporations, presents results consistent with other studies (Chemmanur & Yan, 2017; Garcia-Zambrano, Rodriguez-Castellanos, & García-Merino, 2018). This is because investments in advertising preceding the initial public offering, as well as crises, generate lower returns in the long term. This is confirmed by the return variable, which measures the change in stock price, although there are short-term adjustments, as indicated by Mian et al. (2018) .
There are other comparisons for M/B and return va-riables. Results show a negative long-term relationship with sell_expenses/asset; thus, they are not consistent with the findings of other studies (Nguyen, Tran, & Baker, 2021; Kupfer & Schmidt, 2021), which that indicated value creation and abnormal returns derived from advertising.
5. Concluding remarks
Based on the theories of value creation through advertising and market microstructure, this paper examined the possible long-term relationship between advertising and asymmetric information in a sample of corporations listed in developing stock markets over 57 quarters.
Planning advertising actions includes strategic information that is only owned by the managers involved in this activity. Thus, there is an evident difference in information between managers and investors that could be anticipated by an information asymmetry measure, specifically the one used in this study.
Since 2007, by virtue of the harmonization of international accounting standards, advertising investments have been recorded as advertising expenses. Therefore, it was assumed that the advertising variable was measured using the selling expenses to total assets ratio, and the sample’s analysis period started in the first quarter of the year.
Marketing-finance interface studies have mainly examined data through panel data analysis. However, this phenomena can occur at lags greater than those admitted by the aforementioned models. Therefore, we examined corporate data using cointegration panel techniques. The assumption was that asymmetric information and advertising would have a positive and meaningful relationship.
The main theoretical implication of this research is the confirmation of the long-term relationship between asymmetric information and advertising, adjusted by short-term mechanisms. Thus, advertising campaigns can be anticipated by up to two quarters using the asymmetric information measure employed in this study. Marketing-finance interface studies may consider that the long-term effect of advertising begins before the execution of campaigns. The effects on current sales, taken as short-term effects, can also influence the operation of corporations.
This opens up the opportunity to apply cointegration techniques and time series in general to marketing-finance interface studies, assuming that time is a relevant factor for the complete capture of corporate phenomena.
This study has many practical implications. For managers, it is possible to monitor the anticipated effects of the intended campaign and, eventually, make adjustments even before its execution. For investors, monitoring information asymmetry makes it possible to anticipate the strategic movement of corporations, closely determined by advertising.
The companies' compliance activities gain additional prominence since their operations can be monitored by investors to anticipate advertising actions and to rebalance positions in shares or derivatives.
Evidently, this research had restrictions related to the extension of the assessed sample and selected market data. It is also possible to replicate this study for developed stock markets that already registered advertising investments as expenses in accounting.

