


 Inglês (pdf)
 Artigo em XML
 Referências do artigo
 Enviar este artigo por email
 Citado por SciELO
  Citado por Google
  Similares em
SciELO
Similares em
SciELO  Similares em Google
 Permalink
1. Introduction
According to the Efficient Markets Hypothesis (EMH), the random pattern with which new information reaches the market makes it improbable that any investor may consistently outperform the market index. This is because new information is incorporated into financial prices immediately and unbiasedly, and the magnitude and direction of price changes cannot be anticipated. That reasoning leads to the conclusion that financial prices reflect all relevant information to their valuation at all times (Fama, 1970). The EMH defines three forms of market efficiency. Weak-form efficiency implies that asset prices fully reflect all historical information on the assets’ prices, semi-strong-form efficiency suggests that asset prices display all publicly available information, while strong-form efficiency indicates that asset prices reflect all available information, whether such information is publicly available or not.
Notwithstanding the solid arguments behind the EMH and the empirical evidence that supports it, the literature has reported several market anomalies that potentially represent opportunities for investors to anticipate price movements, an outcome that opposes the weak form efficiency. Additionally, in his chronological research note on the EMH, Sewell (2011) found that less than half of the papers he reviews on the extensive literature support market efficiency.
From a theoretical point of view, Behavioral Finance challenges the EMH by claiming that the main cause of market anomalies is the irrationality with which investors make decisions (Mandaci, Taşkin, & Ergün, 2019), and Lo’s (2004) Adaptive Markets Hypothesis (AMH) attempts to reconcile the views of the EMH and Behavioral Finance (Lo, 2005) by suggesting that market anomalies may exist in the context of investors’ rational decision-making process.
Although both alternative approaches recognize the existence of market anomalies, Behavioral Finance ex-plains it as irrational behavior while the AMH does not contradict the principle of investors’ rational behavior but proposes a logical explanation for the odd nature of market anomalies. For that reason, this work has chosen the AMH as the theoretical tenant under which to test the presence of the DOW effect in Latin American markets.
Gregoriou, Kontonikas, & Tsitsianis (2004) argue that the DOW effect is the most persistent calendar anomaly of all. Recently, Zhang, Lai, & Lin (2017) examined this anomaly in the stock indices of 25 developed and emerging countries and concluded that it was present in all the indices. Tadepalli & Jain (2018) studied the DOW effect in several indices of the Indian equity market and found a widespread existence of such an anomaly. Winkelried & Iberico (2018) found the DOW effect in five of the six Latin American stock markets they examined. Villarreal-Samaniego, Santillán-Salgado, & Lagunes-Pérez (2022) concluded that the DOW effect was consistently present in the Mexican stock market’s returns and volatility.
Although a few studies on this subject have focused on emerging capital markets, most of them have centered their attention and interest on more developed ones. Furthermore, studies regarding the DOW effect and other calendar anomalies in Latin America adopt the static perspective implied by the EMH (e.g., Winkelried & Iberico, 2018) and not the dynamic approach suggested by the AMH. So, the central motivation of this study is to examine the DOW effect from the perspective of the AMH in some representative Latin American stock indices.
This research work contributes to the literature studying the DOW anomaly in six Latin American capital markets from the viewpoint of the AMH. Seemingly, this is the first time the DOW anomaly has been studied from that perspective in Latin America. The study’s empirical analysis is based on ARMA-GARCH specifications, while non-parametric Kruskal-Wallis tests account for the non-normality distribution in the time series returns.
The paper is organized as follows: section two reviews the relevant literature; section three describes the data and methodology; section four reports the empirical results; and section five concludes the paper.
2. Literature Review
Market anomalies reported in the literature challenge the EMH because they potentially create extraordinary profit opportunities for investors, in contradiction to the fundamental assumptions of weak-form market efficiency (Plastun, Sibande, Gupta, & Wohar, 2020). Although the literature has reported several calendar anomalies (e.g., Villarreal-Samaniego, Santillán-Salgado, & Lagunes-Pérez, 2022), and has studied them in Latin America (e.g., Rojas & Kristjanpoller, 2014) the present work focuses on the Day-of-the-Week effect (French, 1980) from the perspective of the AMH in a sample of six Latin American countries. While the DOW effect has been studied in the region before, this work represents an original contribution by introducing the interpretative standpoint of the AMH on the empirical evidence recovered from the analysis.
2.1 The Adaptive Markets Hypothesis
The AMH combines the theory of evolutionary psychology (Wilson, 1975) and the bounded rationality principle (Simon, 1982) to interpret financial markets activity. The AMH agrees with the EMH in that market participants act following their self-interest. However, the EMH does not consider it possible for investors to make mistakes, while the AMH considers that investors make them, but they learn and adapt. According to the AMH, the degree of market efficiency changes with the financial ecosystem, although markets remain competitive and adaptive. Time-varying market conditions, as well as the number of market participants and their ability to succeed, determine whether specific investment strategies are profitable or not (Rosini & Shenai, 2020). In brief, the AMH asserts that individuals act in their self-interest, make mistakes, learn, and-driven by competition and innovation-adapt to different environments. Also, that theory considers that natural selection shapes market ecology, and evolution determines market dynamics (Lo, 2005).
Some representative studies on the AMH include Kim, Shamsuddin, & Lim (2011) who examined the predictability of returns of the Dow Jones Industrial Average (DJIA) from 1990 to 2009 with variance ratio and automatic portmanteau tests using rolling windows to study whether market conditions drive market predictability. They found confirmatory evidence. Urquhart & Hudson (2013) report that, over the long run, the AMH describes stock returns better than the EMH in the United States, the United Kingdom, and Japan. Boya (2019) concluded that the French stock market exhibits sequential periods of both inefficiency and efficiency, an outcome that may be explained by the AMH.
2.2 The Day-of-the-Week Effect in Latin American Capital Markets and the AMH
The DOW anomaly implies that asset returns and volatility on a particular day of the week are significantly different from the average of the rest of the days. Zhang, Lai, & Lin (2017) used GARCH specifications to study the DOW anomaly in 28 stock markets from 25 countries and reported significant DOW effects in several of them. Plastun, Sibande, Gupta, & Wohar (2019) examined the Dow Jones Industrial Average (DJIA) index between 1900 and 2018 and concluded that the peak of the DOW anomalies for the DJIA took place during the mid- 20th century, and any significant evidence disappeared from the year 2000 onwards.
Rojas & Kristjanpoller (2014) studied the impact of the 1997 and 2008 financial crises on the DOW anomaly for the stock markets of Argentina, Brazil, Chile, Colombia, Mexico, and Peru and found it disappeared between June 2008 and August 2013, the last subperiod of the three they considered, arguably due to increased market efficiency.
Winkelried & Iberico (2018) studied the DOW effect for the same Latin American stock markets with extreme bounds analysis and reported that between 1995 and 2014 Monday average returns were significantly negative, while Friday average returns were the highest and statistically significant in five of the six markets.
The most frequently used theoretical framework in DOW anomaly studies is the EMH. However, several recent studies have opted for the AMH (e.g., Akhter & Yong, 2021). Similarly, the present study uses the theoretical framework of the AMH to study the DOW anomaly in Latin America.
3. Data and Methodology
3.1 Data
This paper examines six Latin American stock market indices: MERVAL (Argentina), BOVESPA (Brazil), IPSA (Chile), COLCAP (Colombia), IPC (Mexico), and ISBVL (Peru). The series span from July 1995 to June 2020, except for Colombia’s stock market index1, as in November 2013 the COLCAP replaced the IGBC as the main stock market index (Sierra, Duarte, & Rueda, 2015). The total period of observation was divided into five 5-year subsamples to obtain equal-length periods. However, since the IGBC and the COLCAP had differences in components, methodology, and data collection techniques that made these two indices dissimilar, the study does not extrapolate the behavior of the latter based on the former. So, the observations for the Colombian market were divided into one subsample of 2 years and ten months (from September 2007 to June 2010) and two 5-year subsamples (from July 2010 to June 2015 and from July 2015 to June 2020).
3.2 Methodological Issues
According to Yuan & Gupta (2014) , ARMA-GARCH models are the most popular to test for seasonality. The study uses ARMA (p,q)-GARCH (1,1) specifications. The general form of the models is:
 (1)
(1)
 (2)
(2)
Equation (1) is the mean equation of the ARMA-GARCH model, where r t represents the daily returns at time t, computed as the difference between the natural logarithm of the index price at day t and that of day t-1. Daily returns are dependent on their past values (r t-j ), a constant (α), an error term (ε t ), and past shocks (ε t-l ). In equation (2), the error term is considered to be a GARCH process where σ t 2 is a linear function of the last period’s squared error (ε t-1 2) and its own lagged value (σ t-1 2). The intercept is γ, while δ1 and λ1 describe the presence of heteroskedasticity in the series.
The study follows the approach of Borges (2009) to model seasonal anomalies, estimating five sets of mean and variance equations to identify specific DOW anomalies. Accordingly, Equation (1) was modified as follows:
 (3)
(3)
In Equation (3), i represents the day of the week, D i,t is a dummy variable that takes a value of 1 if the observation corresponds to the i-th day of the week, and a value of zero otherwise. For example, if the model includes a dummy variable for Monday, α represents the mean daily returns of the remaining days, while ꞵ1 represents the average excess return on Monday. The same logic holds for the coefficients ꞵ2, ꞵ3, ꞵ4, and ꞵ5, which identify other DOW effects. A t-test for ꞵ i is used to establish whether a particular DOW anomaly is significantly different from zero.
Despite its favorable attributes, the ARMA-GARCH model cannot capture the non-normality of the data. Thus, the study uses a non-parametric Kruskal-Wallis (K-W) test to examine the differences between the returns on a specific day of the week and other days. Equation (4) represents the K-W model:
 (4)
(4)
where N is the total number of observations, R j ² is the average rank of observations in the j-th group, k is the number of groups, and n j is the total number of observations in the j-th group.
3.3 Subsamples and Market Condition Classifications
Following Xiong, Meng, Li, & Shen (2019) this study examines the behavior of the Day-of-the-Week effect dividing the data into five 5-year subsamples, except for the COLCAP, as mentioned previously. These equal-length subsamples provide enough observations to obtain reliable results.
Although the AMH postulates that the predictability of returns changes with market conditions (Lo, 2004), it is not explicit about which are the indicators of such conditions (Kim et al., 2011). Following Fabozzi & Francis (1977) , the study splits the data into Up and Down months. Months in which the average return was non-negative were classified as Up periods, and months with a negative average return were defined as Down periods. The ARMA-GARCH model is then used to determine the presence of the DOW effect under such market conditions.
This research work also used the definition of bull, bear, and normal markets proposed by Klein & Rosenfeld (1987) to examine the DOW effect: a month is categorized as a substantial market mover when the absolute value of the monthly return of a particular index is greater than one-half of that index monthly returns’ standard deviation over the observation period. Thus, the study classifies the sample into bear, bull, and normal categories considering the trend, or the lack thereof, implied in this classification. For example, if a market index’s return increases or is normal in a particular month while it presents a bearish pattern in the previous and following months, this month is said to be bearish. Accordingly, to re-classify a market there must be at least two successive considerable movements in the same direction, as defined by Klein & Rosenfeld (1987).
4. Results
4.1 Graphical Analysis and Descriptive Statistics
Figure 1 depicts the full-sample daily returns of the six indices, where the presence of volatility clusters is evident in different periods. This behavior strongly suggests the existence of heteroskedasticity and justifies the use of GARCH-type models2. Table 1 shows descriptive statistics and confirms that returns do not adjust to a normal distribution. The Augmented Dickey-Fuller (ADF), Phillips-Perron (PP), and Kwiatkowski-Phillips-Schmidt-Shin (KPSS) tests confirm all series are stationary3.
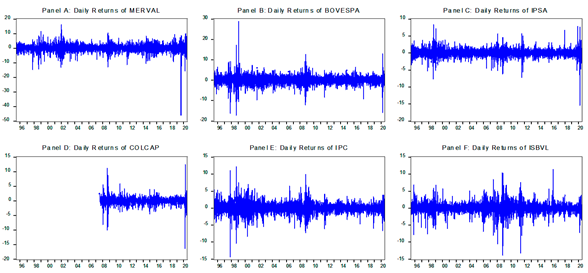
Table 1 Descriptive statistics of the indices’ daily returns.
| Argentina | Brazil | Chile | Colombia | Mexico | Peru | |
|---|---|---|---|---|---|---|
| Index | MERVAL | BOVESPA | IPSA | COLCAP | IPC | ISBVL |
| Full period | 07/01/1995 - 06/30/2020 | 07/01/1995 - 06/30/2020 | 07/01/1995 - 06/30/2020 | 09/01/2007 - 06/30/2020 | 07/01/1995 - 06/30/2020 | 07/01/1995 - 06/30/2020 |
| Mean | 0,07417 | 0,05291 | 0,02093 | 0,00217 | 0,04526 | 0,03960 |
| Median | 0,12795 | 0,10426 | 0,02023 | 0,02122 | 0,05255 | 0,03819 |
| Maximum | 16,11651 | 28,81763 | 11,78472 | 12,46974 | 12,15364 | 14,73889 |
| Minimum | -46,06238 | -17,22924 | -15,39114 | -16,29032 | -14,31388 | -13,85580 |
| Std. Dev. | 2,30901 | 2,03079 | 1,10502 | 1,20635 | 1,39820 | 1,46574 |
| Skewness | -1,63378 | 0,07880 | -0,48952 | -1,05318 | 0,02251 | -0,33048 |
| Kurtosis | 32,96799 | 16,47019 | 19,51980 | 32,59327 | 10,49375 | 14,39112 |
| Jarque-Bera | 232679,70 *** | 46766,55 *** | 71044,41 *** | 114645,80 *** | 14701,79 *** | 33899,40 *** |
Note: ***, **, and * denote significance levels of 1%, 5%, and 10%, respectively.
Source: own elaboration.
Table 2 presents the mean, median, and standard deviation of the returns for each day of the week and the rest of the days. The mean significance levels refer to Welch’s F-test, which assumes normality but is robust when the homogeneity of variance assumption does not hold. The median significance levels refer to the Kruskal-Wallis test. Although the K-W test does not assume normality, it requires the assumption of equal variance (Vargha & Delaney, 1998). Thus, following Khan, Aqil, Alam Kazmi, & Zaman (2021) , Table 2 considers both tests to account for non-normality and heteroskedasticity in the series. The results reveal a significant Weekend effect, defined as the combination of the Monday and Friday anomalies, in the IPSA and ISBVL and a significant and robust Monday anomaly in the BOVESPA and COLCAP. The latter also shows a significant Wednesday effect. Although the study found evidence of a Weekend effect in the MERVAL and the IPC, average return differences with other days of the week were not significant according to the K-W test.
Table 2 Descriptive statistics of the DOW effect.
| MERVAL | BOVESPA | IPSA | |||||||
|---|---|---|---|---|---|---|---|---|---|
| Mean | Std. Dev. | K-W | Mean | Std. Dev. | K-W | Mean | Std. Dev. | K-W | |
| Monday | -0,1034 *** | 2,8177 | 2,504 | -0,0723 ** | 2,1576 | 5,633 ** | -0,1327 *** | 1,2705 | 38,225 *** |
| Rest of the days | 0,1153 | 2,1725 | 0,0842 | 1,9969 | 0,0582 | 1,0577 | |||
| Tuesday | 0,0551 | 2,1864 | 0,365 | 0,1395 * | 1,9350 | 0,706 | -0,0038 | 1,0426 | 3,515 * |
| Rest of the days | 0,0791 | 2,3396 | 0,0313 | 2,0536 | 0,0272 | 1,1203 | |||
| Wednesday | 0,1295 | 2,1828 | 1,317 | 0,1057 | 1,9391 | 1,054 | 0,0429 | 1,1241 | 1,477 |
| Rest of the days | 0,0599 | 2,3405 | 0,0394 | 2,0535 | 0,0153 | 1,1002 | |||
| Thursday | 0,0920 | 2,2657 | 0,024 | -0,0441 * | 2,1268 | 0,295 | 0,0551 | 1,0738 | 3,208 * |
| Rest of the days | 0,0697 | 2,3201 | 0,0769 | 2,0058 | 0,0123 | 1,1127 | |||
| Friday | 0,1858 * | 2,0485 | 0,703 | 0,1346 | 1,9791 | 1,089 | 0,1406 *** | 0,9796 | 25,158 *** |
| Rest of the days | 0,0462 | 2,3691 | 0,0326 | 2,0431 | -0,0086 | 1,1320 | |||
| COLCAP | IPC | ISBVL | |||||||
| Mean | Std. Dev. | K-W | Mean | Std. Dev. | K-W | Mean | Std. Dev. | K-W | |
| Monday | -0,1659 *** | 1,4273 | 10,274 *** | -0,0314 ** | 1,4997 | 2,449 | -0,0514 ** | 1,6473 | 11,301 *** |
| Rest of the days | 0,0367 | 1,1530 | 0,0640 | 1,3718 | 0,0625 | 1,4158 | |||
| Tuesday | 0,0542 | 1,1844 | 0,358 | 0,0704 | 1,4208 | 0,038 | -0,0177 | 1,3361 | 4,910 ** |
| Rest of the days | -0,0116 | 1,2120 | 0,0388 | 1,3924 | 0,0541 | 1,4966 | |||
| Wednesday | 0,0870 ** | 1,2510 | 7,550 *** | 0,1040 * | 1,3842 | 2,994 | 0,0378 | 1,4484 | 0,498 |
| Rest of the days | -0,0203 | 1,1935 | 0,0303 | 1,4015 | 0,0400 | 1,4702 | |||
| Thursday | 0,0021 | 1,1719 | 0,003 | 0,0324 | 1,4292 | 0,106 | 0,0338 | 1,4737 | 0,427 |
| Rest of the days | 0,0022 | 1,2154 | 0,0484 | 1,3905 | 0,0410 | 1,4639 | |||
| Friday | 0,0020 | 0,9845 | 0,115 | 0,0482 | 1,2439 | 0,114 | 0,1992 *** | 1,3940 | 18,145 *** |
| Rest of the days | 0,0022 | 1,2572 | 0,0445 | 1,4340 | 0,0006 | 1,4803 |
Note: ***, **, and * denote significance levels of 1%, 5%, and 10%, respectively.
Source: own elaboration.
4.2 Time-Varying Pattern of the DOW Effect
Table 3 reports the coefficients (β) of the conditional mean equations of the ARMA-GARCH models corres-ponding to the dummy variables of each day of the week, and the results of the K-W test for each index. Only the stock market indices of Argentina and Mexico did not present any significant DOW effect during the 1995-2020 sample period. Furthermore, the Argentine index did not show any evidence of the DOW anomaly in the 5-year subsamples either, in line with the EMH’s weak form propositions. These outcomes generally agree with those reported by Kristjanpoller (2012) and Winkelried & Iberico (2018) .
Table 3 Subsample analysis of the DOW effect.
| Monday | Tuesday | Wednesday | Thursday | Friday | ||||||
|---|---|---|---|---|---|---|---|---|---|---|
| β | K-W | β | K-W | β | K-W | β | K-W | β | K-W | |
| MERVAL | ||||||||||
| 1995 - 2020 | -0,09449 | 2,504 | -0,08565 | 0,365 | 0,11078 * | 1,317 | 0,05242 | 0,024 | 0,01758 | 0,703 |
| 1995 - 2000 | -0,15131 | 0,575 | -0,02495 | 1,117 | 0,02973 | 0,068 | 0,03749 | 0,593 | 0,10515 | 0,507 |
| 2000 - 2005 | -0,09767 | 0,051 | -0,09132 | 0,119 | -0,01924 | 0,022 | 0,14144 | 0,000 | 0,06252 | 0,173 |
| 2005 - 2010 | -0,02232 | 0,017 | -0,16106 | 0,638 | 0,18374 | 1,711 | -0,03297 | 0,031 | 0,03605 | 0,047 |
| 2010 - 2015 | -0,15873 | 0,861 | -0,01733 | 0,029 | 0,11204 | 0,007 | -0,02446 | 0,000 | 0,09189 | 0,944 |
| 2015 - 2020 | -0,12881 | 2,041 | -0,06819 | 1,197 | 0,10435 | 1,964 | 0,17470 | 1,454 | -0,06254 | 0,026 |
| BOVESPA | ||||||||||
| 1995 - 2020 | -0,10848 ** | 5,633 ** | -0,00568 | 0,706 | 0,09266 ** | 1,054 | -0,02837 | 0,295 | 0,04602 | 1,089 |
| 1995 - 2000 | -0,21035 * | 0,928 | -0,00544 | 0,639 | 0,10223 | 0,060 | -0,10452 | 1,077 | 0,21147 * | 2,059 |
| 2000 - 2005 | -0,24404 * | 4,642 ** | -0,02585 | 0,062 | 0,09982 | 0,000 | -0,00456 | 0,108 | 0,17225 | 4,348 ** |
| 2005 - 2010 | -0,05051 | 0,558 | -0,10504 | 0,019 | 0,25752 ** | 4,428 ** | -0,16023 | 0,755 | 0,04492 | 0,141 |
| 2010 - 2015 | -0,04358 | 0,130 | -0,02987 | 0,000 | 0,00901 | 0,052 | 0,08135 | 0,747 | -0,01879 | 0,072 |
| 2015 - 2020 | -0,11024 | 0,901 | 0,12626 | 2,557 | 0,05132 | 0,908 | 0,00454 | 0,233 | -0,07007 | 1,287 |
| IPSA | ||||||||||
| 1995 - 2020 | -0,16322 *** | 5,418 *** | -0,00246 | 0,891 | 0,02976 | -0,791 | 0,00821 | -1,227 | 0,12758 *** | -4,251 *** |
| 1995 - 2000 | -0,33948 *** | 15,992 *** | -0,02135 | 0,124 | 0,02939 | 0,976 | 0,03095 | 0,050 | 0,30282 *** | 12,994 *** |
| 2000 - 2005 | -0,22954 *** | 11,921 *** | -0,01882 | 1,675 | -0,00106 | 0,013 | 0,06986 | 3,359 * | 0,17191 *** | 7,611 *** |
| 2005 - 2010 | -0,04914 | 2,386 | -0,06364 | 2,214 | 0,09662 | 1,623 | -0,02598 | 1,029 | 0,04188 | 0,521 |
| 2010 - 2015 | -0,16533 *** | 7,573 *** | 0,01850 | 0,025 | 0,05140 | 0,525 | -0,03666 | 0,046 | 0,13844 *** | 3,853 ** |
| 2015 - 2020 | -0,09016 * | 3,428 * | 0,02792 | 0,809 | 0,00971 | 0,102 | 0,00246 | 1,377 | 0,04686 | 3,512 * |
| COLCAP | ||||||||||
| 2007 - 2020 | -0,09590 ** | 10,274 *** | 0,01371 | 0,358 | 0,11599 *** | 7,550 *** | -0,05107 | 0,003 | -0,00432 | 0,115 |
| 2007 - 2010 | -0,15700 | 2,511 | -0,05168 | 0,048 | 0,19881 *** | 0,281 | -0,06738 | 0,224 | 0,07375 | 2,665 |
| 2010 - 2015 | -0,13002 ** | 5,867 ** | 0,08573 | 2,365 | 0,08182 | 1,531 | -0,13002 ** | 0,235 | -0,00628 | 1,019 |
| 2015 - 2020 | -0,04206 | 2,156 | -0,02511 | 0,128 | 0,10833 ** | 7,315 *** | -0,03502 | 0,028 | -0,01767 | 0,741 |
| IPC | ||||||||||
| 1995 - 2020 | 0,00529 | 2,449 | -0,01844 | 0,038 | 0,03811 | 2,994 * | -0,02420 | 0,106 | -0,00239 | 0,114 |
| 1995 - 2000 | -0,21186 * | 4,224 ** | -0,05455 | 0,461 | 0,19629 ** | 2,708 * | 0,05134 | 0,217 | 0,02809 * | 0,400 |
| 2000 - 2005 | -0,06992 | 2,409 | 0,07451 | 0,396 | 0,08245 | 0,005 | 0,06716 | 1,195 | -0,05281 | 0,008 |
| 2005 - 2010 | 0,10201 | 0,013 | -0,05256 | 0,162 | 0,10619 | 1,454 | -0,07080 | 0,281 | -0,08528 | 0,158 |
| 2010 - 2015 | 0,01893 | 0,083 | -0,05324 | 0,058 | 0,03556 | 0,006 | -0,02204 | 0,040 | 0,01991 | 0,422 |
| 2015 - 2020 | 0,03312 | 0,083 | 0,01896 | 0,510 | -0,00901 | 0,705 | -0,06432 | 3,456 * | 0,02229 | 0,278 |
| ISBVL | ||||||||||
| 1995 - 2020 | -0,08937 *** | 11,301 *** | -0,07312 ** | 4,910 ** | 0,03067 | 0,498 | 0,00828 | 0,427 | 0,12236 *** | 18,145 *** |
| 1995 - 2000 | -0,21695 *** | 5,933 ** | -0,00941 | 0,506 | -0,05476 | 0,247 | 0,02865 | 0,015 | 0,26571 *** | 14,450 *** |
| 2000 - 2005 | -0,09348 | 2,210 | -0,09809 * | 3,302 * | -0,01683 | 0,220 | 0,03606 | 0,907 | 0,17141 *** | 8,066 *** |
| 2005 - 2010 | 0,09583 | 0,035 | -0,12743 | 1,115 | 0,17742 ** | 1,344 | -0,21190 ** | 0,958 | 0,09466 | 0,455 |
| 2010 - 2015 | -0,06711 | 6,154 ** | -0,09477 | 0,044 | -0,00226 | 0,500 | 0,05442 | 2,626 | 0,11090 * | 3,240 * |
| 2015 - 2020 | -0,13093 *** | 3,264 * | -0,04280 | 1,532 | 0,11442 ** | 3,006 * | 0,03684 | 0,301 | 0,02025 | 0,602 |
Note: ***, **, and * denote significance levels of 1%, 5%, and 10%, respectively.
Source: own elaboration.
In the subperiod analysis, the study found evidence that supports the presence of a Monday effect in five of the indices, along with a Friday anomaly in three of them. The results also revealed a Wednesday regularity in four indices and a Thursday effect in one. The Weekend effect disappeared and reappeared in the IPSA, and the same was true for the Monday anomaly in the ISBVL. Similarly, The DOW anomaly also emerged, declined, and reappeared in different subperiods in the case of the COLCAP. Thus, the analysis found significant evidence for the AMH in the stock market indices of Chile, Peru, and Colombia. The absence of the DOW during the last two subperiods in the Brazilian and Mexican stock indices suggests an increase in their weak form efficiency, as previously reported by Kristjanpoller & Arenas (2015) and Rojas & Kristjanpoller (2014) .
4.3 The DOW Effect Under Different Market Conditions
After filtering the indices returns according to the Up-Down market classification approach, the study examined the behavior of the DOW effect using ARMA-GARCH models and Kruskal-Wallis tests. Table 4 reports the results of the analysis.
Table 4 Results of the Day-of-the-Week effect under Up and Down conditions.
| Monday | Tuesday | Wednesday | Thursday | Friday | ||||||
|---|---|---|---|---|---|---|---|---|---|---|
| β | K-W | β | K-W | β | K-W | β | K-W | β | K-W | |
| MERVAL | ||||||||||
| Up | 0,06669 | 0,626 | -0,10446 | 3,260 * | 0,05057 | 1,027 | -0,00475 | 0,039 | -0,00566 | 0,031 |
| Down | -0,42462*** | 11,217 *** | 0,04727 | 1,018 | 0,16603 * | 0,324 | 0,10745 | 0,008 | 0,09952 | 2,448 |
| BOVESPA | ||||||||||
| Up | -0,06842 | 1,576 | -0,00791 | 0,000 | 0,07374 | 1,006 | -0,02122 | 0,257 | 0,02004 | 0,531 |
| Down | -0,18500 ** | 4,196 ** | 0,02385 | 1,395 | 0,11434 | 0,156 | -0,02374 | 0,184 | 0,06916 | 0,820 |
| IPSA | ||||||||||
| Up | -0,07807 ** | 8,946 *** | -0,04640 | 7,723 *** | 0,05342 * | 1,548 | -0,01494 | 0,726 | 0,08408 *** | 13,677 *** |
| Down | -0,27331 *** | 37,076 *** | 0,06460 | 0,045 | -0,00269 | 0,244 | 0,00795 | 2,580 | 0,19967 *** | 13,798 *** |
| COLCAP | ||||||||||
| Up | -0,07735 | 4,402 ** | 0,04880 | 1,529 | 0,07364 | 2,476 | -0,03174 | 0,034 | -0,03302 | 0,498 |
| Down | -0,15867 ** | 6,887 *** | -0,04075 | 0,095 | 0,14340 ** | 5,008 ** | 0,00564 | 0,019 | 0,03444 | 0,130 |
| IPC | ||||||||||
| Up | 0,02271 | 1,623 | -0,01246 | 0,517 | 0,07085 * | 4,188 ** | -0,05201 | 0,030 | -0,03053 | 0,010 |
| Down | -0,07036 | 0,997 | -0,00580 | 0,059 | -0,01458 | 0,067 | 0,04359 | 0,041 | 0,04772 | 0,475 |
| ISBVL | ||||||||||
| Up | -0,01377 | 2,556 | -0,10430 *** | 6,705 *** | 0,05403 | 1,578 | 0,01256 | 0,039 | 0,05213 | 10,043 *** |
| Down | -0,17889 *** | 10,446 *** | -0,03520 | 0,409 | 0,00832 | 0,088 | -0,02225 | 1,270 | 0,21579 *** | 9,395 *** |
Note: ***, **, and * denote significance levels of 1%, 5%, and 10%, respectively.
Source: own elaboration.
The Monday effect was significant in all stock market indices during Down periods, except for the Mexican stock index. Interestingly, while the subsample analysis did not find any evidence of the DOW effect in the MERVAL, the results of the Up-Down analysis reveal a highly significant Monday effect in that index. The Wednesday effect is significant during Down months in the COLCAP. The results evidence a Friday effect in the ISBVL during Up months and a very significant Weekend effect during Down months. The IPSA presented a significant Weekend effect for both Up and Down periods. The Monday effect is more pronounced during Down periods, while the Friday effect is more prominent during Up periods. The K-W test indicates a significant Tuesday anomaly in the Chilean stock index during Up months.
Table 5 reports the results of the ARMA-GARCH model and the K-W test according to the bull, bear, and normal conditions proposed by Klein & Rosenfeld (1987) .
Table 5 Results of the Day-of-the-Week effect under bull, normal, and bear market conditions.
| Monday | Tuesday | Wednesday | Thursday | Friday | ||||||
|---|---|---|---|---|---|---|---|---|---|---|
| β | K-W | β | K-W | β | K-W | β | K-W | β | K-W | |
| MERVAL | ||||||||||
| Bull | 0,05000 | 0,057 | -0,08727 | 1,388 | 0,02904 | 0,594 | -0,01476 | 0,249 | 0,02742 | 0,105 |
| Bear | -0,65171 *** | 9,802 *** | 0,14441 | 2,558 | 0,11387 | 0,105 | 0,12814 | 0,000 | 0,27503 | 3,118 * |
| Normal | -0,02544 | 0,210 | -0,11946 | 1,095 | 0,11833 * | 1,484 | -0,00880 | 0,035 | 0,03563 | 0,212 |
| BOVESPA | ||||||||||
| Bull | 0,03146 | 0,216 | -0,03630 | 1,369 | 0,08591 | 0,395 | -0,16353 * | 1,189 | 0,07732 | 1,364 |
| Bear | -0,32596 * | 5,556 ** | 0,21974 | 3,537 * | 0,16691 | 1,089 | -0,04909 | 0,012 | -0,00893 | 0,207 |
| Normal | -0,12472 * | 6,176 ** | -0,00582 | 1,425 | 0,07965 | 0,120 | 0,02124 | 0,037 | 0,02604 | 0,563 |
| IPSA | ||||||||||
| Bull | -0,11001 ** | 5,010 ** | -0,03451 | 2,615 | 0,03071 | 0,016 | 0,01037 | 0,624 | 0,10355 ** | 10,376 *** |
| Bear | -0,21728 *** | 11,881 *** | 0,01497 | 0,813 | 0,02014 | 0,124 | -0,02053 | 2,948 * | 0,19706 *** | 5,138 ** |
| Normal | -0,16627 *** | 26,298 *** | 0,00590 | 0,534 | 0,01959 | 2,685 | 0,01762 | 0,396 | 0,12176 *** | 12,491 *** |
| COLCAP | ||||||||||
| Bull | -0,03901 | 2,043 | 0,07243 | 0,626 | -0,00221 | 0,038 | -0,03664 | 0,188 | -0,00232 | 0,010 |
| Bear | -0,16673 * | 7,060 *** | -0,02530 | 0,297 | 0,17411 * | 4,607 ** | -0,01674 | 0,576 | 0,01196 | 0,948 |
| Normal | -0,08592 | 2,609 | -0,02160 | 0,069 | 0,13970 *** | 4,755 ** | -0,06913 | 0,604 | 0,02153 | 0,121 |
| IPC | ||||||||||
| Bull | -0,02981 | 1,052 | -0,00651 | 0,224 | 0,09573 * | 3,974 ** | -0,00750 | 0,000 | -0,05475 | 0,266 |
| Bear | -0,16073 | 4,039 ** | 0,18946 * | 1,783 | -0,02986 | 0,000 | -0,08909 | 0,027 | 0,07988 | 0,662 |
| Normal | 0,01631 | 0,051 | -0,02937 | 0,469 | 0,01828 | 0,514 | -0,00662 | 0,079 | 0,00197 | 0,227 |
| ISBVL | ||||||||||
| Bull | 0,06986 | 0,011 | -0,08311 | 1,822 | -0,02313 | 0,000 | -0,04756 | 0,028 | 0,07995 | 1,750 |
| Bear | -0,25966 *** | 7,005 *** | 0,08405 | 0,230 | 0,09047 | 0,361 | 0,01341 | 0,153 | 0,07874 | 1,426 |
| Normal | -0,11201 *** | 8,090 *** | -0,09243 *** | 6,731 *** | 0,02583 | 0,330 | 0,01744 | 0,376 | 0,15822 | 18,373 *** |
Note: ***, **, and * denote significance levels of 1%, 5%, and 10%, respectively.
Source: own elaboration.
The Monday effect was statistically significant for all stock indices under bear market conditions, but particularly so for the IPSA and ISBVL. There is a significant Weekend effect in normal conditions in the Chilean and Peruvian stock indices, and a Wednesday effect was present in the Colombian market index.
In summary, the six stock indices show the Monday effect in at least one of the declining market definitions (i.e., Down or bear), although the IPC is the one that shows less clear evidence in this regard. The IPSA and the ISBVL show a strong presence of the Weekend effect. In the former, under any orientation of the market and, in the latter, the anomaly tends to be stronger during declining market conditions. The BOVESPA, IPC, and MERVAL indices show the fewest anomalies under different market conditions.
5. Discussion and Conclusions
This paper examines whether the Day-of-the-Week effect conforms to the Adaptive Markets Hypothesis in six Latin American stock market indices. Specifically, the study investigates the time-varying behavior of the DOW effect in such indices and examines which market conditions are most influential for that anomaly. The results suggest that the behavior of the DOW effect varies over time and that certain market conditions are more suitable to its existence, all of which are evidence for the AMH.
The study found the presence of the DOW effect in Latin American stock market indices. More specifically, in the subsample analysis, the Monday anomaly was statistically significant in five markets and the Weekend anomaly in three of them, while the Wednesday anomaly existed in four. In contrast, no DOW anomalies were identified in the Argentine stock index, while the presence of such effects in the Mexican market index was not strong. In general, the study’s results agree with those described by Kristjanpoller (2012) , who reported the presence of the DOW effect in Latin American stock markets, except for the Mexican stock exchange. The findings also generally agree with the results obtained by Winkelried & Iberico (2018) , who concluded that Monday returns are significantly the lowest and negative in the same six Latin American markets, while Friday average returns are statistically positive and the highest, except for the Mexican stock market.
The foundation of all previous studies on the DOW effect in Latin American stock markets is the EMH, while the innovation proposed in the present research consists in examining that anomaly from the perspective of the AMH. Thus, to study whether the presence of the DOW effect corresponds to the ideas proposed by the AMH, we use ARMA-GARCH specifications and the Kruskal-Wallis test on five 5-year subperiods for all stock indices, except in the case of the Colombian index due to the data availability limitations described before. All indices show negative Monday average returns and positive Friday average returns throughout the subperiod analysis. However, their statistical significance varies over time.
The DOW anomaly disappears and reappears in the Chilean, Colombian, and Peruvian market indices for different subperiods. These results agree with the findings reported by Arbeláez García & Rosso (2016) , who found the anomaly in these three markets. However, the same outcomes diverge from the findings reported by Rojas & Kristjanpoller (2014) , who reported that the DOW effect disappeared from Latin American stock markets between 2008 and 2013, the last period of their analysis.
The time-changing behavior of the DOW effect found in this study has been previously reported for the stock markets in countries such as the United States (Urquhart & McGroarty, 2014), the United Kingdom (Rosini & Shenai, 2020), China (Xiong et al., 2019), and Nigeria (Adaramola & Adekanmbi, 2020), and tends to support the AMH. Interestingly, however, the Argentine stock market index exhibits no evidence of the DOW effect for any of the subperiods. This finding agrees with the results reported by Winkelried & Iberico (2018) , for the period between 2002 and 2007, and with those described by Marques (2014) from 2002 to 2012.
The Mexican stock index shows the presence of the DOW anomaly only during the first subperiod, 1995-2000, while it is present in the Brazilian market index only until 2005-2010, the antepenultimate subperiod. These outcomes tend to support the argument of increasing weak-form market efficiency in those countries’ stock indices and are consistent with those reported by Kristjanpoller & Arenas (2015) and Rojas & Kristjanpoller (2014) . So, this study’s findings suggest that the larger the market capitalization, the smaller the presence of the DOW anomalies. However, while the Argentine market capitalization is considerably smaller than that of the Chilean market (The World Bank Group, 2022), the latter consistently presents the DOW effect.
It is also worth mentioning that the 2015-2020 subperiod of this study comprises the first months of the COVID-19 pandemic4, an event that considerably disturbed Global financial markets. Nevertheless, it is unsound trying to draw any conclusions about the adaptability of Latin American stock indices’ returns during the COVID-19 pandemic because, in the last subperiod and according to the study’s research design, observations corresponding to the pre-pandemic and pandemic intervals are mixed. So, this is an issue beyond the scope of this paper, and it remains open for further research. Additionally, the use of market indices implies certain limitations. For instance, the six market indices are value-weighted, which is considered a more representative approach than other calculation alternatives. Frequently, though, a few large-capitalization companies’ returns greatly influence the performance of this type of indices5.
The AMH asserts that the predictability of asset returns changes with the state of the market; therefore, we investigate the behavior of the DOW effect in different market conditions. We group each index return time series into Up and Down categories (Fabozzi & Francis, 1977) and bull, normal, and bear market orientations (Klein & Rosenfeld, 1987). After classifying the different periods under each approach, we ran the ARMA-GARCH model and the K-W test. The statistical evidence suggests that all the indices, except for the IPC, present a Monday effect, which seems to be the predominant DOW anomaly, as previously reported by Gregoriou et al. (2004) .
The Monday effect is present in the six stock indices under bear market conditions, although only the K-W test shows its presence in the Mexican stock index. This finding coincides with the outcomes obtained for other countries’ stock markets, such as the United States (Urquhart & McGroarty, 2014), China (Zhang et al., 2017), Bangladesh (Akhter & Yong, 2021), Mauritius, Morocco, and Nigeria (Obalade & Muzindutsi, 2019). A possible explanation for the Monday anomaly is that investors are more perceptive to government policy announcements at weekends in declining market conditions (Zhang et al., 2017). Another possibility is the “parking-the-proceeds hypothesis” (Ritter, 1988, p. 701 ) which asserts that, after realizing losses, investors keep hold of their funds temporarily before reinvesting, a strategy that could be considered particularly sound during declining market conditions.
The Weekend effect is significant in the IPSA in both Up and Down months, whereas this anomaly is present in the ISBVL only under a Down condition of the market. The Weekend effect is also statistically relevant in the IPSA and ISBVL in normal conditions. These results agree with those presented by Kristjanpoller & Muñoz (2012) for the Chilean and Peruvian stock markets but differ in the case of the remaining Latin American stock indices.
In summary, the results suggest a time-varying behavior of the DOW effect through subsample analysis in four of the six Latin American stock indices, which supports the AMH. The exceptions are the Argentine and Mexican stock indices since the results on the absence of the DOW anomaly are more in line with the weak form of market efficiency and agree with Marques' (2014) findings. The analysis also shows that such an anomaly exists in the six market indices and changes with the orientation of the market. This finding is also evidence for the AMH.
In general, the time-changing DOW effect pattern of the larger-capitalization Latin American stock markets’ indices is consistent with the weak form of the EMH. However, that is not the case for the smaller-capitalization markets’ indices, nor under different market conditions in all cases, where the AMH seems a more realistic theory to explain the DOW effect. Thus, investors should consider a possible adaptive behavior of those stock indices. For example, an investor trading in the IPSA could benefit from following the classical variant of the Day-of-the-Week anomaly (Plastun et al., 2019) if they sell at Friday’s close price and closes their position at Monday’s close price in any market orientation. Another trader could benefit from following the same strategy in MERVAL, BOVESPA, COLCAP, and ISBVL but only during Down market conditions and, in the latter, also under bear market conditions. The economic significance of such strategies, however, goes beyond the scope of this paper and is subject to additional research. Further investigation is needed to validate the AMH in Latin American stock markets by employing other methodologies and approaches. Moreover, since this study focused exclusively on the DOW effect, more research is necessary to examine other calendar anomalies, such as the Holiday and Turn-of-the-Month effects in those markets.

