


 Inglês (pdf)
 Artigo em XML
 Referências do artigo
 Enviar este artigo por email
 Citado por SciELO
  Citado por Google
  Similares em
SciELO
Similares em
SciELO  Similares em Google
 Permalink
1. Introduction
Moral hazard may appear in the corporate credit contract base on four categories: asset substitution, inadequate effort supply, underinvestment, and alternative use of the credit granted. These serve as the basis for building moral hazard ratios (Castillo et al., 2018). They can be used to measure the effect of moral hazard on credit risk by considering the positive coefficients of the logistic regression on the probability of default (Castillo et al., 2021). However, such ratios have not been used yet on the probability of default of a credit portfolio. Thus, the base models of the authors mentioned above will be used in the present paper. This research topic is relevant since the guarantee, when granted by a third party, acts as collateral that does not solve moral hazard problems (Menkhoff et al., 2011); and this has been the role of Colombia's National Guarantee Fund (Fondo Nacional de Garantías de Colombia - FNG), which has been fundamental in the mobilization of credits to SMEs (Castillo & Girón, 2014). The effect of moral hazard in the SME credit portfolio, guaranteed by the FNG, could be appreciated comparatively considering the probabilities of default with and without the moral hazard ratios within the logistic model and from there within the copula.
In this paper, three sections follow the introduction. Section 2 presents the related literature on collateral and moral hazard, and copulas. Section 3 presents the empirical work to compare the probabilities of default in a portfolio calculated with and without the moral hazard ratios, and finally, Section 4 presents the conclusions.
2. Theoretical background
2.1 Collateral and moral hazard
Collateral is the bank's right over the borrower's assets in case of bankruptcy. It is an alternative resource for paying the debt beyond the cash flows (Tirole, 2005). One of the main reasons why banks use guarantees is that they reduce the risk of credit loss in default situations (Godlewski a Weill, 2011). It also prevents companies from accessing financing while others do not (credit rationing) (Besanko & Thakor, 1987).
Credit rationing occurs because the lender is im-perfectly informed of the characteristics and behavior of the borrower when accessing credit, known as asymmetric information. Under a scenario of asymmetric information, the collateral, prior to the signing of the credit agreement, serves as a differentiator (screening) between good and bad borrowers, mitigating adverse selection problems and, once the credit is granted, can act as a driver of the effort needed in activities that require financing, that is, to reduce moral hazard problems. (Agarwal et al., 2015).
Moral hazard refers to conflicts of interest that arise in the development of a contractual relationship where one of the parties (Agent) may engage in conduct that goes against the benefit of the other (Principal). An example of this can be found in the insurance field, where someone ensures an asset and, therefore, has less incentive to maintain it properly. The insurance company usually cannot monitor or verify the behavior of the insured (Lee & Shin, 2008), which means that moral hazard has retrospective effects (Mirrlees, 1999).
Regarding the issue of moral hazard in credit, there is a body of theoretical work, as in Csóka et al. (2015) and empirical works, such as Uesugi et al. (2010) and Castillo et al. (2018) , among others. These last authors incorporate variables to measure moral hazard within the framework of credit risk. These variables are defined with a positive sign and within four categories: i) asset substitution, aimed at seeking investments with higher risk and better returns; ii) low effort, characterized by high costs and expenses; iii) underinvestment, characterized by the use of financial resources for non-operating expenses; and iv) different use of the invested capital, when the financing resource is used for activities other than those established in the credit agreement. Similarly, Castillo et al. (2021) established an index to measure and monitor the influence of moral hazard on short-term credit performance for SMEs. However, the moral hazard variable within the calculation of the probability of default of a credit portfolio has not been used yet. This is the situation in which the National Guarantee Fund of Colombia is immersed in its role of SME credit guarantor when it needs to calculate the probability of default of its portfolio, given that the institution works as a guarantee provided by a third party, and this type of guarantee does not solve moral hazard problems (Menkhoff et al., 2011). Thus, the calculation of the probability of default of said portfolio corresponds to the objective of this work.
On the other hand, when analyzing the credit risk of a portfolio, the individual effect of each element of the portfolio overall must be considered, and this is where the issue of copulas becomes relevant.
2.2 Copulas
A copula is a multivariate distribution such that its marginal distributions are uniform and describes how the distributions are jointly related to determine the multivariate distribution (Bluhm et al., 2010).
There is a large body of literature on copulas, including Fredheim (2008) and Rank (2006) . An enlightening literature review on copula applications to financial and economic time series can be found in Patton (2012) and, more recently, in Dewick and Liu (2022) . In particular, for the credit risk case, the remarkable work of Frey and McNeil (2003) , the authors present recommendations on credit risk model choice. Moreover, the financial literature presents applications of Gaussian (Bourgey et al., 2020) and non-Gaussian copula models on portfolio credit risk, such as the t-copula (Chan and Kroese, 2010), composite Berstein copula (Guo et al., 2017), and Archimedean copulas (Fenech et al., 2015; Cui et al., 2022).
A related work to our paper is Liu et al. (2019) , where the authors employ an Archimedean copula to examine the credit risk of Chinese SMEs loans. To understand the usefulness of a copula, the Vasicek model is considered, which is based on the Gaussian, and it is still used for credit risk modeling (e.g., García-Céspedes and Moreno, 2022). In order to calculate the default probability of a portfolio, the probability of default for each credit is initially considered in the model. Then, the joint probability is calculated, considering the individual impact on the whole credit portfolio (Hull, 2015).
3. Methodology
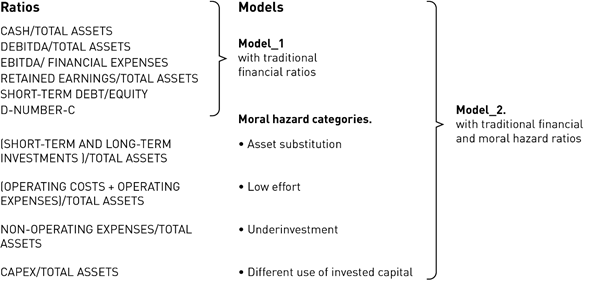
The objective of this section is to visualize the moral hazard in a credit portfolio for which the following procedure is used: i) the default probabilities of each of the SME credits guaranteed by the FNG are calculated using two logit models. Model 1 uses traditional financial ratios, while Model 2 adds moral hazard ratios. ii) The default probabilities of the credit portfolio are calculated, with and without the moral hazard ratios, through copulas, and iii) The previously calculated default probabilities are compared.
3.1 Data
The data for calculating the default probabilities come from crossing two sources of information: the FNG and the Colombian Superintendency of Corporations. Based on this, the financial ratios are calculated for traditional and moral hazard ratios of the companies that have obtained loans under the FNG's guarantee.
The data is described below, which is based on the article by Castillo et al. (2021) , where the descriptive analysis of the variables used in the modeling can be observed.
From the FNG source, companies short term credit information (working apital loan) is taken for a period less than or equal to 12 months. This is because the database does not allow identifying the dates on which a customer may have defaulted on loan payments, such default occurs when the collateral is paid to the financial intermediary by the FNG. Therefore, with data for the period indicated above, the company's financial information for the year in which the collateral became effective and the completion of the credit term will not be significantly different, unless the company entered bankruptcy, which was verified. This organizes the work into annual cohorts, which provides an instant and complete picture of the SMEs' credit performance (guaranteed by the FNG) for each year. Balance sheets and income statements for these same companies with FNG credit guarantees were obtained from the Colombian Superintendency of Corporations.
The number of records obtained (filtered by company size)1 regarding the number of SMEs in Colombia was 2,234, 2,451, 3,469, 3,498, 3,896, 3,760, 3,615, and 3228 for the years 2007-2014, respectively. These records consist of two groups. The first corresponds to companies for which the collateral was paid to the financial intermediary by the FNG; these companies defaulted. There were: 8, 5, 10, 6, 9, 17, 17 and 20 companies that defaulted in each of the years examined, respectively. The second group consists of the remaining companies for which the collateral was terminated without a claim; that is, the borrower paid back the entire loan.
In the modeling, the focus is on the behavior of the company at the end of the collateral period because either the company defaulted or it did not. Additionally, given that a company can have multiple loans, the company's response regarding the entire credit package was considered; that is, whether it complied or not. A single loan default was enough to consider the entire credit package to be in breach of contract.
In the two logit models used, the dependent variable, in all cases, corresponded to the state of compliance with the terms of the credit package (failure or not). In the first model, the independent variables were the traditional financial ratios and the number of loans; a one (1) was assigned when there was a single loan, otherwise a zero (0) was assigned for all other cases. In the second model, the moral hazard ratios were added. (p. 314)
Figure 1 shows the variables for the logit models, corresponding to the traditional financial ratios, the moral hazard ratios, and the dummy variable (A-NUMBER-C) associated with the number of SME loans
3.2 Method
Based on the probabilities of default obtained from the logit models shown in Figure 1, the probabilities of default in the portfolio from 2007 to 2014 are calculated using copulas, using the Vasicek model, as described in Hull (2015) :
"An arbitrary value is chosen for PD (joint default probability, portfolio) and for ρ (the portfolio joint dependence coefficient) in the interval [0,1].
The logarithm of the probability density is calculated for each of the observations considering the probability of individual noncompliance (DR) by means of the equation:
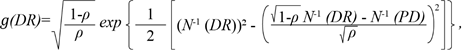 (1)
(1)
where:
g(DR) = probability density function, DR = probability of individual default, PD = probability of joint (portfolio) default, ρ = joint (portfolio) dependence coefficient, and N-1 (.) is the quantile function of a standard normal distribution.
4. Results
Table 1 shows the calculation of the default probabilities in the SME portfolio guaranteed by the FNG based on model 1 (PD:I) and model 2 (PD:II).
Table 1 Default probabilities of the SME portfolio guaranteed under the FNG.
| Year | PD:I | PD:II |
|---|---|---|
| 2007 | 0.0008 | 0.0004 |
| 2008 | 0.0010 | 0.0005 |
| 2009 | 0.0015 | 0.0013 |
| 2010 | 0.0086 | 0.0082 |
| 2011 | 0.0018 | 0.0011 |
| 2012 | 0.0016 | 0.0012 |
| 2013 | 0.0035 | 0.0026 |
| 2014 | 0.0019 | 0.0022 |
Source: own elaboration.
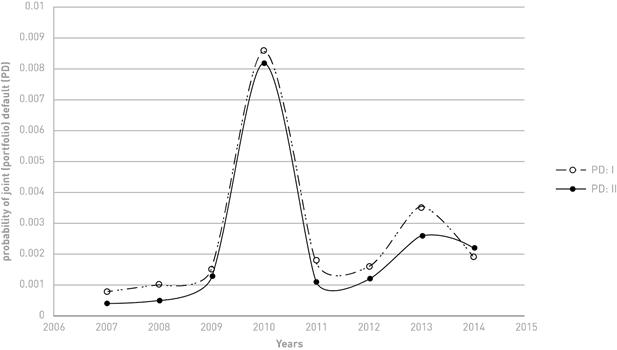
The two groups of probabilities present the same behavior over time (Figure 2), where PD:II adjusts to lower values, except for 2014. That is, the two models (models 1 and 2) determine the same pattern of behavior for this probability. Since the -2log likelihood criterion establishes logit Model 2 as the best model (see Table 3, Table 4), PD:II shows a better technique forecast.
To determine if the two probabilities are statistically different, a chi-squared test is performed where PD:II is the observed data and PD:I is the expected result. The test statistic is 0.0011, and the critical value (with 7 degrees of freedom) is 14.0671. The null hypothesis is not rejected. Thus, we can infer that there is no statistical difference between the default probabilities assessed by Models 1 and 2 (Table 2).
Table 2 Chi-squared test between PD:II (observed data) and PD:I (expected result).
| Years | PD:I (expected result) | PD:II (observed data) | (PD:II - PD:I)2/PD:I |
|---|---|---|---|
| 2007 | 0.0008 | 0.0004 | 0.0002 |
| 2008 | 0.0010 | 0.0005 | 0.00025 |
| 2009 | 0.0015 | 0.0013 | 2.66667E-05 |
| 2010 | 0.0086 | 0.0082 | 1.86047E-05 |
| 2011 | 0.0018 | 0.0011 | 0.000272222 |
| 2012 | 0.0016 | 0.0012 | 0.0001 |
| 2013 | 0.0035 | 0.0026 | 0.000231429 |
| 2014 | 0.0019 | 0.0022 | 4.73684E-05 |
| Test statistic | 0.001146291 | ||
| crit vl | 14.06714045 | ||
| n-1 | 7.0000 | d.f. | |
| p-value | 1.00000 | ||
| Decision: Ho is not rejected |
Source: own elaboration.
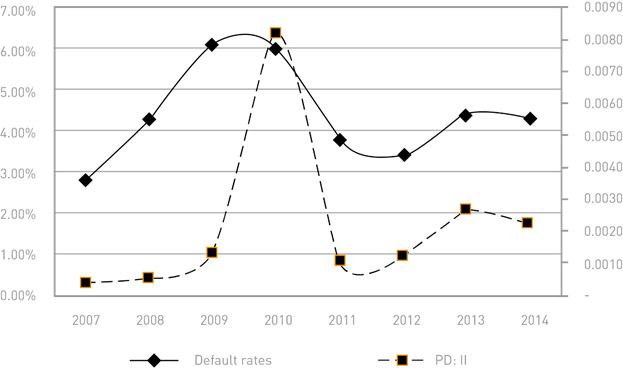
On the other hand, comparing the trajectory followed by the PD:II with the FNG's default rate between 2007 and 2014, Figure 3, a similar pattern is observed, with a correlation coefficient of 0.62. This shows that the projections are significantly close to reality.
Source: own elaboration.
Figure 2 Default probabilities of the SME portfolio guaranteed under the FNG (2077-2014) with and without moral hazard ratios.
Source: own elaboration.
Figure 3 Default probabilities (PD:II) and default rates (left axis) of the portfolio of FNG.
Table 3 Model 1- Logit with traditional financial ratios.
| COEFFICIENTS | 2007 | 2008* | 2009 | 2010 | 2011* | 2012 | 2013 | 2014 |
|---|---|---|---|---|---|---|---|---|
| Traditional financial ratios | ||||||||
| CASH/TOTAL ASSETS | 9.949 (0.028) | 5.043 (0.438) | 7.234 (0.000) | -163.389 (0.403) | -33.284 (0.068) | 4.248 (0.161) | -0.716 (0.925) | |
| EBITDA/TOTAL ASSETS | 0.718 (0.856) | -1.232 (0.050) | -0.961 (0.593) | -1.451 (0.037) | -1.075 (0.133) | -3.117 (0.064) | ||
| EBITDA/FINANCIAL EXPENSES | -0.011 (0.481) | -0.006 (0.587) | -0.013 (0.560) | -0.004 (0.705) | 0.000 (0.955) | 0.003 (0.879) | ||
| RETAINED EARNINGS /TOTAL ASSETS | 1.609 (0.664) | -11.362 (0.077) | -19.341 (0.167) | 4.341 (0.279) | -1.316 (0.616) | -2.664 (0.376) | 0.763 (0.294) | |
| SHORT-TERM DEBT/EQUITY | -0.374 (0.255) | 0.124 (0.530) | 0.003 (0.874) | 0.044 (0.146) | 0.035 (0.834) | 0.110 (0.344) | 0.199 (0.216) | |
| D-NUMBER-C | -3.272 (0.010) | -2.722 (0.018) | -1.081 (0.107) | 15.006 (0.988) | -1.156 (0.086) | -2.554 (0.002) | -1.254 (0.037) | -2.310 (0.004) |
| Constant | -4.618 (0.000) | -5.039 (0.000) | -4.627 (0.000) | -19.728 (0.984) | -4.935 (0.000) | -3.392 (0.000) | -4.455 (0.000) | -4.375 (0.000) |
| Tests | ||||||||
| -2log likelihood | 57.386 | 63.222 | 117.925 | 60.856 | 122.498 | 128.762 | 145.072 | 124.578 |
| R2 Nagelkerke | 0.178 | 0.116 | 0.134 | 0.190 | 0.038 | 0.176 | 0.055 | 0.175 |
| Omnibus: χ2 | 12.206 (0.058) | 8.205 (0.042) | 17.844 (0.007) | 14.071 (0.029) | 4.750 (0.093) | 26.731 (0.000) | 8.238 (0.221) | 25.581 (0.000) |
| Hosmer and Lemeshow: χ2 | 10.523 (0.230) | 1.248 (0.996) | 4.088 (0.849) | 0.718 (0.999) | 5.912 (0.657) | 2.620 (0.956) | 6.622 (0.578) | 3.600 (0.891) |
Notes: In these years, the model did not fit the Omnibus test. Therefore, the backward stepwise method (Wald) was applied.
Source: own elaboration based on Castillo et al. (2021) .
Table 4 Model 2 - Logit with traditional financial ratios and moral hazard ratios.
| CEFFFICIENTS | 2007 | 2008 | 2009 | 2010 | 2011 | 2012 | 2013 | 2014 |
|---|---|---|---|---|---|---|---|---|
| Traditional financial ratios | ||||||||
| CASH/TOTAL ASSETS | 9.356 (0.062) | 8.106 (0.193) | 8.173 (0.000) | -179.958 (0.342) | -43.444 (0.047) | 3.645 (0.232) | 1.294 (0.853) | |
| EBITDA/TOTAL ASSET | -2.646 (0.450) | -1.668 (0.292) | -1.138 (0.470) | -0.709 (0.569) | -2.378 (0.042) | -3.194 (0.084) | ||
| EBITDA/FINANCIAL EXPENSES | -0.001 (0.660) | -0.005 (0.644) | -0.013 (0.591) | -0.005 (0.567) | 0.000 (0.953) | -0.002 (0.908) | ||
| RETAINED EARNINGS/TOTAL ASSETS | 1.420 (0.648) | -11.793 (0.066) | -21.575 (0.141) | -4.335 (0.277) | -1.463 (0.611) | -2.782 (0.349) | 1.064 (0.133) | |
| SHORT-TERM DEBT/EQUITY | 0.435 (0.287) | 0.209 (0.262) | 0.004 (0.834) | 0.053 (0.098) | 0.033 (0.856) | 0.067 (0.490) | 0.238 (0.136) | |
| D-NUMBER-C | -3.179 (0.015) | -2.999 (0.013) | -1.199 (0.083) | 15.073 (0.988) | -1.234 (0.071) | -2.660 (0.002) | -1.321 (0.030) | -2.368 (0.003) |
| Moral Hazard ratios (+ sign) | ||||||||
| (SHORT AND LONG TERM INVESTMENTS )/TOTAL ASSETS | -3.179 (0.015) | 0.125 (0.986) | -1.127 (0.882) | -6.891 (0.685) | -40.362 (0.362) | 1.764 (0.689) | -681.296 (0.235) | 0.702 (0.871) |
| (OPERATING COSTS + OPERATING EXPENSES )/TOTAL ASSETS | -1.594 (0.142) | -2.098 (0.059) | -0.086 (0.648) | -0.091 (0.728) | -1.359 (0.039) | -0.237 (0.402) | -1.161 (0.028) | -0.904 (0.114) |
| NON-OPERATING EXPENSES/TOTAL ASSETS | 8.887 (0.034) | 5.210 (0.186) | -0.834 (0.836) | 4.342 (0.057) | 0.958 (0.209) | 4.065 (0.001) | 2.913 (0.253) | 0.869 (0.801) |
| CAPEX/TOTAL ASSETS | 0.960 (0.706) | 2.499 (0.230) | 2.352 (0.144) | 2.738 (0.195) | -0.744 (0.710) | 0.257 (0.888) | -1.638 (0.414) | 0.574 (0.742) |
| Constant | -3.763 (0.012) | -3.871 (0.002) | -4.810 (0.000) | -20.531 (0.984) | -3.005 (0.001) | -3.420 (0.000) | -2.369 (0.007) | -3.601 (0.000) |
| Tests | ||||||||
| -2log likelihood | 44.811 | 55.402 | 115.459 | 57.629 | 113.420 | 121.909 | 127.313 | 120.966 |
| R2 Nagelkerke | 0.360 | 0.227 | 0.152 | 0.233 | 0.110 | 0.221 | 0.174 | 0.200 |
| Omnibus: χ2 | 24.781 (0.006) | 16.025 (0.025) | 20.309 (0.026) | 17.298 (0.068) | 13.828 (0.032) | 33.585 (0.000) | 25.997 (0.004) | 29.193 (0.001) |
| Hosmer and Lemeshow: χ2 | 5.144 (0.742) | 3.111 (0.927) | 5.235 (0.732) | 0.533 (1.00) | 5.326 (0.722) | 2.963 (0.937) | 3.778 (0.877) | 11.891 (0.156) |
Notes: A detailed explanation of the expected signs for all variables can be found in said article. This can be summarized by saying that the moral hazard ratios produce an adverse effect on the event being measured. For the case in question, they increase the probability of default of the credit; therefore, its expected sign is positive.
Source: own elaboration based on Castillo et al. (2021) .
Based on the results shown in Tables and figures, it can be concluded that:
According to the literature, in the presence of moral hazard, the variables associated with said risk have a positive sign in the calculation of the probability of default. Therefore, the NON-OPERATING EXPENSES / TOTAL ASSETS variable corresponding to the Underinvestment category is the one that evidences the conflict of interest between the SME and the financial institution within the compliance of the credit in the portfolio, that is, the use of resources directed to cover expenses not related to the operation of the company is evident (Table 3).
The positive sign of the Cash/Total Assets variable is considered a reflection of moral hazard in SME credit, which is associated with a greater perception of risk by the borrower and a greater preference for maintaining liquidity (Castillo et al., 2021). Therefore, the conflict of interest in the portfolio guaranteed by the FNG is being determined not only by the moral hazard ratios but also by some liquidity.
The peak in the probability of default of the credit portfolio guaranteed by the FNG in 2010 (Figure 2) was determined by moral hazard problems associated with the Underinvestment category, and it was also the more important of said ratios in the different periods (Table 3).
The default probabilities of the SME portfolio guaranteed by the FNG presented the same pattern over time when calculated with traditional financial ratios compared to the one that adds the moral hazard ratios. These probabilities present a correlation coefficient of 0.99. Furthermore, they are not statistically different. However, the probabilities calculated with the moral hazard ratios were adjusted to lower values (optimistic forecast) except for the last year.
The default probabilities calculated with the traditional financial and moral hazard ratios present a similar pattern to the default rates of the FNG with a correlation coefficient of 0.62.
During the different years of analysis, there is not the same independent variable with statistical significance. This shows that the probabilities of default in the portfolio guaranteed by the FNG are determined by different factors of the firms, ranging from their liquidity status, their debt levels, efficiency in the management of resources, capacity to generate benefits, and even the conflict of interest between SMEs and financial institutions (years: 2007, 2009, 2010 and 2012).
The D-NUMBER-C variable has statistical significance for almost all the years except for 2010, and its sign was negative, indicating that the probability of portfolio default decreases to the extent that SMEs have a single loan. Therefore, a policy aimed at guaranteeing one credit per company could be reasonable, not only for the sake of greater coverage of the guarantee program but also in the hypothetical case that it could be necessary to restrict the credit due to undesirable behavior of the portfolio.
5. Conclusions
The probability of default on loans in the SME portfolio guaranteed by Colombia's National Guarantee Fund presents the same pattern when calculated both by traditional financial ratios and by incorporating the moral hazard ratios but adjusted to lower values. This shows that such categories become an important tool for calculating default probabilities not only at the individual level but also at the portfolio level.
The theoretical framework of the probability of default of the SME portfolio guaranteed by the FNG is immersed in asymmetric information problems (moral hazard). However, when calculating the probabilities of default in the traditional way (without the moral hazard ratios), the results are not statistically different.
When calculating the probabilities of default of the SME portfolio guaranteed by Colombia's National Guarantee Fund, it should be done based on the presence of moral hazard since it is a guarantee provided by a third party. Considering this, the probabilities of default are adjusted to a lower value than that calculated outside of said theoretical framework. Thus, if the institution calculated the probabilities of default based on the moral hazard ratios, it would have the possibility of making lower provisions for expected losses and thereby increase the availability of resources for guarantees.
The pattern of the probability of default in the portfolio guaranteed by the FNG calculated with the traditional financial ratios together with those of moral hazard is similar to the default rate that the FNG presented in the periods under analysis.
The already demonstrated importance of Colombia's National Guarantee Fund in mobilizing resources for SMEs is further enhanced by the fact that, despite not mitigating moral hazard problems, its portfolio presents low probabilities of default and its values, under moral hazard theory, are lower than if it were calculated traditionally, that is, without the ratios that show conflicts of interest.
The portfolio guaranteed by the FNG is constituted under asymmetric information (moral hazard issues). In this sense, it must be considered that a positive sign in the moral hazard ratios indicates the presence of the event, while a negative sign indicates the absence of said problem and not an atypical behavior of the ratios' sign. In relation to traditional financial ratios, an unexpected behavior of the sign, different from what is traditionally expected, could reflect a conflict of interest. However, an economic analysis of the meaning of the variable in relation to the event being measured is essential to reach that conclusion.

