English (pdf)
 Article in xml format
 Article references
 Send this article by e-mail
 Cited by SciELO
  Cited by Google
  Similars in
SciELO
Similars in
SciELO  Similars in Google
 Permalink
1. Introduction
The global market for health and wellness food is projected to continue growing during the period 2020-2027 led by countries such as the USA, China, Japan, Canada, and Germany (Research and Markets, 2022; Mintel, 2021). The rising consumer interest in the healthiness, safety, and sustainability of food products exerts pressure on public and private organizations to create a healthy environment (Mwanri et al., 2012), imposes strong health regulations, and extends the offer of healthy manufactured food products (Muro-Rodríguez et al., 2021). Large food corporations, such as PepsiCo (Sherred, 2019), Nestlé (Simonin and Anwar, 2016), Mondelēz (Mondelēz, 2014), and Coca-Cola have invested in the reformulation of their regular products and launched new lines of healthy snacks and beverages that have contributed to the global growth of this market (Noguez, 2021; Grand View Research, 2021).
According to Euromonitor International, during 2015-2020, the value of the healthy food market niche in Mexico increased its value by 41.7% to 15,591 million USD (Noguez, 2021). The National Institute of Statistics and Geography (INEGI) estimates the value of the snack market at 3,232 million USD, with around 86% of consumers eating snacks several times per week and about 50% stating they have increased their consumption of healthy snacks (Legiscomex, 2021; Procomer, 2017). Regarding beverages, water is acknowledged as the smartest drink. However, sometimes people are craving something more. Although drinks with empty calories are the main offer at supermarkets and convenience stores, nutritious drinks such as natural cranberry, pomegranate, orange sugar-free juices, coconut water, and green tea are wanted because they contain natural healthy ingredients, vitamins, minerals, or added fiber which are considered functional components (Denby, 2021).
Snacks may contribute to or detract from a healthy diet as their consumption contributes to around 20% of daily energy consumption in countries such as the USA. Snacking, defined as any eating occasion outside of a typical mealtime, can improve diet quality if healthy snacks/beverages are selected, but the excessive and routine consumption of unhealthy snacks may contribute to overweight and poor nutrition (Enriquez & Gollub, 2023). Snacking is conditioned to the context. For example, at work, individuals tend to select easy-to-eat products (convenience), such as cookies and chips, that have low nutritional value. Snacking can be driven by external cues such as sensory perceptions, time of day, and social influence but also can be associated with searching for gratification instead of satisfying hunger or complementing the diet. Advancing snacking research is relevant for health promotion by providing information about how important it is for several segments of consumers (e.g., males versus females, taste lovers versus nutrition seekers) to consider the nutritious value of snacks and beverages (Mai & Hoffmann, 2012; Murakami et al., 2022), and how the combination of healthy and unhealthy products (e.g., vegetable chips and a chocolate drink) satisfies cravings and provides gratification while contributing to a healthy diet (Enriquez & Gollub, 2023).
Furthermore, understanding how individuals value snack attributes depending on their psychographic profiles is relevant to outlining direct communication campaigns and interventions to promote/modify alimentary behaviors that contribute to reducing overweight and obesity rates in low to middle-income countries (WHO, 2021). In Mexico, overweight and obesity represent a public health problem; 72% of Mexican adults were overweight or obese in 2016, and this rate has been consistently increasing since 1999. The National Strategy to Prevent and Control Overweight, Obesity, and Diabetes includes health communication campaigns, nutritional advice in health centers, banning junk food at schools, and the use of black octagons to identify unhealthy ingredients in manufactured food (Rivera-Dommarco et al., 2018). However, all these strategies do not consider the motives and needs of different segments.
Moreover, although a healthy environment contributes to healthy eating, in the end, the decision of what to eat depends on how consumers select food products. Consumers can make decisions by weighing benefits against drawbacks. If benefits are worthy and draw-backs acceptable, a decision is made. Nevertheless, some products, mainly comfort low-cost goods such as snacks, are selected by fast decision-making and proclivity for immediate gratification. Consequently, understanding what food meta-attributes are influencing consumers' choices (Muro-Rodríguez et al., 2021) and what different consumer segments expect to achieve via food purchases (Wongprawmas et al., 2021) are important to food manufacturers for the design and market of healthier products (Young, 2000).
This study contributes to the literature by unveiling the hierarchy of product values that drive the consumers' selection of snacks and beverages contingent on their personal traits (health consciousness, self-control, self-assessment of diet quality, and demographics), thus enhancing the understanding of what consumers value in a snack and why some segments select healthy/unhealthy snacks. Former studies conclude that demographics significantly influence alimentary behaviors (Murakami et al., 2022; Vorage et al., 2020). Demographic variables (age, sex, educational level, and income, among the most important) cannot be modified by health education or campaigns. However, they are relevant to identify where the target audience is and how they can be contacted. Regarding psychographic variables, health consciousness (Mai & Hoffmann, 2012, 2015), self-efficacy (Bouwman et al., 2020), perceived risk (Deshpande et al., 2009), personal and product values (Claessens et al., 2023), and healthy lifestyles have been used for segmentation (Arroyo et al., 2020; Hardcastle & Hagger, 2016) and to explain and predict healthy alimentary behaviors.
Determinants of food choices are complex and involve a wide variety of factors; previous studies suggest that combining demographics and psychographics can better explain and predict health behaviors. The psychographic variables should be selected for the particular product category under investigation (snacks in this work) because their influence may vary among product categories (Jenkins et al., 2021; Meiselman et al., 2021).
Because snacking is associated with indulgence and impulsive eating that may result in the consumption of more palatable, energy-dense snacks even if labeled with black octagons, this work selected the following psychographics: health consciousness, self-control, and perceptions of diet quality. This research adds to the literature on snacking by exploring the drivers of the snack choice decision, specifically if different demographic and psychographic segments of consumers maximize their benefit or utility through the rational valuation of snack attributes or if they select them based on a decision-ma-king process that disregards the value of the product's attributes. Additionally, this study employs classification trees as an analytical tool to represent the ordered sequence of values that lead to a final choice.
The remainder of this work is organized as follows: the next section presents a revision of the literature regarding theories of product values and the psychographics that determine food choices. The third section describes the experimental methodology applied, and the fourth presents and discusses the results. Finally, the last section states the main conclusions and practical recommendations.
2. Theoretical Background
According to the theory of random utility (McFadden, 1986), the overall utility of a product depends on the worth that the consumer assigns to its physical and intangible attributes. The product value refers to the net benefit of a product, that is, the overall utility it delivers to the consumers based on their needs and motivations (Ceyda, 2021). Under the assumption consumers are rational agents, they will choose the product that maximizes their expected utility or, equivalently, provides the highest perceived value constrained to a feasible set of options (Zeithmal, 1988).
The theory of consumption values (CVT) proposed by Sheth et al. (1991) explains how consumers evaluate and choose to purchase or not a specific product based on five dimensions: functional, social, emotional, epistemic, and conditional values. Functional value refers to the product's quality, price, and performing attributes. Social value is conceptualized as the perceived utility derived from associating the product's consumption with the expectancies and values of significant social groups. Emotional value relates to positive feelings, and conditional value to the utility obtained from consuming the product according to a specific situation. Finally, the epistemic value refers to the consumers' proclivity for novelty and curiosity. Consumption values are independent and additively contribute to explaining the heterogeneity in consumers' choices. While maximizing all consumption values is desirable, consumers may prioritize values depending on their goals. For example, the segment of ethical consumers concerned about environmental and social issues looks to maximize these values but still make trade-offs with functional values such as price and taste (Loizou et al., 2013).
While the CVT is a general marketing theory, the Food Choice Questionnaire (FCQ) developed by Steptoe et al. (1995) was specifically designed to assess the underlying food meta-attributes or choice motives influencing purchasing. Then, both concepts consider the triggering reasons for the selection of food are determined by the relative importance attached to consumers' various food values/food choice motives. The 36 items of the FCQ cover nine health-related and non-health-related attributes that somewhat concur with the five consumption values. For example, the mood factor relates to the emotional value while nutrition, sensory, and price are covered by the functional value. The FCQ has been used to segment consumers (Arroyo et al., 2020; Izquierdo-Yusta et al., 2018) and to explain preferences toward traditional foods (Almli et al., 2011), ecological products (Lee & Yun, 2015), and functional foods (Küster-Boluda & Vidal-Capilla, 2017).
Lusk and Briggeman (2009) also proposed consumers' food choices depend on a set of inferred food values (FVs) that represent more abstract concepts than the physical attributes of the product because they simultaneously involve various food attributes, entail "end states" (e.g., stay healthy), or represent the consequences of food consumption (e.g., environmental impact). Lusk (2011) used these eleven FVs to explain behavioral outcomes such as purchasing organic food. Luomala et al. (2015) confirmed the influence of FVs on preferences toward healthy (e.g., fruit and vegetables) versus tasty food (meat and sweets). Whereas Nystrand and Olsen (2020) found utilitarian food values strongly and positively affect the consumers' attitudes toward functional values in contrast with hedonic FVs that less strongly and negatively influence attitudes.
Based on the extant literature that indicates that food choices are driven by food values or, equivalently, food choice motives (from now on, food choice values), the first research hypothesis is proposed:
H1: The selection of healthy versus unhealthy manufactured food/beverage depends on how consumers rank food choice values (FCV).
2.1 Psychographic variables influencing food choices
Psychographic traits and lifestyles can influence the importance consumers assign to different FCVs (Arroyo et al., 2020; Mai & Hoffman, 2012; Muro-Rodríguez et al., 2021). For example, empirical studies support the relationship between self-control, behavior, and well-being (Cobb-Clark et al., 2019). Self-control (SC) is defined by Gillebaart (2018, p. 4) as "the set of skills, capacities, and behaviors that we need to 'operate' in a self-regulation feedback loop," that is, SC refers to what one does to avoid internal and external barriers to interrupt undesirable behaviors to attain a desired end state. For example, individuals with greater self-control achieve higher academic and labor performance, have better health, and have better financial and overall well-being. In contrast, individuals with low self-control may behave more irrationally and exhibit more maladaptive eating behaviors because their decisions are more automatic and subliminal (Cobb-Clark et al., 2019; Gillebaart, 2018).
Some individuals may find it more difficult to resist impulses to frequently consume high-sugared, more fatty snacks than others because they have lower self-control to stop themselves from giving in to unhealthy food choices. Honkanen et al. (2012) approach snacking as a behavior that may be either reflective or impulsive. The reflective process is guided by a thoughtful estimation of the healthiness of snack products, while impulsive snacking is driven by hunger, emotions, habits, and context. Food-related self-control was found to moderate the relationship between impulsive snack buying and behavior. Impulsive buying and consumption of snacks were stronger when food-related self-control was weak. Meanwhile, individuals with strong self-control and negative attitudes towards unhealthy snacking are more prone to make rational decisions based on the healthiness of the products.
Self-control requires more than inhibiting impulses and unwanted responses. The integrated model of self-control of Kotabe & Hoffman (2015) proposes that desire and partly incompatible higher-order goals generate a desire-goal conflict that requires motivated reasoning and control capacity to stop the undesired behavior. In the case of healthy eating, it means one needs to inhibit the desire to obtain the immediate gratification of eating tasty but unhealthy food and rationally adopt long-term alimentary behaviors that contribute to well-being. Astolfi et al. (2021) explored the relationship between self-control and six health-risk behaviors among Brazilian adolescents; the consumption of ultra-processed food and sedentary behavior were considered. The low SC group preferred the pleasurable consumption of ultra-processed food to the high SC group. Similar results were reported by Wills et al. (2007) , who found that American adolescents with poor SC eat more food with saturated fats than adolescents with good SC who prefer fruit and vegetables.
Therefore, the second research hypothesis is stated as follows:
H2: The value assigned to the healthy versus unhealthy attributes of snacks and beverages depends on the individual's self-control. Individuals with high self-control are more likely to choose healthy snacks and beverages than individuals with low self-control.
Health consciousness (HC) is a psychographic construct that denotes the degree to which a person plays an active role in maintaining their health (Gould, 1990). Health behavior theories propose that health-conscious consumers integrate their health concerns into protective actions to manage their health and adopt a healthy lifestyle (Newsom et al., 2005). Several studies have shown HC is related to seeking out health-related information, positive attitudes toward nutrition and healthy behaviors such as exercising and dieting, and being more reactive toward health information and the manufacturing process of the products consumed (Hong, 2009; Michaelidou & Hassan, 2008; Espinosa & Kadić-Maglajlić, 2018). Previous research also has found that health-related attributes of manufactured food are more valued than accessibility and hedonic attributes among health-conscious consumers (Arroyo et al., 2020).
Mai and Hoffmann (2015) examined the effect of health consciousness on the unhealthy=tasty intuition (UTI) decision, that is, the intuitive belief that the unhealthier the food, the tastier it is. The research findings indicate that health consciousness decreases the UTI; more health-conscious consumers do not infer taste decreases for reduced-sugar/fat products in contrast with less health-conscious individuals. However, healthiness and tastiness perceptions are formed in different ways. Tastiness is primarily based on sensory attributes and is the dominant driver of purchase intentions, while healthiness is based on the assessment of extrinsic attributes (labeling) and is not as good a predictor of food choices as other motives. Thus, although health consciousness enhances the positive indirect effect of healthiness information on purchase intentions, snack manufacturers need to offer healthy products that are more palatable to attract the low health-conscious segment and better satisfy the more health-conscious segment.
Health-conscious consumers are different from weight-conscious consumers whose main concern or motivation is to control his/her calorie intake. By contrast, health-conscious individuals have a better understanding of health issues and are more prone to take action to safeguard their health by selecting more nutritious and safer food (Iqbal et al., 2021).
Accordingly, the next hypothesis is proposed:
H3: The value assigned to the healthy versus unhealthy attributes of snacks and beverages depends on health consciousness. More health-conscious individuals are more likely to choose healthy snacks and beverages.
Adherence to dietary recommendations (ADR) provided by health organizations indicates that higher ADR scores are significantly associated with a higher economic status, better self-rated health, lower health service use, and a lower saturated fat intake (Collins et al., 2008). Perceptions about diet quality are a psychosocial factor that influences dietary intake and, if inaccurate, preserves poor dietary habits (Powell-Wiley et al., 2014). Previous research concludes that individuals tend to overestimate the healthfulness of their diet and, therefore, make no efforts to improve their alimentary behavior (Brug et al., 1994). However, Adjoian et al. (2016) found that the Health Eating Index is positively correlated with self-rated diet quality scores among New York residents. Thus, a single item (Healthy/Unhealthy, Yes/No) could be a simple surrogate measure to assess the quality of dietary intake in extreme cases and identify individuals who require support to recognize healthy food and improve their dieting.
Batis et al. (2020) analyzed the data from the National Health Survey to compare groups with high versus low self-rated dietary quality. Findings indicate that individuals who perceived their diet as healthy show a slightly better ADR regarding their consumption of fruit, highly industrialized products, and salty snacks. However, regarding other products, perceptions of diet quality were higher than what they actually are, conforming to the Healthy Eating Index. Gago et al. (2021) also found a significant association between self-ratings of diet quality and higher consumption of fruit but a weak relation with vegetable consumption among adults in Puerto Rico. These findings suggest that individuals who judge their diet as healthy try to improve their ADR by preferring snacks and beverages made from fruit and vegetables over salty and fatty ones. The revision of cross-sectional, longitudinal, and intervention studies performed by Bellisle (2014) indicates improper snacking is not induced by hunger, but the environmental context (e.g., watching TV) negatively influences diet quality. Replacing snacks with high caloric content with low-energy alternatives rather than reducing snacking frequency may improve diet quality. Individuals aware of these facts are expected to adjust their between-meals eating with their daily eating intake.
Therefore, the last research hypothesis is formulated as follows:
3. Methodology
3.1 Experimental design
An online experiment using Qualtrics software was performed. Participants were recruited among students, faculty, and staff of the three campuses of the Autonomous University of Coahuila, located in the most populated cities of this northern state, namely Saltillo, Torreon, and Monclova. The requirements to participate in the study were that the individual is at least 18 years old and consumes a mid-day snack and beverage at least three times per week. The recruitment process ended when a total of 256 participants (see details for the sample size below) who confirmed their participation in the study. Following Mora and Lopez-Valcarcel (2018) , participants were asked to select a mid-morning snack and drink among a set of four choices. Choices were randomly coded as follows: 1 = (U, U) = unhealthy food, unhealthy beverage; 2 = (U, H) = unhealthy food, healthy beverage; 3 = (H, H) = healthy food, healthy beverage, 4 = (H, U) = healthy food, unhealthy beverage.
Two healthy and two unhealthy options were included for food and drink. These options were defined based on an Internet search and discussed with the university's nutritionist and an independent professional. Participants were each asked to pick up one food item and one drink from the following products: for food, a portion of mixed nuts (healthy option), a portion of mixed dried fruits (healthy option), a pack of cookies (unhealthy option), or a popular Mexican packed snack cake (unhealthy option). For drinks, the choices offered were coconut water (healthy option), cranberry juice (healthy option), a regular soft drink (unhealthy option), or a popular fruit-flavored beverage in Mexico (unhealthy option). Therefore, four possible choices for each combination of the 2x2 experiment are possible:
(U, U): (cookies, soda), (cookies, fruit-flavored beverage), (fruit, soda), (fruit, fruit-flavored beverage).
(U, H): (cookies, coconut), (cookies, c-juice), (cake, coconut), (cake, c-juice)
(H, H): (nuts, coconut), (nuts, c-juice), (fruit, coconut), (fruit, c-juice)
(H, U): (nuts, soda), (nuts, fruit-flavored beverage), (fruit, soda), (fruit, fruit-flavored beverage)
Picking up one option from each of the four possible healthy/unhealthy combinations results in a total of 44 = 256 possible choices. Then, a specific set of choices was randomly presented to each participant, for example, cookies and a soda, cookies and cranberry juice, a portion of nuts plus coconut water, or a portion of dried fruit with a fruit-flavored beverage. All options were presented simultaneously, and the participant selected the most preferred choice for a mid-morning snack. The choice was coded as previously explained. The sample size of 256 subjects equals the total possible food choices or stimuli but also satisfies the recommended 5:1 ratio of participants to items in the structured questionnaire designed to assess product food values and individual traits (Hair et al., 2017).
3.2 Design of the measurement instrument
A structured questionnaire using validated scales was designed to measure food choice values and selected psychographic constructs. Items were translated to Spanish by the researcher and then back-translated by an English professor to ensure the translation did not change their meaning. The first part of the questionnaire uses the multi-scale proposed by Arroyo et al. (2020) to assess the participants' food choice values (FCV). The scale was based on the FCQ and the TCV proposed by Sheth et al. (1991) . Items referring to the novelty of food technologies that companies incorporate to improve their snack and beverage offer were added to assess the epistemic value (Speciality Food, 2021). These items were adapted from those designed by Bazzani et al. (2018) . Individuals were instructed to rate the degree of importance of each item on the FV scale on a five-point scale ranging from 1 = "not important" to 5 = "very important" to decide what food to buy/consume.
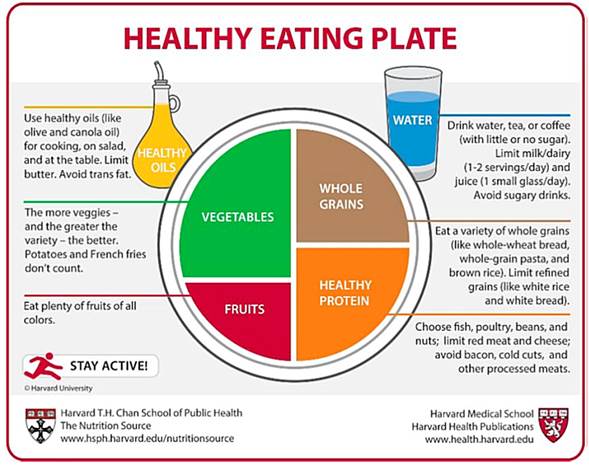
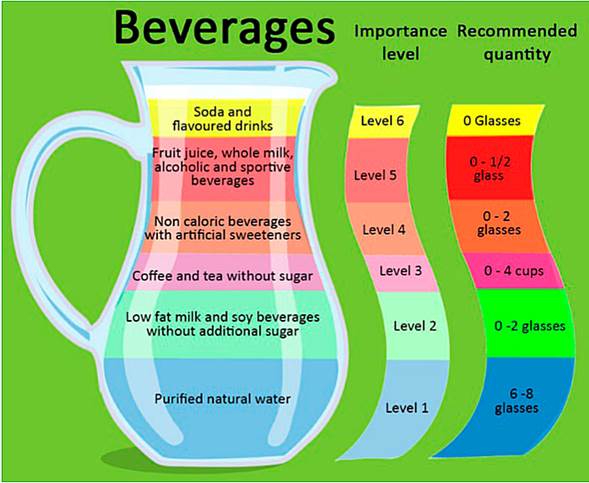
The second part of the questionnaire includes scales to measure the psychographic variables declared on hypotheses H2-H4. Health consciousness was measured using a four-item scale based on Mai and Hoffmann (2012) . Self-control was assessed by the 13-item Self-Control Scale (BSCS) developed by Tangney et al. (2004) . The BSCS is a widely used scale in psychological research when the interest is to examine the association between self-control and various positive outcomes (Lindner et al., 2015). The self-assessment of diet quality was evaluated by asking participants to respond "Good" or "Poor" to the following question, "How do you rate the overall quality of your diet?" Before answering this question, participants were asked to revise two diagrams, the Healthy Eating Plate (Harvard School of Public Health, 2011) (see Figure 1A in the Annexes) and the Healthy Drinking Jar (Gobierno de México, Procuraduría Federal del Consumidor, 2017) (See Figure 2A in the Annexes).
Murakami et al. (2022) found that the assessment of food product values (accessibility, convenience, health/weight control, tradition, sensory appeal, organic, comfort, and safety), food literacy, cooking food skills, and eating behaviors (e.g., emotional overeating) differ depending on the age and sex of Japanese adults. Therefore, the last section of the questionnaire asked respondents about their sociodemographic characteristics (age, sex, income, and education level).
The composition of the sample is as follows. Four age categories were considered: 19-25 years old (41% of participants), 26-35 years old (13%), 36 to 50 years old (39%), and over 50 years old (7%). Regarding income, the categories correspond to the AMAI classification (Mexican Association of Marketing Research [AMAI], 2021), namely A/B or high socioeconomic level (33%), C+ and C or medium (39%), and C- or medium-low (28%). The educational level was categorized as elementary school (7%), high school (16%), BS degree (50%), and graduate degree (27%). The percentage of males was 58% and 42% of females.
4. Results and Discussion
4.1 Scale purification and validation
The first part of the analysis was the validation of the measurement instrument. Together, PCA, EFA, and CFA were used to analyze the questionnaire for data reduction, scale construction and improvement, and validation assessment. According to Arroyo et al. (2020) , nine FCVs were expected. However, although Jáuregui Lobera & Bolaños-Ríos (2011) states the FCQ has appropriate psychometric properties to be used in the Spanish context, a simplified structure with eight factors was reported by Marsola et al. in the case of Brazil (cited by Jáuregui-Lobera & Bolaños-Ríos, 2011, p. 1317), while Espinoza-Ortega et al. (2016) identified a larger number of factors when they applied the FCQ in Mexico. Therefore, the multi-dimensionality of the scales was first explored through exploratory factor analysis (EFA). The psychographic traits (self-control and health consciousness) were included in the EFA; solutions with ten to twelve factors were explored. Principal com-ponents (PC), a very popular factor extraction method focused on identifying the smallest number of factors or components necessary to explain as much of the variance as possible, was applied. PC is useful for examining the number of components that later need to be associated with theoretical latent variables, identifying which items make up each component and how strongly they relate to the component. Thus, PCA is most useful as a descriptive tool for the process of measure development and the understanding of the strengths and weaknesses of the measure in terms of content validity and structural validity (Osborne & Costello, 2009).
According to the criteria of eigenvalue >1, scree plot, and % of variance explained (58%), a nine-factor solution was regarded as satisfactory. After rotation, the "cleanest" factor structure - item loadings above .3, no item cross-loadings on several factors, and high communalities (>0.4) - was fully explored (Osborne & Costello, 2009). Items related to FCVs were grouped only into seven factors. The remaining three factors grouped items associated with the two psychographic constructs, but the last one comprised only two items of the self-control multi-scale ("I am lazy" and "I say inappropriate things"), both with small loadings (<0.236), small cross-loadings with the two factors that group SC items, and low communalities (<0.3). Thus, this last factor was discarded because the two-dimensional structure of the BSCS did not represent a substantial improvement in assessing self-control concerning the unidimensional measure (Linder et al., 2015). Four more items, two of the BSCS ("Pleasure and fun keep me from getting work done" and "I have trouble concentrating") and two of the FCV multi-scale ("No chance I could develop a disease by consuming this food" and "Production pro-cess guarantees no harmful bacteria or viruses"), were eliminated of the nine-factor solution because of their negligible factor loadings and communalities (< 0.3) (Osborne and Costello, 2009; Wieland et al., 2017).
The grouping of items properly distinguishes FCVs from the psychographic traits. The two main differences between the purified multi-scale of this work and the one reported by Arroyo et al. (2020) are:
The first factor includes items regarding the sustainability and safety of the production process as well as the naturalness and healthiness of the product's ingredients. This factor, named "healt-hiness and sustainability food value," seems to reflect the major concerns regarding the safety, natural content, eco-friendliness, and healthiness of the food consumed. Previous research indicates that customers demonstrate an increasing interest in manufacturing processes that guarantee nutritious ingredients are not lost during processing, products are not in contact with environmental contaminants and germs, adhere to ethical and environmental stan-dards, and help to maintain a good state of health (Di Renzo et al., 2015; McKinsey & Company, 2022; Nystrand & Olsen, 2020; Sadiq et al., 2020; Vågsholm et al., 2020).
The last factor comprises items that refer to the preference for organic, functional, and superfood products1 that offer some novelty to the consumer while enhancing the product's nutritional value (Infobae, 2017). Accordingly, it was named "novelty for functionality" value.
A CFA using SPSS AMOS was applied to the purified scale. All factor loadings except by two of the BSCS scale ("I do things bad for me if they are fun" and "People would say I have an iron discipline") were significant and exceeded 0.575 (see Table 1). The index χ2 = 873.302 (P-value = 0.102) and the ratio χ2/df = 2.417 were acceptable. After the elimination of the items with non-significant loadings, the goodness-of-fit index (GFI) was 0.922, the comparative fit index (CFI) was 0.897, the adjusted goodness-of-fit index (AGFI) equaled 0.915, and the root-mean-square error of approximation (RMSEA) was 0.053. The values of all indexes confirm the reasonable fit of the measurement model. All Cronbach's alpha were nearly above 0.7 as recommended, while the AVE exceeded the 0.5 bounds for six constructs (see Table 1). Additionally, all the intercorrelations between a specific construct and all other constructs were below the corresponding AVE, thus providing evidence of discriminant validity (Hair et al., 2017). Therefore, the reliability and convergent validity of the scales were judged satisfactory.
Most of the respondents (65%) selected a healthy snack, and from this group, the drink choices were evenly distributed: 51% selected a healthy beverage and 49% an unhealthy one. The least frequent selection (11%) was the unhealthy snack accompanied by a healthy beverage. About a fifth of the respondents preferred unhealthy choices (22%). These results suggest that experimental subjects are turning toward healthier products, particularly snacks.
Two analyses were performed to provide empirical support to the research hypotheses. First, a linear discriminant analysis (LDA) was applied to identify what variables distinguish between (snack and beverage) choices. Although LDA does not impose the normality assumption and inferences are robust to unequal covariance matrices, it assumes linear relationships among the discriminating variables, and outliers can cause severe problems (Huberty & Olejnik, 2006). There-fore, classification trees, a new methodology that unfolds the sequence of "food values" that lead to a final choice were used to give additional support to the first research hypotheses. Finally, a MANOVA was applied to compare choice segments in terms of the psychographic and demographic characteristics of consumers.
Decision trees are a non-parametric supervised learning method used mostly to perform hierarchical segmentation and predict the result for new observations. Decision trees can be used for classification to predict a category, or regression to predict a continuous numeric value. The first type predicts an unordered variable C that can take c =4 discrete possible values, or food choices for this study, and a set of numeric and categorical attributes A1,... , Ap that correspond to the 1, 2,…, 7 food values. The goal is to predict a (healthy/unhealthy snack, healthy/unhealthy beverage) choice based on the importance assigned to a certain FCV.
Classification tree algorithms automatically split numerical attributes Ai into two ranges to maximize class prediction accuracy, that is, the proportion of individuals in a node who made a specific choice (identified as node purity). Splitting into numeric attributes is generally based on the information gain ratio (an entropy-based measure) or the Gini index. The splitting process is re-cursively repeated until no improvement in prediction accuracy is achieved. The final step involves pruning nodes to reduce the tree size and avoid model overfitting. This approach has the advantage that data transformation is unnecessary, cases with missing predictor variables do not require special treatment, prediction performance is not dependent on covariance homogeneity, and variable selection is intrinsic to the methodology. The use of classification trees is appropriate for this work because they are adjunct to LDA and provide a graphical hierarchy that allows the identification of the dominant attributes that distinguish between choices and the proposal of a subset of decision rules (Arana, 2021). The analytical results are discussed in the following sections.
Table 1 Confirmatory Factor Analysis Results.
| Variable | Factor loadings | AVE | Cronbach's alpha |
|---|---|---|---|
| Healthiness and sustainability (13 items) | 0.5103 | 0.9262 | |
| The package of the product is made with recycled biodegradable materials | 0.753** | ||
| The production process of the product is environmentally friendly | 0.745** | ||
| The product does not contain genetically modified ingredients | 0.737** | ||
| The product is not too much processed | 0.725** | ||
| The product is nutritious or healthy | 0.719** | ||
| The product contains natural ingredients | 0.705** | ||
| The local production of the product is clearly marked | 0.698** | ||
| The package guarantees the product's freshness | 0.687** | ||
| The nutritional label on the back of the package indicates it is healthy | 0.673** | ||
| The product package has environmentally friendly production certifications | 0.659** | ||
| The product contains vitamins and minerals | 0.648** | ||
| The product does not contain artificial additives | 0.633* | ||
| The product has been manufactured through a safe process | 0.627* | ||
| Weight control (8 items) | 0.5386 | 0.8714 | |
| The amount of calories the product has is relatively low | 0.775** | ||
| The consumption of the product helps with keeping a normal weight | 0.729** | ||
| The product has a low-fat content | 0.724** | ||
| The product contributes to maintaining a healthy, balanced diet | 0.698** | ||
| The product helps with losing weight | 0.687** | ||
| The product has a low sugar content | 0.673** | ||
| The product is sweetened with safe artificial sugar substitutes | 0.659** | ||
| The health claims in the package indicate it may help prevent some diseases | 0.640* | ||
| Convenience (6 items) | 0.5890 | 0.8033 | |
| The product takes too long to cook | -0.779** | ||
| The product is not easy to prepare | -0.687** | ||
| The product is not easy to take along | -0.661** | ||
| The product is not ready to eat | -0.649** | ||
| The product is easily found in shops and supermarkets | -0.458* | ||
| The product is available in shops close to home or work | -0.565** | ||
| Basic sensory attributes (5 items) | 0.6930 | 0.689 | |
| How good it looks | -0.588** | ||
| How good it smells | -0.571** | ||
| How good it tastes | -0.566** | ||
| The product represents a good value for money | -0.522* | ||
| The product helps me to feel satisfied | -0.520* | ||
| Tradition (4 items) | 0.5966 | 0.7262 | |
| The product is like the food I ate when I was a child | -0.719** | ||
| The product reflects my cultural or ethnic traditions | -0.659** | ||
| It is a usual product easily available | -0.655** | ||
| The product is familiar to me | -0.483* | ||
| Emotional value (3 items) | 0.4764 | 0.7671 | |
| The product helps to deal with my mood | -0.738** | ||
| The product helps me relax | -0.735** | ||
| The product makes me feel good when I consume it | -0.697** | ||
| Novelty for functional value of food (3 items) | 0.4887 | 0.7549 | |
| I look for functional products | -0.802** | ||
| I prefer organic food | -0.749** | ||
| I seek products with extra nutritional value but low caloric content | -0.574** | ||
| Health consciousness (4 items) | 0.5285 | 0.6573 | |
| I am very self-conscious about my health | -0.746** | I am very self-conscious about my health | |
| I am generally attentive to my inner feelings about my health | -0.676** | I am generally attentive to my inner feelings about my health | |
| I am constantly examining my health | -0.663** | I am constantly examining my health | |
| I reflect on my health a lot | -0.658** | I reflect on my health a lot | |
| Self-control (7 items) | 0.4871 | 0.6826 | |
| I am good at resisting temptation | 0.814** | I am good at resisting temptation | |
| I have a hard time breaking bad habits | -0.758** | I have a hard time breaking bad habits | |
| I refuse things that are bad for me | 0.724** | I refuse things that are bad for me | |
| I am able to work effectively toward long-term goals | 0.697** | I am able to work effectively toward long-term goals | |
| I wish I had more self-discipline | -0.684** | I wish I had more self-discipline | |
| Sometimes, I can't stop myself from doing something, even if I know it is not good for me | -0.663** | Sometimes, I can't stop myself from doing something, even if I know it is not good for me | |
| I often act without thinking through all the alternatives | -0.659** | I often act without thinking through all the alternatives |
Source: Own elaboration.
4.2 Discriminant Analysis
The seven FCVs and the three psychographic variables were used as discriminants or predictors of snack/beverage choices. Three discriminant functions significantly contribute to distinguishing choices (Wilk's lambda = 0.703, P = 0.000). The standardized canonical discriminant coefficients (see Table 2) indicate that choices significantly depend on the importance assigned to the emotional, healthiness and sustainability, weight control, utilitarian, and convenience values of manufactured food. In the second discriminant, the sign of the discriminant coefficients for healthiness and sustainability and weight control are opposite to the utilitarian and convenience values. This result suggests a trade-off between the safety, healthiness, environmental friendliness, and weight-control value of food and the hedonic, money-worth, accessibility, and easiness meta-attributes that add utilitarian value to snacks and beverages. All FCVs, except for the novelty of functional food/beverages, discriminate between choices, as shown by the correlations above 0.3 on at least one of the discriminant functions. Regarding the individual traits of participants, only health consciousness had a significant but small correlation (0.323) with the third discriminant. Therefore, FCVs are the main drivers of food and drink selection.
The overall one-leave-out classification rate of the linear discriminant functions was 81.3%. The healthiest selection namely (healthy snack, healthy beverage), was the category with the highest correct classification rate (94.2%). In contrast, the choice with the highest misclassification rate (62.1%) was the (unhealthy snack, healthy beverage) choice, which was also the least frequent selection.
Table 2 Standardized Canonical Discriminant Function Coefficients.
| Discriminant Function | |||
|---|---|---|---|
| 1 | 2 | 3 | |
| Safety and sustainability | .263 | -.495 | .072 |
| Weight control | .369 | -.475 | .092 |
| Convenience | .185 | .630 | .807 |
| Basic sensory attributes | .153 | .351 | .067 |
| Traditionalism | .307 | .192 | -.005 |
| Emotional | .568 | -.499 | -.628 |
| Novelty of functional food | .023 | .255 | -.039 |
| Self-control | .036 | .019 | .100 |
| Self-assessment of diet quality | .016 | .139 | -.043 |
| Health consciousness | .083 | .107 | .323 |
Source: Own elaboration.
4.3 Classification Tree
The "One Standard Deviation" tree, which is the smallest tree (number of nodes) with a misclassification error within one standard error of the minimum mis-classification error tree was analyzed. Prior probabilities were set equal to the percentages of participants that picked up one of the possible four choices. The Gini impurity function was used to do the splitting, and the k-fold cross-validation method with MINITAB software defaults was used to estimate the misclassification error rate. The resultant tree is shown in Figure 1. The overall correct classification rate for the training set was 82.8%, and for the test set, 78.5%, akin to the LDA rates. Once again, the healthiest selection had the highest correct classification rate, 95.3% for the training set and 90.7% for the test set. However, the tree depicts the sequence of FCVs that compose the overall utility of the final snack/beverage choice.
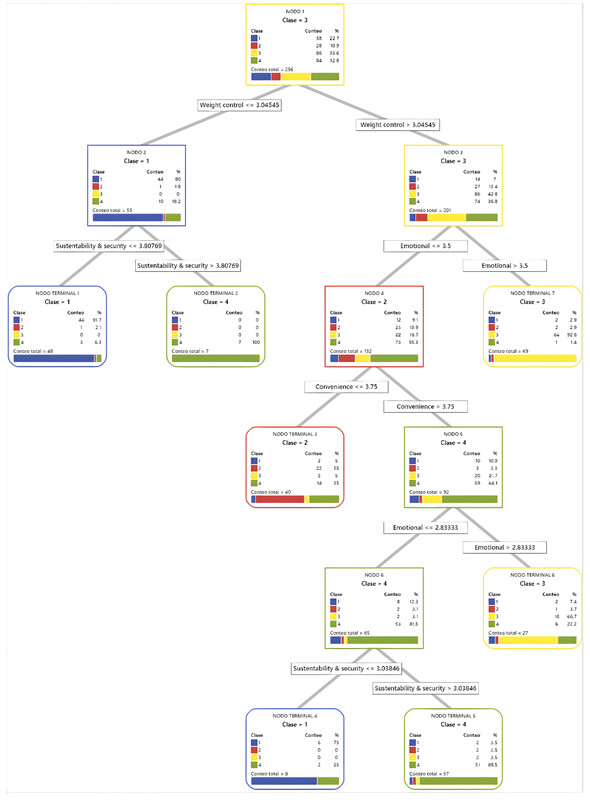
Source: own elaboration.
Figure 1 Classification tree predicting food choices based on food choice values.
Each (snack, beverage) choice can be tracked through the tree, and selection is explained by the contributions of the FCV added at each decision node up terminal nodes where no further decisions are made. The tree diagram shows each snack/beverage choice results from a different hierarchy of values, confirming that each consumer selection is driven by different FCVs that add to the final utility of their selection, thus providing empirical support to H1. For example, the virtually pure terminal node 7 (a node that contains the data from a single class only) largely groups individuals who selected option 3 = (H, H) (25% of participants versus 34% who actually chose option 3). According to the sequence in the tree, this choice was driven by a high worth assigned to the weight-control value and then to the emotional value or feeling of wellness. In contrast, the almost pure terminal node 1 groups a large percentage of participants that selected the unhealthiest choice 1 = (U, U) (17% versus 23% who actually selected option 1). In agreement with the literature, these individuals assigned a low worth to the weight-control and healthiness and sustainability values. None of the FCVs seem to provide utility to these participants, thus suggesting that the unhealthiest selection was impulsive. Pure nodes, such as the terminal node 2, are unimportant because they contain a low percentage of individuals, that is, they correspond to small segments of individuals with unusual selection patterns.
The relative importance of each value is computed by dividing its importance score by the highest importance score of the FCVs and then multiplying by 100%. The emotional value had the largest relative importance (100%), followed by the healthiness and sustainability (94%), weight control (89%), convenience (65%), and traditionalism (27%) values. The traditionalism FCV does not appear in the tree as a primary variable because a "right-sized" tree with a high correct prediction rate is selected among a sequence of optimally pruned trees by the CART algorithm of MINITAB. Note that an FCV might be used for more than one split (emotional value) or not at all (novelty). The addition of the contributions for each of the seven FCVs allows the estimation of how much each one has contributed to a final prediction, namely a snack/beverage choice.
Following the analysis, consumers grouped according to their food/beverage choices were compared regarding their self-control, health consciousness, and demographic characteristics. The MANOVA results revealed highly significant differences between choices depending on the individual characteristics: Wilks-lambda = 0.76212 (P = 0.000), Lawley-Hotelling test = 0.2999 (P = 0.000), and Pillai's trace = 0.24734 (P = 0.000). Univariate ANOVAs using as responses "self-control" and "health consciousness" were performed, including the demographics as covariables (non-controllable factors). In agreement with LDA, only health consciousness influences food/beverage choices. Thus, H2 is unsupported, while H3 is empirically supported. The results of the ANOVA for the only significant psychographic trait are shown in Table 3. Significant differences in health consciousness depending on the age and educational level of participants were also identified. A residual analysis was performed to validate the assumptions of the analysis and identify outliers; no need for transformations was identified, and there was only one residual <-3 that was expected given the sample size of 256 (0.003*256 = 0.768 rounded to one residual).
Bonferroni multiple comparisons indicate that participants who select a healthy snack and any (healthy/unhealthy) beverage are not statistically different concerning their health consciousness. Meanwhile, the individuals who selected the options (unhealthy snack, healthy beverage) or (unhealthy snack, unhealthy be-verage) have equivalent levels of health consciousness. Moreover, the health consciousness of participants who chose a healthy snack is higher than the corresponding levels of individuals who preferred unhealthy snacks. Thus, selecting healthy snacks is significant and positively related to health-consciousness levels, as stated by H3.
Table 3 ANOVA results. The response is health consciousness.
| Source of variation | df | SS | MS | F-value | P-value |
|---|---|---|---|---|---|
| Age | 1 | 4.028 | 4.02818 | 9.17 | 0.003 |
| Sex | 1 | 0.124 | 0.12417 | 0.28 | 0.596 |
| Educational level | 1 | 3.665 | 3.66539 | 8.34 | 0.004 |
| Socioeconomic level | 1 | 0.292 | 0.29247 | 0.67 | 0.415 |
| Food choices | 3 | 11.869 | 3.95619 | 9.00 | 0.000 |
| Error | 242 | 212.721 | 0.87901 | ||
| Lack of fit | 216 | 92.295 | 0.42729 | 0.95 | 0.400 |
| Pure error | 26 | 14.052 | 0.45172 | ||
| Total | 250 | 134.044 |
Source: own elaboration.
Regarding the demographic variables, participants who selected the unhealthy snack but the healthy beverage were the oldest. As previously argued, this result could be attributed to the belief among individuals over 50 years old that sweetened beverages are particularly unhealthy and should be avoided. In comparison, the unhealthiest option (1=U,U) was preferred by youngsters (between 19-25 years old), a result that may be attributed to the greater concern and better dietary behaviors of adults in comparison with youths who are especially fans of snack food that they bought not for necessity but because of fun, low price, in-store promotion, and ease of purchase (Nagai, 2020). Multiple comparison tests (Bonferroni and Tukey) did not show differences in health consciousness due to educational level. However, a weak (0.207) but significant correlation between educational level and age was identified, thus suggesting that health consciousness increases with age until some point but is not significantly affected by educational level.
The influence of the self-assessment of diet quality was assessed through a cross-tabulation and chi-square test (χ2 = 6.290, P-value = 0.711) because the variable is dichotomous. Results show there are no significant differences in food/beverage choices depending on the perceptions of the individual's diet quality. Therefore, H4 was unsupported. The non-significance of this construct could be attributed to the low validity of the binary measure, or it may be because snacks between meals are skipped by some consumers and considered non-critical for others compared to food and drinks consumed during regular meals.
5. Conclusions, Recommendations, and Future Research
A challenge faced by marketers and health organizations is how to influence the purchase behavior of consumers in favor of healthier products, given the large variety of products in the snack market and the association of snacking with indulgence and impulse. This work draws on the generic theory of Consumption Values and the empirically validated food choice values metrics to identify seven food choice values as the underlying motives influencing snack and beverage choices. The application of linear discriminant analysis and classification trees allows the identification of the sequence of FCVs that predicts the choice of healthy/unhealthy mid-day snacks that deliver the maximum utility to the individual. This research introduces classification trees as an innovative analytic tool to understand consumer choices.
Understanding healthy food choices using classification trees provides a hierarchical display of FCVs, where the most important one is the first used to split consumers according to their choices. For example, consumers who choose a healthy food and a healthy beverage first value the weight control rendered by their selection and then the well-being feelings derived from the consumption of healthy products. These findings can be used by food manufacturers to design new products with appealing meta-attributes and better market them to different consumer segments, and by health organizations to design health communication campaigns and interventions that increase the health consciousness of consumers.
The results of the study show a large percentage (66.4%) of consumers prefer healthy snacks (nuts or dried fruit) because they assign higher importance to weight control, healthiness and sustainability, well-being emotions, and appreciate their convenience and traditionalism. This finding corresponds with the notion that healthy foods help to keep an appropriate weight and contribute to well-being, targeting consumers who are conscious about their nutrition and health. Food marketers can promote food innovations and re-formulated products by highlighting that snacks such as unsalted mixes of vegetables and seeds contain more nutritious ingredients than re-formulated snacks with less not-so-good ingredients (e.g., sugar). The basic attributes of "good for the price" and "tastiness" must be the basis for the promotion of regular snacks among youngsters who find low value for all FCVs and select unhealthy choices more by impulse and short-term gratification.
Because the "novelty of functional food" seems to be a non-appreciated value (Muro-Rodríguez et al., 2021), but sustainability is, food innovations could be promoted as more environmentally friendly because they are made from natural ingredients and packed in ecological wraps. Moreover, food producers could benefit from improving the hedonic and convenience attributes of healthy snacks and beverages to target new consumer segments that balance nutritional with utilitarian (he-donic and price) value (Sigurdsson et al., 2017; Arroyo et al., 2020). Thus, by emphasizing (deemphasizing) important (unimportant) FCVs, food marketers could influence consumers' snack selections.
Regarding beverages, results suggest sodas, artificially flavored beverages, and juices manufactured from nutritious fruits are credited as unhealthy beverages that should be consumed occasionally because of their high energy contribution. However, the nutritional and hedonic value of non-sugared, natural, healthy beverages must be communicated, and their combination with healthy snacks (e.g., lyophilized fruits and vegetables) must be endorsed as an alternative for indulgence while maintaining a proper energy intake.
The research also confirms that health consciousness is a psychographic trait that mainly influences the decision to consume healthy snacks but not beverages. Although the role of health consciousness in food selection has been largely discussed, its negative influence on the consumption of unhealthy snacks has not been sufficiently addressed in the available literature. Meanwhile, self-control and self-assessment of diet quality had a non-significant effect on the selection of mid-day snacks. The low reliability of the self-control scale and the use of a surrogate binary variable for diet quality evaluation could explain the non-significance of these consumers' traits in the choice of snacks/beverages. Further studies could improve these limitations by developing more valid scales to assess the effect of these variables on healthy versus unhealthy snack/beverage choices.
Previous studies report a significant influence of self-control on healthy snacking (Cobb-Clark et al., 2019; Honkanen et al., 2012), but recent research (Marques et al., 2020) shows that impulsivity, an unplanned action marked by fast decision-making antagonistic to self-control, does not affect food choices when there is a wide variety of choices. The large variety of manufactured snacks in the Mexican market could explain the non-significant effect of self-control on the selection of heal-thy snacks. Consumers may be overwhelmed by the large set of options and deviate from a time-consuming cognitive assessment process of the snacks' utility and select them because they are available, advocated by others, or simply because they are in the mood to consume a different product. Another explanation is that self-control needs to be combined with positive attitudes (Honkanen et al., 2012), health consciousness, or health risk perceptions (Chou et al., 2020) to inhibit impulsive unhealthy choices. This work did not propose interactions between the psychographic and demographic variables. Therefore, a relevant extension is to include moderator effects in the prediction of snack/beverage choices.
Additional works derived from this research include the selection of a probabilistic stratified sample that guarantees the representativeness of various age groups because in this study the group of young adults is over-represented. A stratified random sample would also allow a comparison of how food values influence food choices for different age generations (e.g., millennials vs. centennials) or brand trust levels. The use of supplementary variables, such as attitudes toward healthy food, health risk perceptions, and health condition, is another interesting extension to this study that could improve the profiling of consumers who prefer healthy versus unhealthy mid-day snacks.