


Services on Demand
Journal
Article
 English (pdf)
 Article in xml format
 Article references
 Send this article by e-mail
Indicators
-
 Cited by SciELO
 -
 Access statistics
Related links
-
 Cited by Google
 -
 Similars in
SciELO
Similars in
SciELO -
 Similars in Google
Share

 Permalink
TecnoLógicas
Print version ISSN 0123-7799On-line version ISSN 2256-5337
TecnoL. vol.18 no.34 Medellín Jan./June 2015
Artículo de investigación/Research article
Correlation analysis between ceramic insulator pollution and acoustic emissions
Análisis de correlación entre la contaminación de aisladores cerámicos y emisiones acústicas
Benjamín Álvarez-Nasrallah1, John E. Candelo-Becerra2, Jose D. Soto-Ortiz3, Julio Pombo-Acevedo4, Omar Díaz-Aparicio5
1Electrical engineer, M.Sc., Department of Electrical and Electronics Engineering, Universidad del Norte, Barranquilla-Colombia, bnasrallah@gmail.com
2Electrical engineer, PhD., Department of Electrical Energy and Automation, Mines Faculty, Universidad Nacional de Colombia, Medellín-Colombia, jecandelob@unal.edu.co
3Electrical engineer, M.Sc., Department of Electrical and Electronics Engineering, Universidad del Norte, Barranquilla-Colombia, jsoto@uninorte.edu.co
4Electrical engineer, MBA, Operation and Maintenance Center, TRANSELCA S.A., Barranquilla-Colombia, jpombo@transelca.com.co
5Electrical engineer, Operation and Maintenance Center, TRANSELCA S.A., Barranquilla-Colombia, odiaz@transelca.com.co
Fecha de recepción: 15 de julio de 2014 / Fecha de aceptación: 10 de diciembre de 2014
Como citar / How to cite
B. Álvarez-Nasrallah, J. E. Candelo-Becerra, J. D. Soto-Ortiz, J. Pombo-Acevedo y O. Díaz-Aparicio, “Correlation analysis between ceramic insulator pollution and acoustic emissions”, Tecno Lógicas, vol. 18, no. 34, pp. 101-108, 2015.
Abstract
Most of the studies related to insulator pollution are normally performed based on individual analysis among leakage current, relative humidity and equivalent salt deposit density (ESDD). This paper presents a correlation analysis between the leakage current and the acoustic emissions measured in a 230 kV electrical substations in the city of Barranquilla, Colombia. Furthermore, atmospheric variables were considered to develop a characterization model of the insulator contamination process. This model was used to demonstrate that noise emission levels are a reliable indicator to detect and characterize pollution on high voltage insulators. The correlation found amount the atmospheric, electrical and sound variables allowed to determine the relations for the maintenance of ceramic insulators in high-polluted areas. In this article, the results on the behavior of the leakage current in ceramic insulators and the sound produced with different atmospheric conditions are shown, which allow evaluating the best time to clean the insulator at the substation. Furthermore, by experimentation on site and using statistical models, the correlation between ambient variables and the leakage current of insulators in an electrical substation was obtained. Some of the problems that bring the external noise were overcome using multiple microphones and specialized software that enabled properly filter the sound and better measure the variables.
Keywords: Insulator pollution, leakage current, acoustic emissions, environment, ceramic insulator.
Resumen
La mayoría de los estudios relacionados con la contaminación de aisladores son desarrollados normalmente con base en un análisis individual entre la corriente de fuga, la humedad relativa y la densidad de los depósitos de sal equivalente (ESDD). Este trabajo presenta un análisis de correlación entre la corriente de fuga y las emisiones acústicas medidas en una subestación eléctrica de 230 kV, en la ciudad de Barranquilla, Colombia. Además, se consideraron variables atmosféricas para desarrollar un modelo de caracterización del proceso de la contaminación de los aisladores eléctricos. Este modelo fue utilizado para demostrar que los niveles de emisión de ruido son un indicador fiable para detectar y caracterizar la contaminación en aisladores de alta tensión. La correlación encontrada entre las variables atmosféricas, eléctricas y las de sonido permitieron determinar las relaciones para el mantenimiento de los aisladores cerámicos en zonas de alta contaminación. En este artículo se muestran los resultados de la investigación sobre el comportamiento de la corriente de fuga en aisladores cerámicos y el sonido que se producen ante diferentes condiciones atmosféricas, lo cual permite evaluar el mejor momento para limpiar el aislador en la subestación. Además, mediante experimentación in situ y utilizando modelos estadísticos, se obtuvo la correlación entre las variables ambientales y la corriente de fuga de aisladores en una subestación eléctrica. Algunos de los inconvenientes que trae el ruido externo en la medición fueron superados utilizando varios micrófonos y software especializado que permitían filtrar correctamente el sonido y lograr una mejor medición de las variables.
Palabras clave: Polución de aisladores, corriente de fuga, recepción acústica, medio ambiente, aislador cerámico.
1. Introducción
Electrical substations in high-polluted zones have major problems with reliability of the network. Ceramic insulators are commonly subjected to high level of contamination such as marine, industrial, sand, and other contaminants that reduce their performance and dielectric properties. Pollution in insulators triggers an unfavorable reaction in the increase in leakage current, due to high pollution rates in the material.
Insulator washing is performed with energized lines to avoid disconnections, but the frequency of cleaning each element is still unknown for some places due to the local climate conditions. The cost of washing insulators is high, due to the amount of activities programmed during a year and the material such as water with conductivity greater than 1500 W cm (591 W inches).
Some pollutions problems have been previously reported in the city of Barranquilla, Colombia [1], [2]. The results showed that during the rainy period the pollution of insulators was low, but during the dry period the pollution was high [1]. Few studies have been proposed to evaluate the severity of the pollution on insulators and more methods must be tested to identify the different behavior of insulators in high-polluted areas.
Currently, there are several methods to detect different levels of pollution. One of them is the equivalent salt deposit density (ESDD), which is the most direct measurement of conductive contaminants on the surface of the insulator. However, this procedure needs chemical tests and removing deposits from insulators, which is time and resource consuming [3].
Another reliable method to detect the levels of pollution in an electrical insulator is the monitoring of leakage current. The system usually consists of three components: the sensor, transducer and software. A microprocessor controls the gathering and processing of information and the data acquisition unit is connected to a computer or it is sent remotely using the serial port RS-232 [4].
Another method used to detect anomalies in the insulators is the infrared image. Salt deposits or dirty insulators help the appearance of leakage currents and the temperature of the equipment increases. A thermography image can determine if the insulator is at an acceptable temperature [5]. This procedure has been complemented using image processing to analyze hot spots [2].
Another method consists in the detection of arcs or partial discharge of insulator. The method uses an optical sensor with a link of fiber, a micro-computer controlled processing module, a link by satellite, and a solar panel with battery. The most important characteristics obtained from the leakage current signal are stored internally in the micro-controller and it enables to be transmitted through the communication link [6]. Acoustic emissions have been used for several applications in engineering. Among the application in electrical engineering are: corona effect [7], electrical machines [8], and insulator monitoring [9].
This paper proposes the use of an acoustic emission method to identify the variation of leakage current with climate variables. The test was performed on a 230 kV substation and several models were obtained to correlate climate variables, leakage current and noise.
2. Methodology
In this work, statistical analyses were carried out to obtain a relationship among the leakage current [10], the atmospheric variables and the sound produced by polluted ceramic insulators. All behavior of the variables were analyzed and compared to determine a correlation.
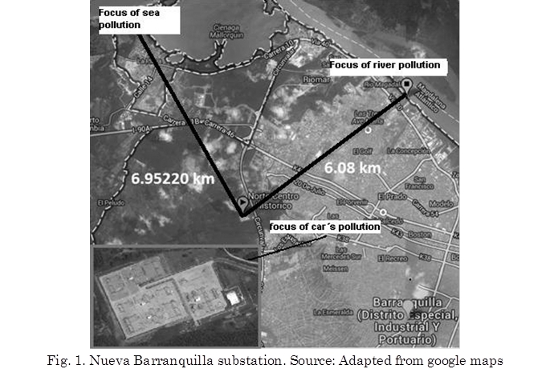
2.1 Location
The electric power substation Nueva Barranquilla is located in the city of Barranquilla. The distance to the sea is about 6.95 km and to the river is 6.08 km. As the wind blows from 4-5 m/s, the selected substation is subjected to high sources of pollution as shown in Fig. 1.
2.2 Leakage current measurement
Leakage current measurements were performed in a bay of the substation using a coil around an insulator as shown in Fig. 2a. The current circulating through the coil was measured using a meter KYORITSU model 2432. The ammeter has ranges of 4 mA, 40 mA and 100 A. The resolution of the meter was 0.001 mA and the accuracy of ± 1% for the scale of 4 mA and 0 to 80 A and ± 5% for the scale of 40 mA and 80.1 to 100 A.
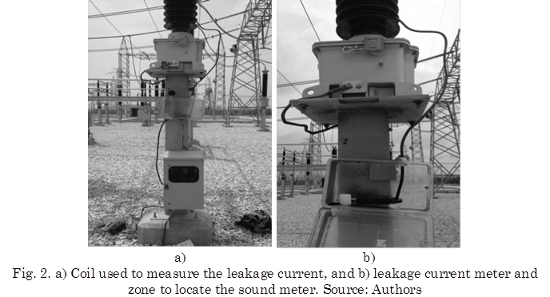
2.3 Acoustic emissions measurement
The experiment consisted of identifying the noise produced by polluted insulators and performing a correlation with the leakage current. A digital sound meter, Extech model 407764, with a data visualization software was used for the reception of noise emissions. All measures were captured with a computer every 20 seconds for 2 periods of washing.
The sound meter was located near the current transformer and the leakage current meter shown in Fig. 2b. The microphone was located near the insulator to better capture the noise. One problem presented during the test was the detection of external noise produced by other elements, but the correct location of equipment and the used of multiple microphones and software allowed to filter the unwanted noise.
2.4 Climate measurements
For this research, ambient temperature, relative humidity, air pressure, solar irradiance, wind speed, and wind direction were measured. The weather station was placed close to the electrical variables meters.
During the test, the maximum wind speed was 26.1 m/s and the average wind speed was 3.4 m/s, being an important role in the deposition rate of contaminants on the insulator surface. The highest percentages of wind directions were obtained from the Northeast and East in a range of 60° to 120° and the lowest was obtained from the North in a range of 0° to 20°. The wind direction helped to contaminate the insulation of the substation due the wind came from the main contamination sources as the sea and the river. Several insulators chains with ceramic plates were suspended to confirm that the contamination process during the test was obtained according to the wind direction.
3. Results and analysis
Comparisons between the acoustic emission measurements, atmospheric variables and loadability of the line were performed.
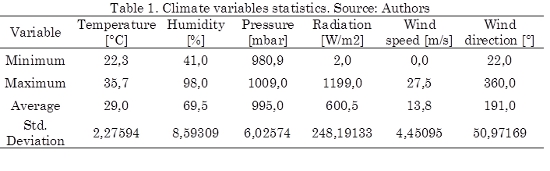
3.1 Climate data
Climate variables were measured from December 2011 to December 2012. Table 1 shows maximum, minimum, average, and standard deviation of temperature, humidity, atmospheric pressure, radiation, wind speed, and wind direction.
3.2 Acoustic emissions
Fig. 3 shows the acoustic emissions measured during a washing period. The noise emission level was between 50 and 60 dB SPL for the first day after washing insulators. From the second day until the sixth day, the noise emission raised gradually according to the pollution presented in insulators, reaching between 60 to 70 dB SPL (sound level emitted by a pneumatic drill 50').
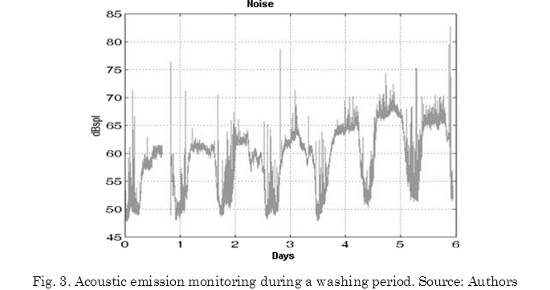
In order to confirm the contamination level, the ESSD was measured for insulators located at the test points. Experienced operators noted the noise started increasing after washing, until the warning of risk of failure in the sixth day. In Fig. 3, a noise increasing and decreasing is presented due to the change in atmospheric conditions during the day. However, the noise emissions increased through the days and reached the warning decibels for washing insulators.
Fig. 4 shows the emission changes hour by hour for 2 days. During the morning (7-8 am), the noise emissions are reduced due to changes in humidity and load, but in the afternoon (4 pm) as humidity and load changed, the acoustic emissions increased. As the test was performed for an open substation, some sounds such as cars, construction, humans, among others were detected using a sound meter.
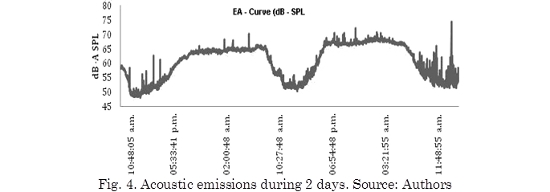
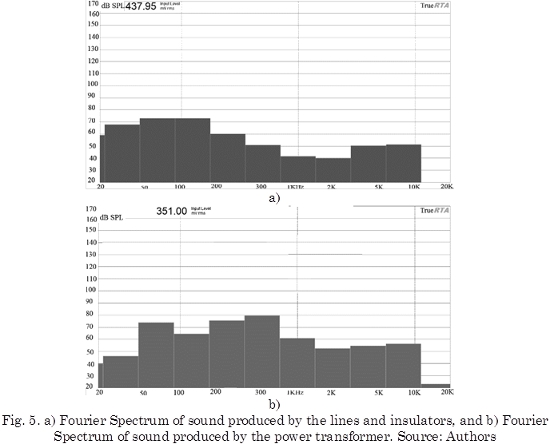
A sound test was performed using the TrueRTA’s audio spectrum analyzer software to identify all noises and separate them from the noise produced by leakage current. Most external sounds were easily filtered and only the noise of the lines and transformers close to the test were processed as presented in Fig. 5a and Fig. 5b, to separate them from the noise produced by leakage current.
3.3 Linear model
A linear model based on multiple linear regression by transformation Box-Cox between the leakage current versus moisture and sound was obtained as follows.
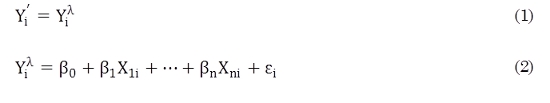
Where, Yi is the dependent variable defined as the leakage current and X1, X2,..., Xn, are the independent variables defined as the acoustic emissions and climate variables measured during the test. The constants β0, β1,…,βn, are the regression coefficients in the model, indicating the relative weight of the variable in the equation, and ε is the error [11].
Table 2 shows the test of the model considering the value of R-square, the absolute error, and the standard error. This table shows that the model used has a good performance with the input variables used to identify the behavior of the leakage current.
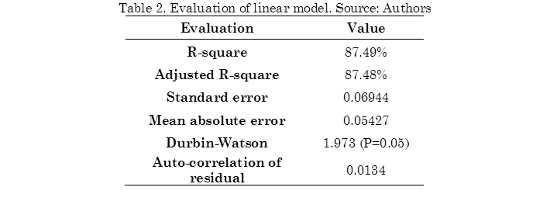
This model helped to find a relationship between the leakage current, humidity, and the sound produced by the insulator, for different periods and ESSD analysis.
3.4 Correlation analysis
A multivariate analysis with the software Statgraphics Centurion was performed. As the test considered more than 100 samples, the Spearman correlation was used and the results are shown in Table 3.
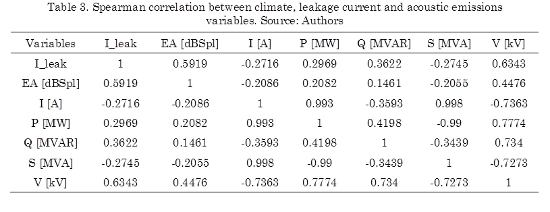
From this correlation, there is a high ratio and body moisture leakage current, so it is expecting that moisture changes from being represented in leakage current changes.
Another important point of this study is the high correlation between noise and leakage current, so we can conclude that acoustic emissions are a good indicator of pollution in the substation.
Table 4 shows the correlation among electrical, leakage current and acoustic emissions. Voltage, acoustic emissions and leakage current have a high correlation, which can be related to the load change during the day.
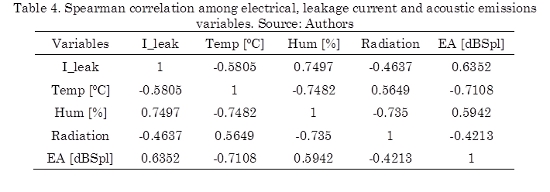
Although this result is important for maintenance, it is important to perform more studies of the correlation of common events to determine their behavior for long periods.
4. Conclusions
In this research, the variation of the sound was registered and associated with other climate variables, founding the most significant relations among them. This paper has shown that insulator pollution and noise emissions are highly correlated and can be used to identify insulator pollution variation. Another important finding in this study is the confirmation that the change in humidity and voltage are good indicators of the change in leakage current, therefore load changes must be considered. Although this pattern is repeated during the 7 days of the week, there is a progressive increase emission over time representing a pollution increasing. Other noises were detected such as flashing, aircrafts, personnel, but those do not interfered during the test due to the shortest noise periods they produced, all different sounds were identified and separated for the analysis. The linear model obtained good results to represent the leakage current from variables such as acoustic emissions and climate variables. The test was performed in a real 230 kV electric substation, where insulator washing must be always performed, avoiding to obtain the maximum noise of circuit failure. In future research, we will determine a pollution map using the sound meter, improve the acoustic emissions model according to the climatic change during different seasons, analyzed the different air pollutants in the area, and model the behavior of different contaminants and insulators.
5. Acknowledgment
Authors would like to thank to the Power System Research Group GISEL of the Universidad del Norte, Barranquilla, Colombia, for their financial support to conduct this research. Special thanks to the electrical engineers John De La Ossa, Johnathan Lafaurie, and Rafael Miranda Castro for their important help with the test. Also we would like to thank to the company TRANSELCA S.A. E.S.P. for the valuable information provided for this research.
References
[1] G. Aponte, J. C. Castro, V. H. Sanchez, A. Espinoza, N. Rosales, and M. Castro, “Contamination level evaluation on Colombian north cost,” IEEE Lat. Am. Trans., vol. 7, no. 2, pp. 190-195, Jun. 2009. [ Links ]
[2] R. Diaz, J. E. Candelo, and J. Betancur, “Software tool to detect hot spots on electrical insulators,” in 2013 12th International Conference on Environment and Electrical Engineering, 2013, pp. 7-12. [ Links ]
[3] J. C. Quintana Suarez, M. Martínez Melgarejo, J. Romero Mayoral, M. A. Quintana Suárez, F. Díaz Reyes, and J. Cruz Norro, “Modelo predictivo para la determinación de contaminación salina en aisladores eléctricos,” in 9th. Spahish Portuguese Congress on Electrical Engineering, 2005, pp. 1-5. [ Links ]
[4] Z. Tingtao, L. Tianyu, C. Ke, and H. Xiaoguang, “On-line monitoring system of insulator leakage current based on ARM,” in 2011 6th IEEE Conference on Industrial Electronics and Applications, 2011, pp. 365-369. [ Links ]
[5] X. Jiang and Q. Xia, “Influence of contamination on deteriorated insulators detection with infrared imaging method,” in 2010 International Conference on High Voltage Engineering and Application, 2010, pp. 457-460. [ Links ]
[6] R. A. de Lima, E. Fontana, J. F. Martins-Filho, T. L. Prata, G. O. Cavalcanti, R. B. Lima, S. C. Oliveira, and F. J. M. M. Cavalcanti, “Satellite telemetry system for pollution detection on insulator strings of high-voltage transmission lines,” in 2009 SBMO/IEEE MTT-S International Microwave and Optoelectronics Conference (IMOC), 2009, pp. 574-577. [ Links ]
[7] S. A. Mahmood Najafi, A. Peimankar, H. Saadati, E. Gockenbach, and H. Borsi, “The influence of corona near to the bushing of a transformer on partial discharge measurement with an acoustic emission sensor,” in 2013 IEEE Electrical Insulation Conference (EIC), 2013, pp. 295-298. [ Links ]
[8] H. Tischmacher, I. P. Tsoumas, B. Eichinger, and U. Werner, “Case studies of acoustic noise emission from inverter-fed asynchronous machines,” in The XIX International Conference on Electrical Machines - ICEM 2010, 2010, pp. 1-8. [ Links ]
[9] C. M. Pei, N. Q. Shu, L. Li, Z. P. Li, and H. Peng, “On-line monitoring of insulator contamination causing flashover based on acoustic emission,” in 2008 Third International Conference on Electric Utility Deregulation and Restructuring and Power Technologies, 2008, pp. 1667-1671. [ Links ]
[10] R. Hernández Sampieri, C. Fernández-Collado, and P. Baptista Lucio, Metodología de la investigación, vol. 18. Mc. Graw Hill, 2006, p. 850. [ Links ]
[11] D. Moore, Estadística aplicada básica, 2nd ed. Antoni Bosch, editor, 2005, p. 874. [ Links ]
