


Serviços Personalizados
Journal
Artigo
 Inglês (pdf)
 Artigo em XML
 Referências do artigo
 Enviar este artigo por email
Indicadores
-
 Citado por SciELO
 -
 Acessos
Links relacionados
-
 Citado por Google
 -
 Similares em
SciELO
Similares em
SciELO -
 Similares em Google
Compartilhar

 Permalink
TecnoLógicas
versão impressa ISSN 0123-7799versão On-line ISSN 2256-5337
TecnoL. vol.18 no.35 Medellín jul./dez. 2015
Artículo de investigación/Research article
Equivalent circuits for simulating irregular PV arrays under partial shading conditions
Circuitos equivalentes para simular arreglos PV irregulares bajo condiciones de sombreado parcial
Luz A. Trejos-Grisales1, Carlos A. Ramos-Paja2, Andrés J. Saavedra-Montes3
1Magíster en Ingeniería Eléctrica, Línea de Investigación Automática, Universidad Nacional de Colombia, Medellín-Colombia, latrejosg@unal.edu.co
2Doctor en Ingeniería Electrónica Automática y Comunicaciones, Facultad de Minas, Universidad Nacional de Colombia, Medellín-Colombia, caramosp@unal.edu.co
3Doctor en Ingeniería Eléctrica, Facultad de Minas, Universidad Nacional de Colombia, Medellín-Colombia, ajsaaved@unal.edu.co
Fecha de recepción: 17 de marzo de 2015 / Fecha de aceptación: 3 de junio de 2015
Como citar / How to cite
L. A. Trejos-Grisales, C. A. Ramos-Paja y A. J. Saavedra-Montes, “Equivalent circuits for simulating irregular PV arrays under partial shading conditions”, Tecno Lógicas, vol. 18, no. 35, pp. 57-69, 2015.
Abstract
Modeling and simulation of photovoltaic (PV) systems are open research areas since I-V and P-V curves are commonly required to analyze the performance of PV installations. To obtain such curves commercial software packages can be used, however the connection type and size of the PV array may cause large simulation times. To overcome such an issue several techniques based on analyzing the inflection points have been proposed to model the PV array with the aim of reconstruct accurately the required electrical curves. However, such analysis has been applied only for series-parallel (SP) configuration, which is just one alternative to connect PV arrays among several other regular or irregular options. Therefore, a more general approach is needed. This paper presents an approach to obtain the characteristics curves for any PV array, regular or irregular, by extending the inflection points analysis. Then, the calculation of the PV array electrical curves is simplified by using equivalent circuits within the intervals defined by the inflection points. Such a procedure is based on defining which modules become active due to the behavior of the bypass diodes. Finally, the proposed approach enables to analyze any PV array without requiring long electrical simulations. The solution was validated by means of simulation results obtained in Matlab®.
Keywords: Math representation, non-uniform PV generator, equivalent circuits.
Resumen
El modelado y simulación de sistemas fotovoltaicos (PV) son áreas de investigación abiertas ya que las curvas I-V y P-V son comúnmente requeridas para analizar el desempeño de instalaciones PV. Para obtener dichas curvas se pueden utilizar paquetes de cómputo, sin embargo, el tipo de conexión y el tamaño del arreglo PV pueden ocasionar largos tiempos de simulación. Para superar dicha dificultad se han propuesto técnicas basadas en los puntos de inflexión para modelar el arreglo PV con el objetivo de reconstruir exactamente las curvas eléctricas requeridas. Sin embargo, tal análisis ha sido aplicado solo a la configuración serie-paralelo (SP), la cual es solo una de las alternativas para conectar arreglos PV entre otras opciones de conexión regular o irregular. Por esto, se requiere una aproximación más general. Este artículo presenta una aproximación para obtener las curvas características de cualquier arreglo PV, regular o irregular, extendiendo el análisis de los puntos de inflexión. Entonces, de las curvas eléctricas del arreglo PV es simplificado utilizando circuitos equivalentes en intervalos definidos por los puntos de inflexión. Tal procedimiento está basado en definir cuáles módulos se activan debido al comportamiento de los diodos de bypass. Finalmente, la aproximación propuesta permite analizar cualquier arreglo PV sin requerir de simulaciones largas. La solución fue validada por medio de resultados de simulación obtenidos en Matlab®.
Palabras clave: Representación matemática, generador PV no uniforme, circuitos equivalentes.
1. Introduction
Photovoltaic (PV) systems are a relevant research area due to the new energetic tendencies, which promote the conservation of the environment and the reduction of the use of power sources based on fossil fuels because of their negative environmental impact and their increasing price [1]. For some countries in Latin America, PV systems are a priority, such is the case of Argentina, Ecuador, Honduras and Nicaragua, where a system based on feed-in tariffs have been implemented with the aim of strengthen the use of PV energy and other renewable sources [2], [3]. In the case of Colombia, the law 1715 of 2014, signed on May 13 of 2014, promotes the use of non-conventional energy sources, as well as the research and development on clean technologies [4].
In such a context, modeling PV systems is one of the most important research areas due to the need of obtaining information about the performance and energy production of a PV system under different operating conditions. PV systems can be analyzed through its electrical characteristic curves: current vs. voltage (I-V) and power vs. voltage (P-V), which can be obtained by means of commercial simulation packages. However, those packages have some drawbacks: they do not enable to represent mismatching conditions which can provide inaccurate results, the connection and size of the PV array may cause long simulation times, high license cost, not supporting the interfacing of the PV arrays with power electronic systems, among others [5].
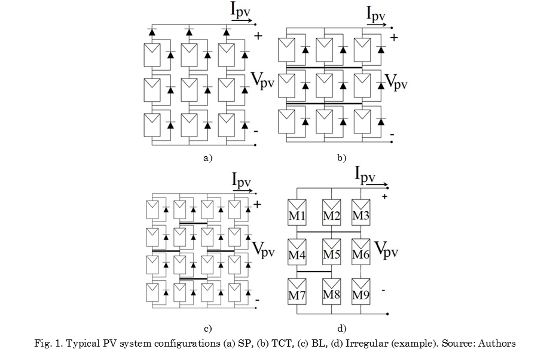
Such conditions makes impossible to study the performance of very large arrays during long periods of time to analyze or predict the viability of the solutions. Therefore, mathematical modeling and circuital analysis become a suitable option to overcome the issues above mentioned. In such a way, the work presented in [6] introduces a technique for obtaining the energy yield of PV systems as well as their characteristic curves. That technique is based on the inflection points concept which is related to the operation conditions in which the derivative of the I-V curve becomes discontinuous. In this way, each inflection point defines a set of non-linear equations which represents the system. The PV module is represented by means of the ideal PV model and the bypass diode is modeled as an ideal switch to simplify the computing process since this technique is oriented to large PV systems. On the other hand, in [9] the inflection points concept is used but in this case the module is represented by means of the practical PV model which considers parallel and series resistances, in addition the bypass diode is modeled using a linear approach. In [6] and [9], the technique is applied to Series-Parallel (SP) configuration, but it is important to consider other configurations such as Total Cross Tied (TCT), Bridged-Linked (BL) and irregular structures, since they can be very effective to reduce the detrimental effect of some shading patterns [7]. Fig. 1 illustrates such configurations.
Several mathematical models have been reported for representing the SP configuration, i.e. [5], [8]. Moreover, the mathematical models of TCT, BL and Honey-Comb (HC) configurations have been addressed in [7] and [10]. However, there is not a unique modeling technique able to represent any configuration, which implies the requirement of developing several algorithms to compare the performance of different configurations in a given scenario. Such a condition increases the computational cost of analysis tools based on mathematical models. On the other hand, if the structure under study is an irregular one, a whole new mathematical model must be developed since, currently, there is not reported in literature a model for this kind of structures.
This paper proposes an approach for obtaining the inflection points of any PV system, typical or irregular. The approach is based on the analysis of the short-circuit currents to obtain equivalent circuits valid for each range limited by the inflection points. In this way, the I-V and P-V curves can be easily calculated in each section by solving the equations modeling each equivalent circuit. This allows to reduce the calculation time, retaining a good level of accuracy with respect to traditional solutions. Moreover, this approach only requires any software capable of solving non-linear equations systems. In addition, since the simulation time is reduced, the proposed solution allows to analyze larger PV arrays which is useful in planning studies and economic projections. The paper is organized as follows: Section 2.1 provides the main concepts concerning to the existence of irregular PV structures in real applications. Section 2.2 describes the inflection points technique. Section 2.3 is devoted to explain the process to obtain the equivalent circuits of the irregular PV array. Section 3 addresses the calculation of the inflection points of an irregular array. Finally, conclusions close the paper.
2. Methodology
2.1 Irregular PV arrays in real applications
In literature the regular PV array configurations are widely adopted, e.g. SP, TCT, BL; but in practical PV applications those configurations are not always obtained due to the internal composition of the PV panels. For example, the BP585 is a panel formed by 36 PV cells divided into 2 modules connected in series, each one of them is formed by 18 cells and connected in anti-parallel with a bypass diode. In such a way, constructing a TCT structure using BP585 panels leads to an irregular structure. Fig. 2a shows an apparent TCT configuration, however taking into account the internal connection of the BP585 panels, the actual connection is the one shown in Fig. 2b.
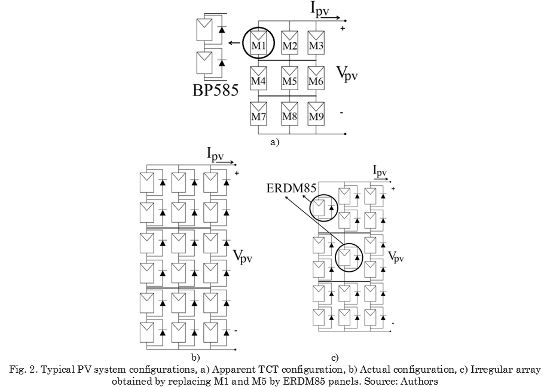
For example, the BP585 can be replaced by the ERDM85 since both have similar characteristics. However, the ERDM85 has one module formed by 36 PV cells connected in anti-parallel with a bypass diode, which would change the configuration of the array drastically. This situation is illustrated in Fig. 2c, where the same TCT configuration of Fig. 2a and 2b is considered but replacing M1 and M5 by ERDM85 panels. Then, the new structure is irregular despite the panels are connected in TCT.
The previous examples put in evidence the existence of irregular PV arrays in practical applications; hence it is necessary to develop a modeling technique to analyze this kind of arrays. Such a problem is solved in this paper.
2.2 Inflection points and bypass diodes activation
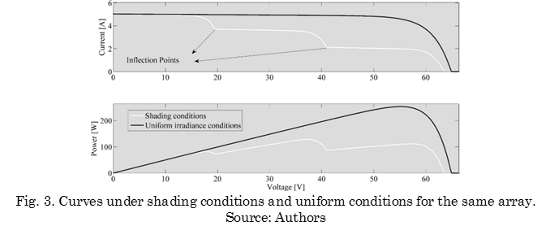
The inflection points technique was introduced in [6] and applied only to SP arrays. It is based on the calculation of the modules voltages in which the derivative of the I-V curve becomes discontinuous. These discontinuities are caused by the activation of the bypass diodes due to the differences in the irradiance levels of the PV modules, which is frequently due to the partial shades. In mismatching conditions the derivative of the current and power is discontinuous, while in uniform conditions such a derivative is continuous as is illustrated in Fig. 3.
The inflection points are related to the activation of the bypass diodes, which in turns provides information concerning the number of active and inactive modules: when a bypass diode is inactive the associated module is active and vice versa.
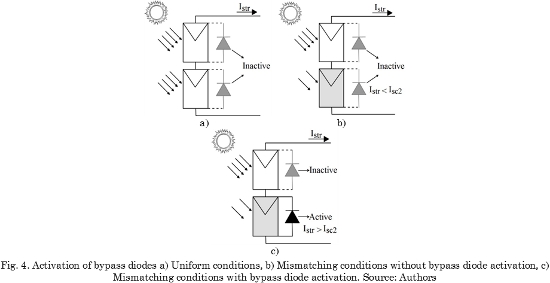
In order to illustrate the activation of a bypass diode associated to a module in a string, Fig. 4a shows two modules connected in series under the same irradiance conditions, therefore the bypass diodes remain inactive. In Fig. 4b, the lower module is exposed to a shadow, and then its irradiance level is lower than the irradiance of the module at the top. However, the bypass diode associated to the shaded module remains inactive since the voltage imposed to the string makes the string current Istr be lower than the module short-circuit current Isc2. In Fig. 4c the shadow intensity stay the same but the new voltage imposed to the string makes the string current Istr be higher than Isc2, which forces to the bypass diode to become active.
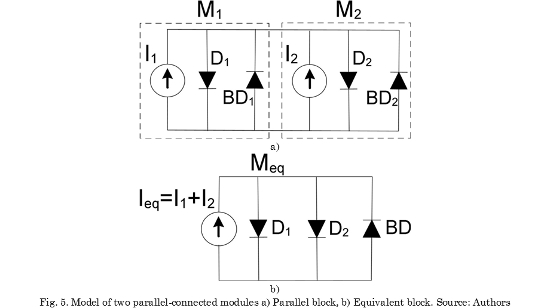
The ideal one-diode model was adopted in this paper to represent the PV modules [6], [9]. Fig. 5a illustrates such a model for modules M1 and M2, in addition the bypass diodes were considered as ideal switches.
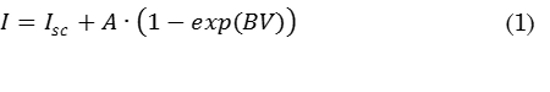
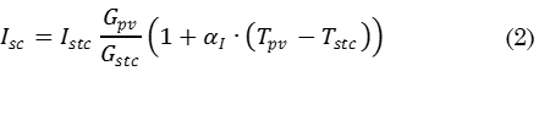
In this way, the relationship between the voltage and current of a PV module is expressed as given in (1). The short-cirtuit current Isc can be calculated using (2) where Istc and Gstc represent the short circuit current and irradiance of the PV modules under standard test conditions (STC) respectively. Tstc and Tpv are the module STC temperature and the actual temperature respectively, both in Kelvin degrees. Finally αI is the current temperature coefficient.
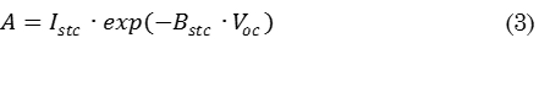
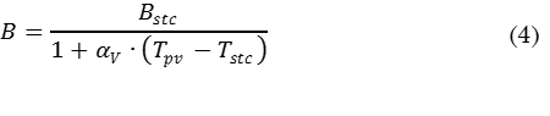
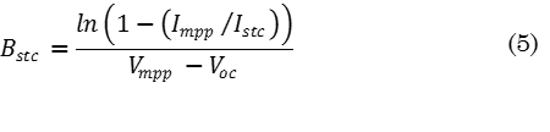
On the other hand A and B are model parameters which can be obtained by means of (3)-(5). These parameters depend on the operating conditions and the information given in the datasheets of the PV modules. In such expressions, Voc represents the open-circuit voltage, and Impp and Vmpp correspond to the PV current and voltage at the maximum power point for the given operating conditions, while αV is the voltage temperature coefficient. In mathematical terms, the condition for the voltages and currents at an inflection point is given by (6) and taking into account the relationship given in (1), (7) is obtained.
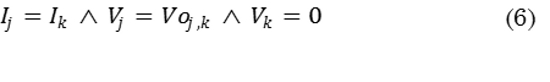
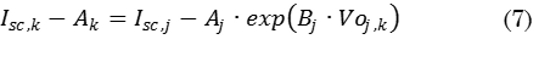
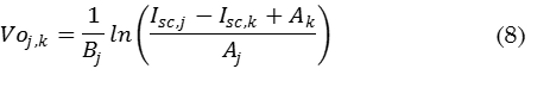
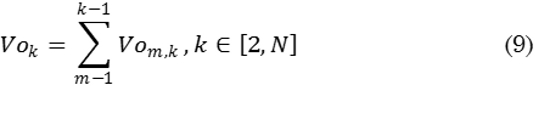
Equation (8) correlates only the behavior of two consecutive j-th and the k-th modules in a string: the currents are the same and equal to the lower short-circuit current, and due to a bypass diode becomes active, the associated module exhibits 0 V. Equation (9) defines the inflection voltages taking into account the entire string considering the modules are organized in descending order of short-circuit current.
In [9] an improvement of this technique was presented by considering a linear model for the bypass diode which increases the accuracy. Also a mathematical procedure is proposed to express one string of the array with only one equation which simplifies the method. However, this approach is only applied to SP arrays.
2.3 Equivalent circuits of PV arrays
Fig. 1d shows the irregular configuration used to illustrate the methodology proposed in this paper. It must be noted that such a PV array does not belong to any typical configuration. Instead, it is formed by three parallel-connected modules at the top, two parallel-connected modules at the center, two parallel-connected modules at the bottom and two series-connected modules at the bottom right. The strategy to simplify the array analysis is to concentrate the parallel-connected modules in a single equivalent block. Fig. 5 illustrates the case for two modules. It is worth to note that both BD1 and BD2 bypass diodes can be accurately represented by a single equivalent bypass diode BD.
In this way, a generalized model of an equivalent block on n parallel-connected modules is given in (10). Then, the three modules at the top row of Fig. 1d were lumped in a single equivalent module modeled by a triple diode model. The two modules at the center and at the bottom were lumped in equivalent modules modeled by double diode models. The bypass diodes connected to each module, in the original array, were replaced by a single bypass diode since the activation of any of them deactivates the other ones.
In this way, taking into account the irregular array under study, the operation of the block formed by three parallel-connected modules is given by (11), while the operation of the two blocks formed by two parallel-connected modules is given by (12) and (13).
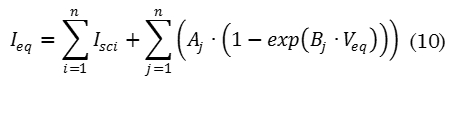
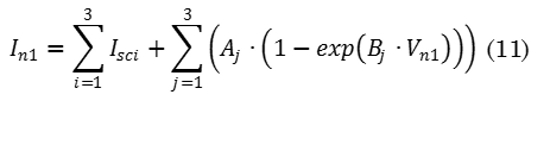
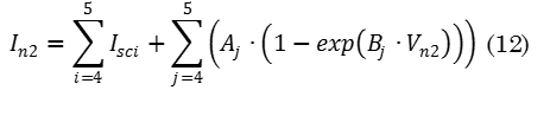

Fig. 6a shows the new configuration after the equivalence process. M1, M2 and M3 were lumped in Mn1, M4 and M5 were lumped in Mn2, M7 and M8 were lumped in Mn3. Modules 6 and 9 remain the same, however they were renamed as Mn4 and Mn5 respectively for nomenclature consistency. This new structure is a variable circuit since multiple equivalent circuits can be obtained depending on the operating conditions. In other words, the topology changes when one or more bypass diodes become active. For example, the equivalent array in Fig. 6a has at least 31 possible circuits depending on the shadow pattern and the operating voltage. Fig. 6b and 6c show two of those possible equivalent circuits.
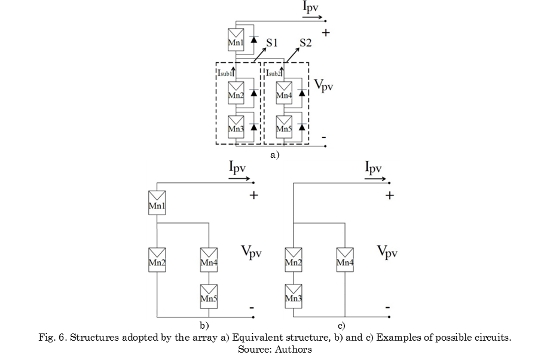
In Fig. 6b the bypass diode of Mn3 becomes active while the other bypass diodes remain inactive. Instead, in Fig. 6c the bypass diodes of Mn1 and Mn5 become active. Moreover, the inactive bypass diodes in both circuits have been removed; hence such circuits can be ana-lyzed using Kirchhoff laws and Schottky equations as proposed in the following section.
3. Modeling procedure and results
Based on the equivalent circuits representation of PV arrays, the following procedure is proposed to model PV arrays under shading conditions: Calculate the operation conditions in which the bypass diodes become active due to the shading pattern affecting the PV array; detect the equivalent circuits existing due to the different status of the bypass diodes; and use the Kirchhoff laws and Schottky equations to obtain the expressions to calculate the PV current and power in each possible equivalent circuit.
Then, to obtain the electrical characteristic of the PV array, i.e. the I-V and P-V curves, it is performed a voltage sweep to the PV array: the electrical equations of the equivalent circuit valid for each voltage value are used to calculate the PV current and power. The following sub-sections describe each one of the previous steps, it illustrating them using the PV array under study, i.e. the one in Fig. 6a.
3.1 Calculation of the inflection points
The values of the short circuits currents associated to each module in the original PV array of Fig. 1d, are Isc = [1 2 4; 4 3 5; 6 6 3], while the values of the short circuits currents associated to each block of the equivalent PV array of Fig. 6a are Iscn = [7; 7 12; 5 3].
Taking into account the new values of the short circuit currents in the equivalent circuit and the concepts related to the inflections points discussed in section 2.2, the following cases are identified: The bypass diode associated to module Mn1 becomes active at some operating point since Iscn1 < Isub1 + Isub2: when Iscn3 = 12 A and Iscn4 = 5 A (maximum case) and when Iscn2 = 7 A and Iscn5 = 3 A (minimum case); the bypass diode associated to module Mn2 becomes active at an operating point since Iscn2 < Iscn3; the bypass diode associated to module Mn5 becomes active at some operation point since Iscn5 <Iscn4.
From such conditions it is concluded that the I-V curve of the PV array under study has three inflection points and the modules Mn3 and Mn4 never become inactive. However, it is important to analyze in which order the bypass diodes become active. It is clear that the maximum current of the PV array is Ia = 17 A which occurs when all the modules voltages are equal to 0 V. When the voltage of the array starts to increase and the current starts to decrease, at least one module of each sub-string must be active. This confirms that modules Mn3 and Mn4 are always active. Module Mn1 will be active if Isub1 + Isub2 < 7 A, which is possible after modules Mn2 and Mn5 become active, since their activation implies that the current flowing through sub-string 1 is at least 7 A and the current flowing through sub-string 2 is at least 3 A, which in turns means that Isub1 + Isub2 is at least 10 A.
Therefore, module Mn1 is the last module becoming active. This leads to analyze which module, Mn2 or Mn5, becomes active first. Moreover, for an operating range, the topology adopted by the PV array will be formed by two modules, one in each sub-string. After the first inflection point the topology adopted by the PV array will be formed by three modules, two modules in one sub-string and one in the remaining one. After the second inflection point, the topology adopted by the PV array will be formed by the four modules of the sub-strings. Finally, after the third inflection point, the topology adopted by the PV array will be formed by the five modules. In this way, it is possible to define the size of the systems to solve for obtaining the I-V curve. By assuming that the current flowing through sub-string 1 is equal to 7 A, which means that module Mn2 is inactive, it is possible to determine if module Mn5 is active or inactive by calculating the current that flows through sub-string 2. Under that assumption, the currents of the array are given by (14) and (15):

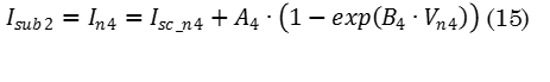
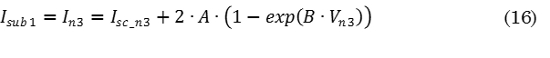
The equations system formed by (14) and (15) can be solved by using a numerical method such as Newton-Raphson or by using functions already available in software packages such as fsolve in Matlab®. In this paper, in sake of simplicity, parameters A and B are considered equal for all the modules. Those parameters are obtained from manufacturer datasheets, in this case A = 7.5992e-7 and B = 0.7220. From (16) Vn3 is calculated, and evaluating such a value in (17), the current flowing through sub-string 2 is calculate to define if module Mn5 is active or inactive.
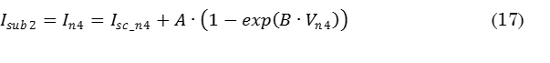
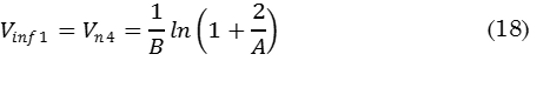
By solving the system, the current flowing through sub-string 2 is 2.5 A which implies that module Mn5 is active since Iscn5 > 2.5 A. This means that module Mn5 becomes active before module Mn2. To confirm such a conclusion, the current through sub-string 1 is calculated when the current through sub-string 2 is equal to 3 A. By solving that system, the current obtained is 8 A which confirms that Mn2 is inactive since Iscn2 < 8 A. Therefore, at that operating point the array adopts the topology shown in Fig. 7a. Then, the first inflection point occurs when Isub2 = 3 A, and from (17), the inflection voltage is given by (18).
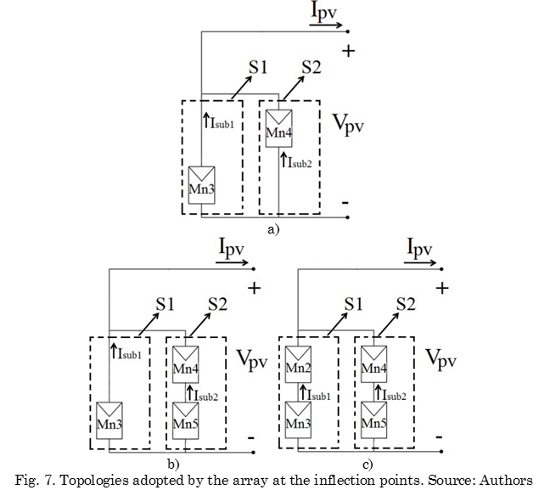
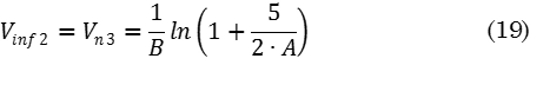
Moreover, the inflection point can be described in terms of a couple (V, I), in this case the first inflection point is (20.4753 V, 11 A). The second inflection point is related to the activation of the bypass diode associated to the module Mn2. Therefore, the topology adopted by the array is the one shown in Fig. 7b. The second inflection point occurs when Isub1 = 7 A, and from (17), the associated inflection voltage is given by (19). If the modules have different parameters a formulation similar as in (14) and (15) can be used for solving the inflection voltage.
The inflection point coordinates (V, I) are obtained by solving the system formed by (20) and (21) to calculate the current value through sub-string 2. In this case, the second inflection point is (20.7844 V, 10 A).
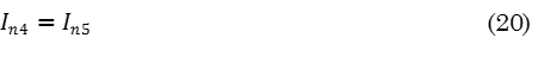
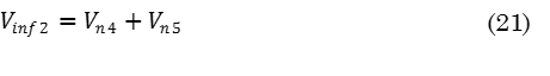
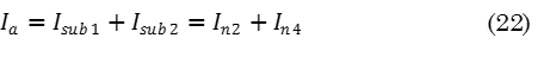
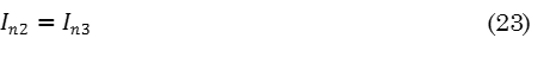
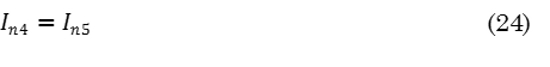
Fig. 7c shows the topology adopted by the PV array that must be analyzed to calculate the third infection point. This calculation requires the formulation and solution of an equation system given by the following operating conditions: the current of the array is the same as in module Mn1, which in turns is equal to its short-circuit current Iscn1. That current corresponds to the addition of the currents of sub-strings 1 and 2, which can be represented as the addition of the current of modules Mn2 and Mn4 as is given in (22). Taking into account the series connection in each sub-string, equations (23) and (24) are defined. To complete the system, equation (25) relates the voltages of the modules. Then, the voltages calculated are: Vn2=19.46 V, Vn3=21.23 V, Vn4=21.07 V, Vn5=19.62 V.
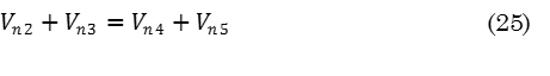
The inflection voltage is calculated by adding the modules voltages Vn2+Vn3 and Vn4+Vn5. In this way, the third inflection point is (40.69 V, 7 A).
3.2 Detection of the equivalent circuits and PV curves calculation
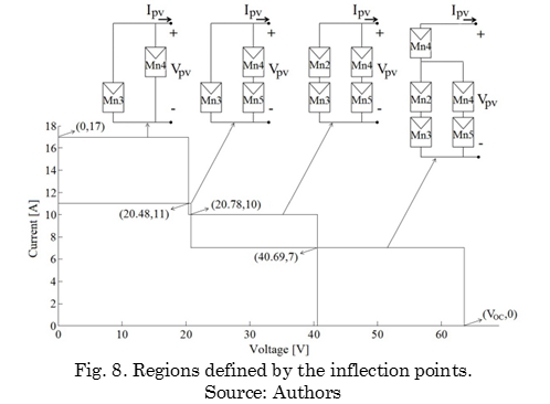
Based on the three inflection points, the four regions described in Fig. 8 are defined, each one of them corresponding to a particular equivalent circuit adopted by the array due to the activation of the associated bypass diodes.
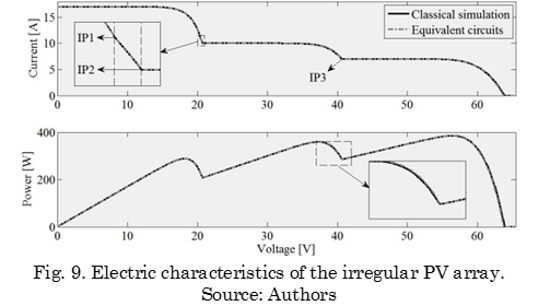
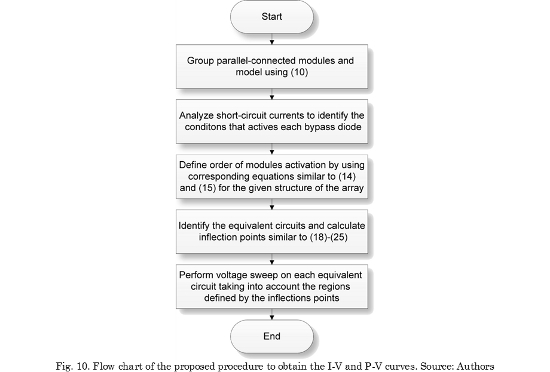
In this way, by performing a voltage sweep in each equivalent circuit within the corresponding voltage range, the I-V and P-V curves are obtained. Fig. 9 shows the satisfactory agreement between the curves obtained with the proposed method and using Simulink®, which is a well-known classical simulator. However, due to the reduced number of calculations, the new approach requires only 18% of the simulation time used by the classical solution and with a relative mean error in the predicted power of 3.094%. The flowchart in Fig. 10 summarizes the I-V and P-V curves calculation procedure.
It must be noted that using the ideal diode model for the bypass diode instead of the non-linear Schottky model does not introduce significant errors. In [11] an analysis of the error by using a linear approach for the bypass diode instead of using the Schottky model is presented, which shows that, for example, in a PV string of 6 modules the error is only 0.12%. In this paper, the bypass diode has been modeled as an ideal switch, whose error in comparison to the linear case is 0.2*M/[(N-M)*V-0.2*M] for a string of N modules with M active bypass diodes (inactive modules), considering a typical bypass diode voltage of 0.2 V and the same operating conditions for the (N-M) active modules. In the case of a string of 6 modules with M = 3 and the active modules operating on the MPP conditions, e.g. with V = 18 V (BP585), the error is only 1.12%, which is a low error considering the strong reduction in the complexity and calculation time.
3.3 Dynamic simulation
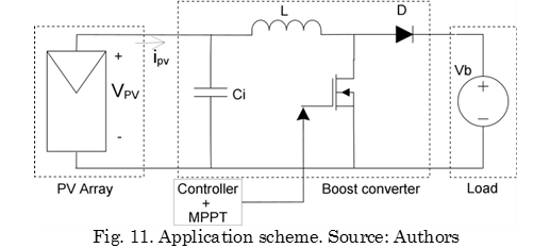
One common application of PV models is the evaluation of MPPT (Maximum Power Points Tracking) algorithms under partial shading conditions. Therefore, in order to confirm the usefulness of the proposed approach, the model was used to evaluate a classical MPPT algorithm using dynamic simulations. The example considers a photovoltaic battery charger, implemented in Matlab®, and formed by: an irregular PV array (the same one previously analyzed), a boost converter, the load (battery) modeled as a voltage source. The MPPT algorithm under test is the P&O (Perturb and Observe) approach, which is the most widely adopted MPPT technique for PV systems. Fig. 11 presents the application scheme. The proposed model based on equivalent circuits was implemented in Matlab® code.
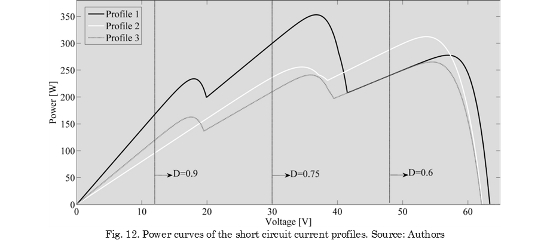
The PV system is considered exposed to three different shading patterns represented by three short-circuit current profiles: IscP1 = [5 5 4; 4 4 2; 2 1 1], IscP2 = [5 2 1; 4 1 3; 2 2 2] and IscP3 = [3 2 2; 4 2 2; 1 2 4]. Fig. 12 shows the power curves of the PV array under each shading profile. The dynamic simulation starts with the PV array subjected to Profile 1, then at t = 25 ms the shades change to Profile 2, and at t = 50 ms the shades change to Profile 3.
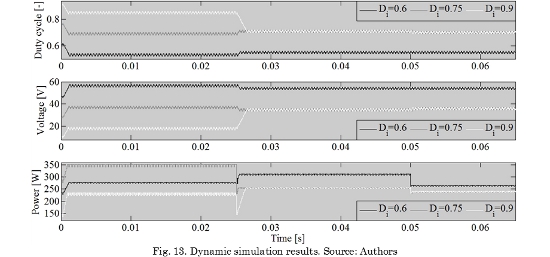
To evaluate the P&O reliability three simulations were performed. The first simulation consider an initial duty cycle Di = 0.6 (Vpv = 48 V), where the P&O algorithm tracks a local maximum of Profile 1 (277.8 W), however when the profile changes at t = 25 ms, the maximum power point (MPP) of Profile 2 (312.3 W) is successfully tracked. When the profile changes again, at t = 50 ms, the P&O algorithm successfully tracks the MPP of Profile 3 (265.1 W). The second simulation considers Di = 0.75 (Vpv = 30 V), in this case the P&O algorithm successfully tracks the MPP of Profile 1 (353 W). However, when the profile changes to Profile 2, the P&O algorithm tracks a local maximum (255.8 W), and when the profile changes to Profile 3 the P&O algorithm tracks a local maximum again (241 W). Finally the third simulation was made with Di = 0.9 (Vpv = 12 V), where again the P&O tracks local maximum for the three profiles. Fig. 13 shows the simulation results. This example illustrates the usefulness of the proposed model in testing MPPT algorithms: the simulation results show that the classical P&O algorithm is not reliable under mismatching conditions. Such a conclusion is in agreement with the results given in [10].
4. Conclusions
The analysis presented in this paper demonstrate that it is possible to represent any PV array, under both uniform and mismatched conditions, using equivalent circuits to simplify the array analysis and simulation. The operation range of each equivalent circuit is defined by the inflection points, which are calculated from the analysis of the short circuit currents. Therefore, the proposed modeling technique enables to define a reduced set of electrical equations for each operation interval, it requiring few calculations to obtain the I-V and P-V curves.
In contrasts, classical models require to include the bypass diode non-linear and switched behavior into the system equations as reported in [8], hence it demanding a much larger simulation time. The example introduced in section 3 demonstrates that the proposed solution achieves a small error of 3.094% with a large reduction in the simulation time of 18% in comparison with a classical solution.
5. Acknowledgements
This paper was supported by the Universidad Nacional de Colombia under the projects RECONF-PV-25633 and MICRORED-18687. This work was also supported by COLCIENCIAS under the doctoral scholarships 34065242 and 095-2005.
References
[1] M. S. S. Ashhab, H. Kaylani, and A. Abdallah, “PV solar system feasibility study,” Energy Convers. Manag., vol. 65, pp. 777-782, Jan. 2013. [ Links ]
[2] D. Jacobs, N. Marzolf, J. R. Paredes, W. Rickerson, H. Flynn, C. Becker-Birck, and M. Solano-Peralta, “Analysis of renewable energy incentives in the Latin America and Caribbean region: The feed-in tariff case,” Energy Policy, vol. 60, no. 5, pp. 601-610, Sep. 2013. [ Links ]
[3] A. Orioli and A. Di Gangi, “Review of the energy and economic parameters involved in the effectiveness of grid-connected PV systems installed in multi-storey buildings,” Appl. Energy, vol. 113, pp. 955-969, Jan. 2014. [ Links ]
[4] IPSE, “Nueva Ley 1715 de 2014 promueve el aprovechamiento de las fuentes no convencionales de energia.” 2014. [ Links ]
[5] H. Patel and V. Agarwal, “MATLAB-Based Modeling to Study the Effects of Partial Shading on PV Array Characteristics,” IEEE Trans. Energy Convers., vol. 23, no. 1, pp. 302-310, Mar. 2008. [ Links ]
[6] G. Petrone and C. A. Ramos-Paja, “Modeling of photovoltaic fields in mismatched conditions for energy yield evaluations,” Electr. Power Syst. Res., vol. 81, no. 4, pp. 1003-1013, Apr. 2011. [ Links ]
[7] R. Ramaprabha and B. L. Mathur, “A Comprehensive Review and Analysis of Solar Photovoltaic Array Configurations under Partial Shaded Conditions,” Int. J. Photoenergy, vol. 2012, no. 0, pp. 1-16, 2012. [ Links ]
[8] G. Petrone, G. Spagnuolo, and M. Vitelli, “Analytical model of mismatched photovoltaic fields by means of Lambert W-function,” Sol. Energy Mater. Sol. Cells, vol. 91, no. 18, pp. 1652-1657, Nov. 2007. [ Links ]
[9] J. D. Bastidas, E. Franco, G. Petrone, C. A. Ramos-Paja, and G. Spagnuolo, “A model of photovoltaic fields in mismatching conditions featuring an improved calculation speed,” Electr. Power Syst. Res., vol. 96, pp. 81-90, Mar. 2013. [ Links ]
[10] Y.-J. Wang and P.-C. Hsu, “An investigation on partial shading of PV modules with different connection configurations of PV cells,” Energy, vol. 36, no. 5, pp. 3069-3078, May 2011. [ Links ]
[11] C. A. Ramos-Paja, A. Trejos-Grisales, and B. J. Restrepo_Cuestas, “Energy prediction in urban photovoltaic systems,” Tecnologicas, pp. 81-93, 2013. [ Links ]
