


Servicios Personalizados
Revista
Articulo
 Inglés (pdf)
 Articulo en XML
 Referencias del artículo
 Enviar articulo por email
Indicadores
-
 Citado por SciELO
 -
 Accesos
Links relacionados
-
 Citado por Google
 -
 Similares en
SciELO
Similares en
SciELO -
 Similares en Google
Compartir

 Permalink
TecnoLógicas
versión impresa ISSN 0123-7799versión On-line ISSN 2256-5337
TecnoL. vol.20 no.39 Medellín mayo/ago. 2017
Artículo de investigación/Research article
Visual in-plane positioning of a Labeled target with subpixel Resolution: basics and application
Posicionamiento visual con resolución subpixel de objetos marcados que se desplazan en un plano: conceptos básicos y aplicaciones
Patrick Sandoz1, July A. Galeano2, Artur Zarzycki3, Deivid Botina4, Fabián Cortés-Mancera5, Andrés Cardona6, and Laurent Robert7
1 PhD en Ciencias para la Ingeniería, Chargé de Recherche C.N.R.S., Department of Applied Mechanics, FEMTO-ST Institute, University Bourgogne Franche-Comté, CNRS/UFC/ENSMM/UTBM, Besancon-Francia, psandoz@univ-fcomte.fr
2 PhD en Ciencias para la Ingeniería, Ingeniería de Sistemas, Grupo de Investigación en Materiales Avanzados y Energía MatyEr, Línea Biomateriales y Electromedicina, Facultad de Ingenierías, Instituto Tecnológico Metropolitano, Medellín-Colombia, julygaleano@itm.edu.co
3 PhD en Microtecnología, Ingeniería Electromecánica, Grupo de Investigación en Automática, Electrónica y Ciencias Computacionales, Línea Sistemas de Control y Robótica, Facultad de Ingenierías, Instituto Tecnológico Metropolitano, Medellín-Colombia, arturzarzycki@itm.edu.co
4 Technologist in Electronic, Electronic Engineering Student, Ingeniería Electrónica, Grupo de Investigación en Materiales Avanzados y Energía MatyEr, Línea Biomateriales y Electromedicina, Facultad de Ingenierías, Instituto Tecnológico Metropolitano, Medellín-Colombia, deivid.johan.botina.monsalve@hotmail.com
5 MSc en Ciencias Básicas Biomédicas, Grupo de Investigación e Innovación Biomédica - GIB, Laboratorio de Ciencias Biomédicas, Facultad de Ciencias Exactas y Aplicadas, Instituto Tecnológico Metropolitano, Medellín-Colombia, fabiancortes@itm.edu.co
6 Ing. Biomédico, Master Student, Grupo de Investigación e Innovación Biomédica - GIB, Laboratorio de Ciencias Biomédicas, Facultad de Ciencias Exactas y Aplicadas, Instituto Tecnológico Metropolitano, Medellín-Colombia, andresce68@gmail.com
7 PhD Ingénieur de Recherche, FEMTO-ST Institute, University Bourgogne Franche-Comté, CNRS/UFC/ENSMM/UTBM, Besancon-Francia, lrobert@femto-st.fr
Fecha de recepción: 24 de marzo de 2017/ Fecha de aceptación: 03 de mayo de 2017
Como citar / How to cite
P. Sandoz, J. A. Galeano, A. Zarzycki, D. Botina, F. Cortés-Mancera, A. Cardona and L. Robert, “Visual in-plane positioning of a labeled target with subpixel resolution: basics and application”, TecnoLógicas, vol. 20, no. 39, 2017.
Abstract
Vision is a convenient tool for position measurements. In this paper, we present several applications in which a reference pattern can be defined on the target for a priori knowledge of image features and further optimization by software. Selecting pseudo-periodic patterns leads to high resolution in absolute phase measurements. This method is adapted to position encoding of live cell culture boxes. Our goal is to capture each biological image along with its absolute highly accurate position regarding the culture box itself. Thus, it becomes straightforward to find again an already observed region of interest when a culture box is brought back to the microscope stage from the cell incubator where it was temporarily placed for cell culture. In order to evaluate the performance of this method, we tested it during a wound healing assay of human liver tumor-derived cells. In this case, the procedure enabled more accurate measurements of the wound healing rate than the usual method. It was also applied to the characterization of the in-plane vibration amplitude from a tapered probe of a shear force microscope. The amplitude was interpolated by a quartz tuning fork with an attached pseudo-periodic pattern. Nanometer vibration amplitude resolution is achieved by processing the pattern images. Such pictures were recorded by using a common 20x magnification lens.
Keywords Fourier transform phase processing, visual in-plane position measurement, vibration amplitude, shear force microscopy, position referenced microscopy.
Resumen
La visión es una herramienta conveniente para mediciones de posición. En este artículo, presentamos aplicaciones en las que un patrón de referencia puede ser adherido al objeto de interés. Ésto permite tener un conocimiento a priori de las características de la imagen y así poder optimizar el software. Como patrón de referencia se usan patrones pseudo-periódicos, los cuales permiten una alta resolución en las mediciones de fase absoluta. El método es adaptado para codificar la posición de soportes de cultivos celulares, con el fin de documentar cada imagen biológica registrada con su posición absoluta. Por lo tanto, resulta sencillo encontrar de nuevo una región de interés, observada previamente, cuando una caja de cultivo es traída de nuevo al microscopio luego de estar en una incubadora. Para evaluar el método, éste se utilizó durante un ensayo de “cicatrización de herida” de un cultivo celular derivado de tumores hepáticos. En este caso, el método permite obtener mediciones más precisas de la tasa de “cicatrización”, comparado a los resultados obtenidos con el método usual. El método propuesto también se aplica a la caracterización de la amplitud de vibración en el plano de una sonda de un microscopio de fuerza atómica. La amplitud fue interpolada por medio de un diapasón de cuarzo al cual se la adhirió un patrón pseudo-periódico. A partir del procesamiento de las imágenes del patrón, se logra obtener resolución nanométrica en la medida de la amplitud de la vibración. Estas imágenes fueron obtenidas con un microscopio óptico con magnificación 20x.
Palabras clave: procesamiento en fase con transformada de Fourier, medidas de posición en el plano por visión, amplitud de vibración, microscopio de fuerza atómica, microscopía referenciada en posición.
1. Introduction
Vision is a powerful tool for non-invasive control. They are widely used in several fields of application. From the optical point of view, vision is limited by the diffraction of light that determines the smallest details that are optically resolved in the far field. From the digital point of view, image definition is limited by the pixel size that results from image sampling and analog-to-digital conversion. Depending on the optical magnification, pixel size may be more restrictive than diffraction regarding image definition limits. Thus, the pixel size becomes the most limitative parameter to the eventual resolution. Furthermore, in some applications, it is possible to achieve object localization with an accuracy far beyond the image resolution set by the diffraction. For instance, Betzig et al. demonstrated nanometer resolution in intracellular fluorescent protein imaging. They used a digital centering of the point spread function (PSF) formed by each individual fluorescent center [1]. In their application, the ability to overcome the pixel definition of images and to achieve subpixel PSF localization drastically improved the final imaging resolution. In the case of microfabrication, precision machines, or precision robots, sub-pixel localization methods enable a highly accurate micrometer placement of elements. Some applications of this principle can be found in areas such as medicine, and micro/nano electronics fabrication [2]–[4].
Local and global approaches can be identified among reported methods regarding image processing for subpixel position or motion measurement. In the local approaches, motion is estimated from a restricted area of the image that was selected because of its convenience (i.e. usually presenting a highly contrasted edge). Then, different kinds of gradient calculations performed on the image intensity levels may enable the evaluation of motion amplitudes [5]–[7]. Among global methods, image correlation is probably the most widely known. However, the achievement of subpixel resolutions requires interpolation or specific data manipulation [8]. Another global approach is based on the comparison of the spectral phases obtained by Fourier transform. Such phases contain displacement information with 2Π ambiguities [9]. Although the latter approach is less popular than the correlation techniques, it can achieve motion resolutions of the order of 10-²; pixel.
All these approaches share one advantage and one drawback. The advantage is that they are based on the features of natural objects, so they work without the requirement of specific target preparations that might be impossible in many practical contexts. Because of this characteristic, the resolution achieved is object-dependent; higher image contrast usually results in better resolutions. The drawback is that these methods are unable to render inplane object rotations; except when they are small and progressive, and by following gradient methods. These approaches fail when the image rotation is significant. They also assume that object displacements can only be approximated to in-plane translations.
One of the applications of object localization is Region of Interest (ROI) Recovery methods for analysis of cellular events. In this regard, different approaches have been proposed. Most of them are alphanumeric patterns that, once embedded in Petri dishes or microscope slides, offer a visual representation of ROI positioning in microscopy [10]–[14]. Those types of patterning are nowadays commercialized because they do not require a software for ROI analysis and their simplicity. The resulting performances are poor and this constitutes a major limiting factor for highly accurate analysis at microscale.
The technique we present in this work is complementary to the above mentioned well-known methods. Our approach requires object preparation since it is based on the analysis of a known reference pattern fixed on the target. Therefore, the advantage of some of the previous methods is lost. However, our approach is fully compatible with in-plane object rotations, thus discarding the translation assumption and allowing any in-plane object motion. The resolutions we achieved are in the range of 10-² pixel for displacement and 10-³ degree for rotation.
In this paper, we present two applications of subpixel image processing for high resolution in-plane position measurements that respond to modern needs of characterization. The first one deals with optical microscopy of biological samples and, more specifically, with position referencing of cell culture boxes. Our purpose is to easily localize any previously observed region of interest, when a culture is back under the microscope and thus sharply register cell modifications (occurred during culture time or after any type of treatment). Our second application considers in-plane vibrations at sub-micrometer amplitude as encountered in the field of mi-croelectro-mechanical systems (MEMS). The dynamical behavior of new technological devices and actuators must consider that field [15]. Our test object was a quartz tuning fork used as dithering support for sharp tip probes in surface scanning microscopy. The results and resolution achieved in both situations demonstrate the high capabilities of this approach. It can be used in applications in which it is almost acceptable to stick or drill a pattern onto the target to be localized.
2. Materials and methods
2.1 Basics on position measurement with sub-pixel resolution by using pseudo-periodic pat-terns
The principle underlying the method proposed in this work is presented in Fig. 1. The pattern fixed on the target is made of a pseudo-periodic distribution of dots (Fig.1a). In this encryp-tion process the periodic frame is dedicated to high resolution, but relative, position identification. Likewise, the distribution of missing dots provides complementary coarse, but absolute, position measurement by the identification of the observed local area. The high resolution we achieved is based on Fourier processing and phase computations as represented in Fig. 1 Besides, (Fig.1b) shows the modulus of the Fourier spectrum of Fig.1a plotted with a loga-rithmic scale after DC term removal.
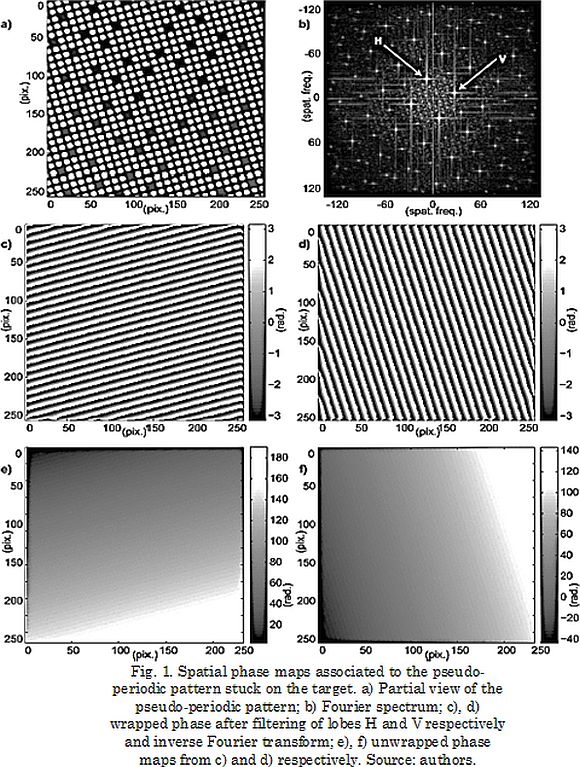
This spectrum is composed of several lobes associated with the spatial frequencies of the selected pseudo-periodic pattern. Our process involves the parallel processing of two spectral lobes marked by an arrow. They represent perpendicular directions on the object. The Fouri-er spectrum is filtered twice (H and V respectively in Fig.1b) with a bandpass filter centered on a single lobe. This Fourier treatment is similar to the one introduced by Takeda for 3D profiling by fringe projection [16]. After inverse Fourier transform of each lobe, we obtained a complex single direction image. The wrapped phase of the latter is shown in Fig.1c and Fig.1d for lobes H and V, respectively. The visible phase represents a single spatial frequen-cy and it can be associated with displacements following the relations below:
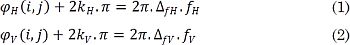
where φH (i,j) and φV (i,j) are the wrapped phase obtained, ΔfH and ΔfV are the target displacements following the perpendicular directions defined by the spatial frequencies fH and fV respectively. kH and kV are unknown integers introducing displacement ambiguities due to the (-Π, Π) definition interval of the phase.
These wrapped phase maps are thus representative of the fine but relative position of the target with respect to the image sensor. At this stage, phase unwrapping is convenient for further position determinations. The resulting unwrapped phase maps are presented in Fig.1e and Fig.1f. The latter can be approximated by mean square planes, as defined by the rela-tions below. They are representative of the relative position of the target with respect to the image sensor pixel frame:
where ØH (i,j) and ØV (i,j) are the unwrapped phases obtained, AH, BH, AV and BV define the mean square planes and are representative of both the in-plane target orientation and the fine target position. CH and CV are 2kΠ constants necessary to obtain the final unambiguous position of the target. This required coarse position identification is based on missing dot distribution analysis as explained elsewhere [17].
Thanks to this method using a pseudo-periodic pattern stuck on the target, we can measure simultaneously the in-plane position and orientation with a high resolution. In practice, the latter depends on the signal to noise ratio in the recorded target images. Two applications based on this measurement principle are described in the following.
2.2 Position referenced microscopy
Regarding the biological application, our aim is to propose a practical tool for referencing the cells positions during culture in Petri dishes by using optical microscopy. When adherent cells are cultured, they first develop junctions that fix them to the substrate, a prerequisite for survival and proliferation. For this application, first we identify the cells positions in the culture box. Second, when we focus again on the same regions of the culture box, we are able to find the same cells and their original position. The observed modifications will therefore be due to actual biological activity. This way, we benefit from the small depth of focus of microscope objectives, because we add a position-encoding pseudo-periodic pattern to the depth of the culture box. This principle is illustrated in Fig. 2: specific culture boxes equipped with such semi-transparent pattern. In Fig.2a, the microscope is focused on the cell culture and a regular biological image is captured, as presented in Fig.2b. Once a region of interest is located and its image recorded, the focus is shifted vertically onto the pseudo-periodic pattern, as detailed in Fig.2c. The image recorded at this depth (Fig.2d) enables the computation of the coordinates (x and y) of the region of interest and its position data are stored. This shift of focus depth only affects the vertical axis. As a result, the lateral coordinates obtained from the pseudo-periodic pattern image are also valid for the biological image. If the cell culture comes back under the microscope after some time in the cell incubator, it is then easy to find the position of this region of interest by means of the pseudo-periodic pattern [17].

2.3 In-Plane Vibration Amplitude Measurement
With the recent development of micro and nanotechnologies, there is a strong need for instrumentation adapted to the characteristics of the new devices that are manufactured [15]. It is generally accepted that such devices are difficult to be numerically simulated (compared to well-known dimensional and physical parameters) because of the importance of unpredictable technical issues; i.e. shape imperfections, residual stresses, and thin layer properties. The experimental characterization of devices is thus particularly important in this context. Our method for subpixel measurement of in-plane displacements was found to be suitable for this field. We also demonstrated its capability to deal with in-plane vibration amplitudes by using the stroboscopic illumination detailed in the results section. The object under study was a surface scanning microscope probe. The latter was composed of a tuning fork supporting a sharp tip aimed to be maintained a few nanometers away from the inspected surface. The tuning fork is widely used as a tip holder because of the simplicity of its electrical dithering, which produces vibrations between the two prongs. Monitoring the vibration amplitude is a common way to control the tip-surface distance. This is because when the tip approaches the surface a shear force damping is observed. In practice, a tungsten or optical fiber tip is attached to one prong. The reduction in the vibration amplitude is a measure of the tip-surface distance. In consequence, the surface scanning probe can be servo-controlled to only a few nanometers from the inspected objects surface during lateral scanning.
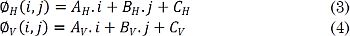
Fig. 3 is an image of the tuning fork we used, as observed with a scanning electron microscope. Small pieces of patterned glass coverslips are fixed on the ends of the tuning fork prongs. A pseudo-periodic pattern was previously drilled on the thin aluminum layer deposited on the surface of these additional glass parts, as shown in the inset of Fig. 3. When measuring the vibration, the overall displacement of the object is known to remain limited. Therefore, an extended pseudo-periodic pattern is not necessary. Instead, we used a simple square pattern of dots, as represented in the inset of Fig. 3. The front face images of the square pattern of dots acquired by microscope (20x magnification) were processed using Fourier methods similar to those described above. We then obtained phase equations resembling Equations (3) and (4). They required the identification of unknown phase constants CH and CV. In this case, the vibration amplitude is known to remain small, i.e. much smaller than the 4x|m pattern period. Therefore, a binary encoding of the pattern is unnecessary because the maximum phase change remains under Π. The coarse positioning that we adopted produces an image correlation sufficient to localize the square dot pattern as well as the coarse position of its central dot. This knowledge is used to keep the unknown constants CH and CV unchanged and thus avoid spurious 2Π phase shifts [18]. These constants can therefore be ignored. Additionally, the phase changes provided by Equations (3) and (4) are fully representative of the displacement of the surface of the tuning fork prongs, with the conversion law: 2Π corresponds to one period, 4µm in our case. As a result, we are able to accurately follow the position of the central dot of the pattern on the image of the prong end face with a similar resolution: a few nanometers.
3. Results and discussion
3.1 Position referenced microscopy
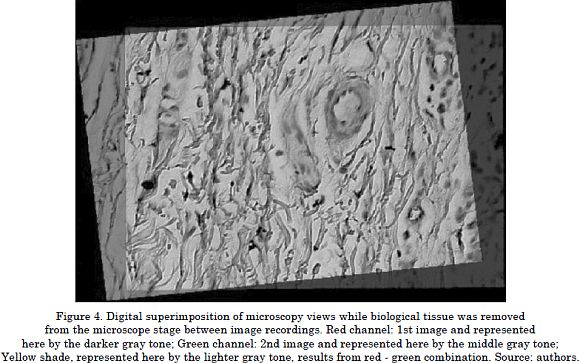
Fig. 4 demonstrates the potential of this method. The figure presents two images of the same tissue area observed at different fractions of time when the biological tissue was removed from the microscope stage between successive observations. The position of interest observed at first was found thanks to the position-encoding pseudo-periodic pattern. The two recorded images are color-coded in red and green (represented here by the darker and mid-dle gray tone respectively). It can be seen that they do not exactly correspond to the same field of observation in terms of both position and orientation. Despite these mismatches, the position and orientation data from each image enables the digital superimposition. Afterwards, they are displayed in a common reference system. The yellow shade (represented here by the lighter gray tone) results from the combination of red and green, and it deter-mines the common area in the image. During this demonstration experiment, the biological tissue was not cultured and remained unchanged between image recordings. The high quality observed in the yellow shade (represented here by the lighter gray tone) results from sharp image matching obtained thanks to the high resolution achieved in position determination. The accuracy in image superimposition (obtained from the phase shift) was estimated to be better than one tenth of the microscopes objective resolution. This is due to the prior knowledge of the periodicity of the Pseudo-Periodic-Patterns: 4µm. This specific result can be compared to the microscope objectives resolution, which is estimated by the diffraction limit rule (λ/(2 N.A), where λ is the imaging wavelength and N.A, the Numerical Aperture of the objective.
Cell culture boxes, including this new technology, have been used by biologists for researching DNA material transfers after cell death in the context of cervical cancer [19]. Also, the above described technology is used for quantifying the proliferation of human liver tumor-derived cells by means of wound healing assays. Indeed, the sharp image superimposition obtained with the method enhances the accuracy of proliferation measurements. The latter are evaluated in terms of the total wound area over the total image area. This factor is called Wound Rate Ratio (%WR) and it is calculated by means of image segmentation techniques such as those presented by [20].
Fig. 5 presents the %WR from a wound healing assay. The images were superimposed by using the proposed technique. A culture of HPK (Human Primary Keratinocytes) cells was incubated. Then, a ROI of the cell culture was selected and observed twice: at 0 hours, when the cell culture had just been scratched with the tip of a 100µl pipette (to produce a "wound") and the ROI of interest was selected, and 24 hours later when the induced wound was in its last phase of healing or closing. The recovery of the same ROI during the second observation was manually performed as previously published by [20]. They suggest to place a manu-al mark on the top of the culture flask in order to visually recognize a desired ROI.
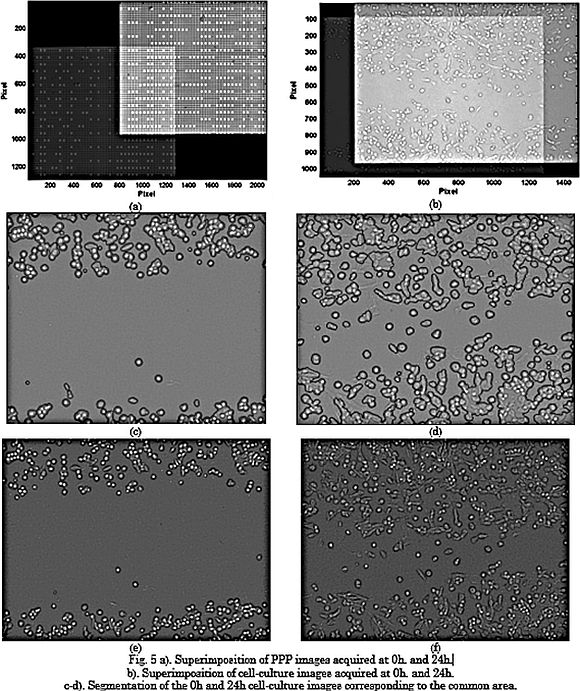
During these two observations, not only an image of the cell-culture was captured, but also one of the embedded PPP. The processing of the PPP images allowed to evaluate the accuracy during manual ROI recovery. Fig. 5a. shows the results of the experiment. It is possible to observe errors of 190.93 µm and 78.45 µm in x and y, respectively.
The absolute highly accurate positioning from the PPP enables to place the cell-culture images within a common frame (Fig. 5b). Thus, only the common area (lighter gray tone) between the images (Fig. 5c-d) is analyzed to calculate the percentage of open area or wound rate. It can be observed that the difference in wound rate is 0.58% in the image acquired at the onset (0h), and 4.91% in the images captured 24 hours later, compared to the full images without any adjustment (Fig. 5e-f). These results show that a manual ROI recovery can lead to misinterpretations during the wound healing assay. In fact, this assay is widely used by biologists to evaluate the performance of new drugs. Low-accuracy in ROI recovery can lead to over- or under- estimations of the drug in the study. Therefore, PPP can be a potential tool for accurate analysis in the pharmaceutical field.
3.2 In-plane vibration amplitude measurement
The prongs end surface (of the tuning fork) is observed in reflection with a 20× magnification objective under a microscope. The latter is equipped with stroboscopic illumination to shift the vibration frequency within the camera bandwidth [18], [21]. The 25fr/s bandpass, ena-bled by the 2D image sensor we used, is clearly insufficient to track vibrations at frequencies close to 200 kHz. Stroboscopic illumination is therefore used to shift the apparent frequency toward 0Hz. However, instead of freezing the image by illuminating the square dot pattern exactly at the prong excitation frequency, we introduced an apparent low-frequency apparent movement by using a 2Hz shift between the stroboscopic illumination and the tuning fork dithering frequency. Fig. 6 proves that this frequency shift of 2Hz results in an apparent frequency of 2Hz despite the tuning fork dithering frequency of 195410Hz (in this case). As a result, the harmonic vibrations are observed to have an apparent frequency of 2Hz, which is compatible with the 25fr/s detection camera. The amplitude of vibration can be estimated to be about 15nm. This value corresponds to 2.5 10-² image pixel. Even with these low vibration amplitudes, an excellent signal-to-noise ratio was obtained with a standard 8-bit definition CCD camera for image capture.
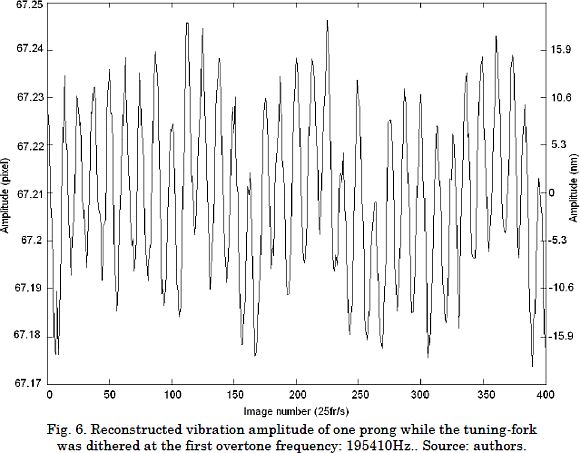
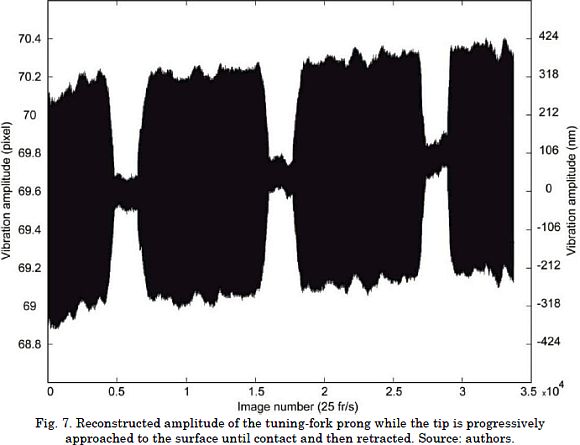
Fig. 7 presents the evolution of the vibration amplitude while the tip stuck on one prong was progressively approached from the object surface and then retracted during three cycles. In this case, the tuning fork was dithered at its fundamental frequency of about 33kHz. In the figure, we clearly see the vibration damping due to tip-surface vicinity and then contact. Some vibration is still observed during tip-surface contact since we do not measure the vibration exactly at the tip end but only on the prong end face, a few tens of micrometers apart. The tip elasticity allows tip deformations that absorb a part of the excitation energy and thus reduce the quality factor of the tuning fork. It would be better to address the tip end amplitude but such measurements are excessively difficult to perform compared to the simple vision system involved is our approach. Furthermore, except in case of tip-surface contact; i.e. in normal scanning microscopy conditions, the prong amplitude is an excellent estimate of the tip end amplitude [21]. This method was found to be able to follow the vibration amplitude during surface scanning [21] by using post-processing. Vibration amplitude measurement at video rate are not accessible at the moment but could be achieved by using more efficient image processing software. In the one hand, using C++ routines would speed up the computation and thus allow the processing of the 25fr/s image flow to obtain real time vibration amplitude measurement. On the other hand, by replacing the 2D image sensor by a 1D image sensor with a frame rate larger than 70kHz would allow to avoid stroboscopic illumination to achieve real-time measurement along the vibration direction of interest.
4. Conclusion
As demonstrated in this paper, position and displacement measurements by vision can benefit from a pseudo-periodic pattern stuck on the target in applications in which such a sample preparation is possible. Several advantages can be found in this technique. Firstly, in-plane position and orientation can be addressed simultaneously and unambiguously contrarily to most of known methods based on natural object features. Secondly, the method includes two levels of noise reduction; i.e. a narrow bandwidth spectral filtering and a least square approx-imation of the unwrapped phase maps. Thus a large part of the detection noise is filtered out and high resolutions are achieved while no scientific grade image sensor is used as detector. Thirdly position measurements performed by the method are absolute. Therefore, the object is not required to remain within the field of observation during the whole measurement time. As in the biological application, the method is suited to localize a zone on a target observed previously and that was removed from the observation scene. Two actual applications are summarized in the paper. They illustrate the powerful capabilities of the method to answer modern metrology problems by providing high resolution measurements of in-plane position and orientation. The proposed principle might also be found to be suited to answer other kinds of measurement needs.
5. Acknowledgments
The authors would like to acknowledge the financial support given by Instituto Tecnológico Metropolitano (Medellín-Colombia), and by Institute FEMTO-ST (Besancon- France), under the project number P15201. Also, we acknowledge the RENATECH network and its FEMTO-ST technological facility MIMENTO.
References
[1] E. Betzig, G. H. Patterson, R. Sougrat, O. W. Lindwasser, S. Olenych, J. S. Bonifacino, M. W. Davidson, J. Lippincott-Schwartz, and H. F. Hess, “Imaging Intracellular Fluorescent Proteins at Nanometer Resolution,” Science (80), vol. 313, no. 5793, pp. 1642-1645, Sep. 2006. [ Links ]
[2] B. Tamadazte, N. L.-F. Piat, and S. Dembe´le´, “Robotic Micromanipulation and Microassembly Using Monoview and Multiscale Visual Servoing,” IEEE/ASME Trans. Mechatronics, vol. 16, no. 2, pp. 277-287, Apr. 2011. [ Links ]
[3] B. Tamadazte, S. Dembélé, G. Fortier, and N. Le Fort-Piat, “Automatic micromanipulation using multiscale visual servoing,” in 4th IEEE Conference on Automation Science and Engineering, 2008, pp. 977-982. [ Links ]
[4] V. Guelpa, G. J. Laurent, B. Tamadazte, P. Sandoz, N. Le Fort-Piat, and C. Clevy, “Single frequency-based visual servoing for microrobotics applications,” in 2016 IEEE/RSJ International Conference on Intelligent Robots and Systems (IROS), 2016, pp. 4274-4279. [ Links ]
[5] C. Q. Davis and D. M. Freeman, “Using a light microscope to measure motions with nanometer accuracy,” Opt. Eng., vol. 37, no. 4, p. 1299, Apr. 1998. [ Links ]
[6] A. J. Aranyosi and D. M. Freeman, “Sound-Induced Motions of Individual Cochlear Hair Bundles,” Biophys. J., vol. 87, no. 5, pp. 3536-3546, Nov. 2004. [ Links ]
[7] S. J. T.; D. M. Freeman, “Multi-image gradient-based algorithms for motion estimation,” Opt. Eng., vol. 40, no. 9, p. 2003, Sep. 2001. [ Links ]
[8] J. Zhang, G. Jin, S. Ma, and L. Meng, “Application of an improved subpixel registration algorithm on digital speckle correlation measurement,” Opt. Laser Technol., vol. 35, no. 7, pp. 533-542, Oct. 2003. [ Links ]
[9] C. Poilane, E. Lantz, G. Tribillon, and P. Delobelle, “Measurement of in-plane displacement fields by a spectral phase algorithm applied to numerical speckle photograph for microtensile tests,” Eur. Phys. J. Appl. Phys., vol. 11, no. 2, pp. 131-145, Aug. 2000. [ Links ]
[10] D. St-Jacques, S. Martel, and T. B. FitzGerald, “Nanoscale grid based positioning system for miniature instrumented robots,” in Canadian Conference on Electrical and Computer Engineering, 2003. IEEE CCECE 2003, 2003, vol. 3, pp. 1831-1834. [ Links ]
[11] D. B. Boyton, “Position encoder using statistically biased pseudorandom sequence,” US006789042B2, 2004. [ Links ]
[12] V. Guelpa, P. Sandoz, M. A. Vergara, C. Clévy, N. Le Fort-Piat, and G. J. Laurent, “2D visual micro-position measurement based on intertwined twin-scale patterns,” Sensors Actuators A Phys., vol. 248, pp. 272-280, Sep. 2016. [ Links ]
[13] M. J. Yao, “Method of printing location markings on surfaces for microscopic research,” US 20140255274A1, 2013. [ Links ]
[14] M. Wrenn and D. Soenksen, “Systems and methods for tracking a slide using a composite barcode label,” WO 2014018114 A1, 2016. [ Links ]
[15] A. Bosseboeuf and S. Petitgrand, “Characterization of the static and dynamic behaviour of M(O)EMS by optical techniques: status and trends,” J. Micromechanics Microengineering, vol. 13, no. 4, pp. S23-S33, Jul. 2003. [ Links ]
[16] M. Takeda and K. Mutoh, “Fourier transform profilometry for the automatic measurement of 3-D object shapes,” Appl. Opt., vol. 22, no. 24, p. 3977, Dec. 1983. [ Links ]
[17] J.-A. Galeano-Zea, P. Sandoz, E. Gaiffe, J.-L. Pretet, and C. Mougin, “Pseudo-Periodic Encryption of Extended 2-D Surfaces for High Accurate Recovery of any Random Zone by Vision,” Int. J. Optomechatronics, vol. 4, no. 1, pp. 65-82, Jan. 2010. [ Links ]
[18] P. Sandoz, J.-M. Friedt, and E. Carry, “In-plane rigid-body vibration mode characterization with a nanometer resolution by stroboscopic imaging of a microstructured pattern.,” Rev. Sci. Instrum., vol. 78, no. 2, p. 23706, Feb. 2007. [ Links ]
[19] J. A. Galeano Z., P. Sandoz, E. Gaiffe, S. Launay, L. Robert, M. Jacquot, F. Hirchaud, J.-L. Prétet, and C. Mougin, “Position-referenced microscopy for live cell culture monitoring,” Biomed. Opt. Express, vol. 2, no. 5, p. 1307, May 2011. [ Links ]
[20] C.-C. Liang, A. Y. Park, and J.-L. Guan, “In vitro scratch assay: a convenient and inexpensive method for analysis of cell migration in vitro.,” Nat. Protoc., vol. 2, no. 2, pp. 329-33, Feb. 2007. [ Links ]
[21] P. Sandoz, J.-M. Friedt, and E. Carry, “Vibration amplitude of a tip-loaded quartz tuning fork during shear force microscopy scanning.,” Rev. Sci. Instrum., vol. 79, no. 8, p. 86102, Aug. 2008. [ Links ]

