


Serviços Personalizados
Journal
Artigo
 Inglês (pdf)
 Artigo em XML
 Referências do artigo
 Enviar este artigo por email
Indicadores
-
 Citado por SciELO
 -
 Acessos
Links relacionados
-
 Citado por Google
 -
 Similares em
SciELO
Similares em
SciELO -
 Similares em Google
Compartilhar

 Permalink
TecnoLógicas
versão impressa ISSN 0123-7799versão On-line ISSN 2256-5337
TecnoL. vol.20 no.40 Medellín dez. 2017
Artículo de investigación/Research article
Detecting atypical functioning of emotional processing in Colombian ex-combatants
Detección de procesamiento atípico de emociones en excombatientes colombianos
Mónica V. Rodríguez-Calvache1, Andrés Quintero-Zea2, Sandra P. Trujillo-Orrego3, Natalia Trujillo-Orrego 4 y José D. López-Hincapié5
1 Electronic engineer, SISTEMIC, Engineering Faculty, University of Antioquia (UDEA), Medellín-Colombia, viviana.rodriguez@udea.edu.co
2 Electronic engineer, SISTEMIC, Engineering Faculty, University of Antioquia (UDEA), Medellín-Colombia, andres.quintero@udea.edu.co
3 Psychologist, Department of Psychology, Universidad de Granada, Granada-España, sandra.trujillo@udea.edu.co
4 PhD. in Neuroscience, Psychologist, Mental Health Group, School of Public Health, University of Antioquia (UDEA), Medellín-Colombia, natalia.trujillo@udea.edu.co
5 PhD. in Engineering ,Electronic engineer, SISTEMIC, Engineering Faculty, University of Antioquia (UDEA), Medellín-Colombia, josedavid@udea.edu.co
Fecha de recepción:12 de junio de 2017/ Fecha de aceptación: 23 de agosto de 2017
Como citar / How to cite
M.V. Rodríguez-Calvache, A. Quintero-Zea, S.P. Trujillo-Orrego, N. Trujillo-Orrego, y J.D. López-Hincapié, Detecting Atypical functioning of Emotional processing in Colombian Ex-combatants. TecnoLógicas, vol. 20, no. 40, pp. 83-96, 2017.
Abstract
The reincorporation process of Colombian ex-combatants is hindered by their chronic exposure to violence, which affects their Emotional Processing (EP). Characterizing their EP will contribute to their reinsertion. The objective of this work is to define an EEG-based brain connectivity approach to identify differences in EP between Colombian ex-combatants and individuals who were not directly exposed to the armed conflict. The proposed approach involves defining the Regions of Interest (ROI) and selecting one of five commonly used brain connectivity metrics: Correlation, Cross-Correlation, Coherence, Imaginary part of Coherency, and Phase-Lag Index. Significant differences were found in the positive valence stimuli in the Beta frequency band. These results support the previously reported trend in the literature regarding the difficulties ex-combatants have to process emotional information with positive valence.
Keywords: Brain Connectivity, Colombian Ex-combatants, EEG, Emotional Processing, ROI selection.
Resumen
El proceso de reincorporación social de los excombatientes colombianos, se dificulta debido a que la exposición crónica a la violencia afecta su procesamiento emocional (PE). Este proceso de reincorporación se puede facilitar mediante la caracterización de su PE. El objetivo de este artículo es definir una metodología de conectividad con EEG que permita identificar diferencias entre el EP de excombatientes y personas no directamente expuestas al conflicto armado. La metodología propuesta consiste en definir las Regiones de Interés (ROI) y seleccionar una de cinco métricas de conectividad funcional cerebral comúnmente utilizadas: correlación, correlación cruzada, coherencia, parte imaginaria de la coherencia y el índice de desfase. Se encontraron diferencias significativas en los estímulos con valencia positiva en la banda de frecuencias Beta. Estos resultados apoyan la tendencia previamente reportada en la literatura hacia las dificultades de los excombatientes para procesar información emocional con valencia positiva.
Palabras clave: Conectividad cerebral, excombatientes colombianos, EEG, procesamiento emocional, selección de las ROI.
1. Introduction
Reincorporation is a process whereby Colombian ex-combatants adapt to society after being part of an illegal armed group. This process is affected by their chronic exposure to violence, which is evidenced in changes in the expression of personality traits, social and cognitive behavior [1]. In the cognitive domain, some ex-combatants describe functional illiteracy or exhibit deficits in the executive function [2]. Together, these findings suggest that the exposition to combat experiences increases the expression of atypical socio-cognitive processes, especially in Emotional Processing (EP). EP is a neurocognitive mechanism in charge of the perception, recognition, evaluation and generation of a response to stimuli and relevant emotional information in the environment. It is crucial for human adaptation and survival [3]. This process begins by identifying changes in internal and external circumstances with different valences that act as triggering situations in emotional recognition [4]. This process activates multiple sources of cortical and subcortical brain structures during the observation of a stimuli and facilitates a rapid response appropriate to the social context [4].
The assessment of their cognitive and behavioral EP profile is crucial to characterize ex-combatants after chronic exposition to war. Moreover, the characterization of EP will contrib-ute to design cognitive training aimed to help ex-combatants in their reintegration process [1]. With this purpose, in this work we propose the use of brain connectivity analysis to de-tect atypical functioning in the EP of Colombian ex-combatants.
Studies in veterans have shown that experiences of combat and trauma during deploy-ment were strongly associated with aggressive and violent behaviors. Veterans mainly mani-fest differences in emotional information processing [5]. Regarding Colombian ex-combatants, an atypical functioning of similar mechanisms is hypothesized. In [2], the au-thors proposed psychological tests to evaluate how Colombian ex-combatants are processing emotional information. They found a slight tendency of ex-combatants to poorly recognize positive emotional valence (specifically, recognizing happy faces), but it did not reach statisti-cal significance compared to the control group.
Another way to study EP consists in evaluating the Event Related Potentials (ERP) modulation [3, 6, 7]. In [6], the authors found associations between the ex-combatants’ ERPs responses to emotional images from the International Affective Picture System (IAPS) system and their empathy levels. In a previous work [7], it was found that when using ERP modulations and the analysis of aggressive responses and social interactions, both groups (ex-combatant and civilian) could be automatically separated by applying supervised machine learning techniques. However, we only used psychological tests and ERPs modulations in response to visual stimuli [3]. Based on these approaches, it is not possible to recognize how different functional areas contribute to the expression of failures in emotional processing of ex-combatants.
Brain connectivity analysis has been proposed as a useful methodology to evaluate interconnected activation during EP [8, 9]. This technique focuses on how the brain processes the information to establish the pattern of activation required to generate a cognitive process [10]. Connectivity can be described at several levels: anatomical or structural, functional, and effective [11]. Functional connectivity is modified by life experiences [11] and has been employed to evaluate the EP of clinical populations with psychiatric disorders [12]. Thus, functional connectivity analysis can be useful for the evaluation of the EP of subjects without clinical conditions but with special characteristics, such as exposure to armed conflict [11].
Functional connectivity is defined as the temporal dependency of neural activation patterns of brain areas. It does not include directionality information. It relies on statistical measures such as correlation, covariance, spectral coherence or phase locking. Commonly, the computation of functional connectivity requires high temporal resolution and, for this specific population, it should be portable; therefore, electroencephalography (EEG) is a viable recording option [11].
The interpretation of the connectivity analysis performed on scalp-level EEG data is difficult and error-prone, because any neurophysiological interpretation of EEG data is hindered by the volume conduction problem [13]. Volume conduction can lead to uncertainties for many but not all connectivity analysis. Uncertainties exist because the connectivity could come from electrodes measuring activity from a single brain source, and not from true interactions between electrodes [13].
There are several metrics to estimate functional connectivity, each of them affected to different degrees by this phenomenon. In this work, we propose to select one of five functional connectivity metrics: Correlation, Cross-Correlation, Coherence, Imaginary part of Coherency and the Phase-Lag Index [14]. To achieve this, we provide an explanation of how these connectivity metrics work, including their quantitative definition.
To assess the EP in ex-combatants, thirty Colombian ex-combatants and 20 Colombian individuals participated in the study. They performed an emotional recognition computerized task that used visual stimuli from the IAPS [15] , synchronized with EEG recordings. In general, these stimuli can generate emotional activation in a similar way to real conditions [16] . Using this dataset, we generated connectivity maps based on the metrics previously mentioned to compare their performance in group analysis. Finally, by using statistical tests we identified significant differences between the emotional processing of ex-combatants and civilians.
2. Methodology
2.1 Experiment set-up
2.1.1 Participants
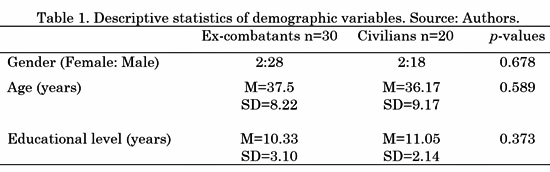
Fifty participants took part in the experiment: 30 Colombian ex-combatants (Two female) recruited from the government's ARN (Reincorporation and Normalization Agency, former ACR) program and 20 civilian people with no combat background (paired by gender, age and educational level). All the participants read and signed an informed consent form before the beginning of the study. The study's procedures and informed consent were approved by the Bioethical Committee of the Faculty of Medicine of University of Antioquia in Medellín, Colombia. None of the participants manifested to have psychiatric, neurological or drug abuse disorders. Their demographic information is provided in Table 1 (M= Mean, SD= Standard Deviation). A Wilcoxon signed-rank test was performed to ensure consistency in age, gender and educational level differences across groups; the p-values are reported in the last column of Table 1.
2.1.2 Emotional processing - experimental task
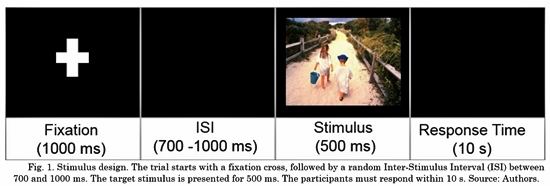
Participants performed an emotional categorization task based on the International Affective Picture System (IAPS) [15] validated for Colombian population [17] . This system consists of a set of visual stimuli with a wide range of semantic categories (positive, negative and neutral); positive and negative images contain high emotional intensity. These visual stimuli generate emotional activation in a similar way to real conditions: induction of mental representations, psycho-physiological changes, and facial action [16] . The task was designed in E-prime Software [18] . The participants were asked to categorize the stimulus displayed on a computer screen according to their valence, responding whether the stimuli were positive, neutral or negative as quickly as possible. In total, 60 images were selected from the IAPS, in accordance according with their Colombian validation [17] . The task was divided into four blocks. Each block consisted of 60 trials with images (20 positives, 20 neutrals and 20 negatives). Each stimulus was presented randomly presented per block, in total 240 stimuli were presented. The IAPS images were controlled in terms of brightness, color and intensity. They were presented in a 17-inch screen, 60 cm away from the participant.
Fig. 1 shows the task pipeline; it consists of four steps per trial. At first, a fixation cross is presented for 1000 ms to promote attentional focus on the center. Second, there is an inter-stimulus interval ranging from 700 to 1000 ms. This step avoids habituation and the prediction of the next stimulus. Third, the stimulus is presented: IAPS images with different valence (positive, negative or neutral). This step lasts 500 ms. Finally, a response time of maximum 10 s was set.
2.1.3 Data acquisition
EEG recordings were acquired with a 64-electrode NeuroScan EEG SynAmps2 amplifier [19] at a sample rate of 1000 Hz. The electrodes were placed in accordance with the international 10-20 system. The impedances were maintained below 10 kΩ to obtain a good conductivity between the scalp and the electrodes. Scan 4.5 software was used for data recording [19] . The participants were seated in a comfortable chair in front of a computer monitor, at a distance of 60 cm, inside a Faraday cage with the lights off for guaranteeing isolated electric conditions. The participants were asked to try not to blink, move, or speak while performing the task.
2.1.4 Signals preprocessing
EEG recordings were preprocessed in EEGLab toolbox for MATLAB [20] . The first step in the preprocessing was to down-sample the signal from 1000 Hz to 500 Hz. They were re-referenced using Mastoids as a common reference for all channels. Then, a band-pass IIR digital filter was applied from 0.1 to 60 Hz to reduce environmental artifacts (power line noise) in the EEG data and to extract specific frequency bands associated with human cognition.
To distinguish between artifacts and neural components of EEG signals, an automatic method described in [21] was employed. The automatic method is based on Independent Component Analysis (ICA) and Support Vector Machine (SVM). This method has the ability to isolate artifact components such as eye blinking, eye movements (EOG), muscular contractions (EMG) or cardiac signals (ECG) with high accuracy [21].
After identifying the artifacts’ independent components, they were removed and the original configuration (64-channel EEG) of the signals was reconstructed. Then, the recordings were segmented from 200 ms before the stimulus to 800 ms after it. For each trial, the stimulus was tagged as negative, neutral or positive for the emotional processing task. Baseline correction was performed by subtracting the mean of the signal during the time window from -200 to 0 ms before the stimulus. Then, each trial was inspected for leftover noise in the signals to make sure only clean segments underwent further analysis. Finally, four electrodes (HEO, VEO, CB1 and CB2) were excluded as they do not record neural activity.
2.2 Selection of the functional connectivity metric)
There are several connectivity metrics used to estimate how different brain areas are connected during an experimental task. Functional connectivity is assessed by metrics that establish the existence of any type of covariance between two neurophysiological signals without providing any causal information. Below, five metrics divided into three different categories are described (see Fig. 2).
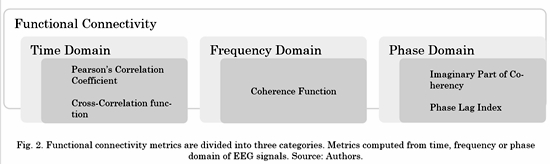
As shown in Fig. 2, not all functional connectivity metrics are represented in the frequency domain. Then, before computing the non-frequency-based ones, it was necessary to extract specific frequency bands associated with human cognition. Five band-pass IIR digital filters (with orders varying from 9 to 12, depending on the band) were applied to the previously preprocessed EEG signals to divide them into different frequency bands of interest: Delta (0.10 Hz-3.99 Hz), Theta (4.00 Hz-7.99Hz), Alpha (8.00 Hz-13.99 Hz), Beta (14.00 Hz-29.99 Hz) and Gamma (30.00 Hz-59.9 Hz).
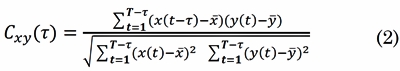
The Pearson’s Correlation Coefficient (COR) and the Cross-Correlation Function (XCOR) are time-domain-based. The COR is defined as the covariance of two signals scaled by the variance of each one of them and it estimates the linear correlation between them [22] . If (t) ∈ ℝ T and y(t) ∈ ℝ T are EEG signals at two different electrodes, and T is the number of time samples per epoch (t = 1, 2,...,T) the COR Rxy is defined as:
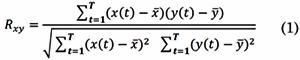
Where X and Y are the sample mean of x(t) and y(t) respectively. The result of computing Rxy is a scalar value at a given time window. The range of COR is 0 ≤ Rxy ≤ 1. When, Rxy = 0, signals x(t) and y(t) have no linear interdependence, while Rxy = 1 means complete linea r direct correlation between the two signals. Therefore, higher correlations indicate stronger functional connection between the related signals.
The XCOR is the cross-covariance of two EEG signals, x(t) and, y(t), scaled by their individual variance [22] . The XCOR appraises the linear correlation between the signals as a function of time (t = 1,2,...,T - t):
Where t is the time lag determined by the argument of the maximum XCOR When t = 0, XCOR is equal to the Pearson’s correlation coefficient. The result of Cxy is a scalar value at a given time window. XCOR values ranges between 0 ≤ Cxy (t) ≤ 1. When Cxy (t) = 0, signals x(t) and y(t) have no linear interdependence at time lagt, and Cxy (t) = 1 represents complete linear direct correlation at time lag t.
In the frequency domain, the Coherence Function (COH) quantifies the linear relations between signals at a specific frequency. COH is defined as the absolute value of the complex coherence [23] . Coherence estimates how the phases in two different channels are coupled to each other. Coherence is calculated by the cross-spectral density function Sxy of the two EEG signals, normalized by their individual auto-spectral density functions. Complex coherence is calculated as follows:
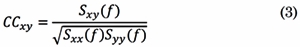
In Eq. (3), Sxx(f) and Syy(f) are the auto-spectral densities of x(t) and, y(t),, respectively. Then, COH coefficients are computed for each frequency f as follows:
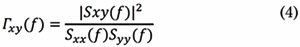
The normalization factor puts coherence on a scale from 0 to 1, where one means complete coherence and zero, complete independence between x(t) and y(t) at frequency f.
The Imaginary Part of Coherency (ICOH) is obtained when complex values of the coherence are projected onto the imaginary axis [24] . ICOH is a metric of phase-synchronization between two signals x(t) and y(t) that uses the same equation as COH (Eq. 3), except that the imaginary part of coherence is selected before computing the magnitude. ICOH is zero when the cross-spectrum between the two EEG signals, x(t) and y(t), has a 0° or 180° phase, and maximum when the cross-spectrum has a phase of ±90°. Then, ICOH is not affected by the 0° or 180° cross-spectral relationship between the volume-conducted activities of a single source at two separate sensors. Discarding contributions to the connectivity estimate along the real axis explicitly removes instantaneous potentially-spurious interactions due to field spread of volume conduction. Thus, ICOH captures true source interactions at a given time lag [24].
Phase-Lag Index (PLI) is a phase-synchronization metric that quantifies the asymmetry of the distribution of phase differences between two signals [25] . PLI is based on the imaginary component of the cross-spectrum; then, it is not spuriously affected by volume conduction or by a common reference. PLI is computed by averaging the sign of the estimated phase difference between x(t) and y(t) per observation:

Where E[·] is the expected value operator, sng[·] is the sign function, and Δ φ t is the phase angle difference between the signals at time instant t. The range of PLI is 0 ≤ PLI xy ≤ 1. When PLI xy = 0 there is no coupling between the signals x(t) and y(t) when PLI xy = 1, there is perfect phase locking at a value of Δ φ t between both signals.
2.3 Selection of the Regions of Interest (ROIs)
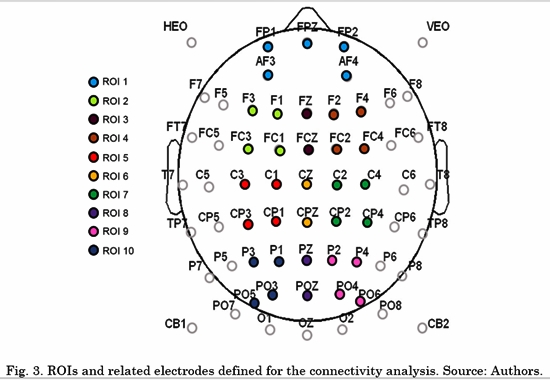
Several studies have reported that a circuit of activated or deactivated brain regions is involved in many aspects of emotion (i.e. affective style, aggressive and violent behavior, emotional processing and emotion regulation),. The circuit involves not only subcortical areas (e.g., amygdala or the basal ganglia), but also cortical areas, mainly Prefrontal Cortex (PFC), Anterior Cingulate Cortex (ACC), as well temporal and medial parietal cortices [26] . Considering these findings, we defined 10 initial regions of interest (ROI) for further connectivity analysis of interaction patterns. Subsequently, the connectivity spatial patterns of the selected metric and the results of a Wilcoxon Rank-Sum statistical test were analyzed to eliminate the regions where no significant differences were found between ex-combatants and controls for any of the connections across these and other regions. The initial ROIs are depicted in Fig. 3.
Linear Discriminant Analysis LDA [27] was used to compare the performance of the functional connectivity metrics when classifying ex-combatants vs. civilians for each condition of the emotional processing experimental task (negative, neutral and positive) in the previously described ROIs and for each tested frequency band.
We used the Wilcoxon rank-sum test [28] to identify the group differences in functional connectivity between ex-combatants and civilians. Three between-group Wilcoxon Rank-Sum tests were calculated: 1. Group (Ex-combatants vs. Controls), 2. Condition × Group, and 3. Condition × Band × Group. Statistical analyses were performed using MATLAB and a significance level of p < 0.05. All the tests were subjected to correction for multiple comparison. With these comparisons, we expected to find significant differences between Colombian ex-combatants and individuals not directly exposed to the armed conflict
3. Results and discussion
3.1 Selection of the functional connectivity metric
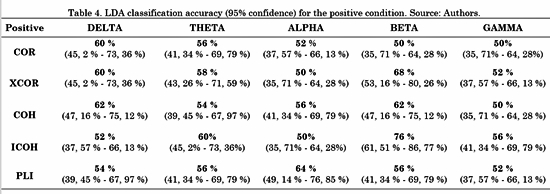
The connectivity metrics presented above were analyzed. Different LDAs were implemented for task conditions and frequency bands. Forty-five features for LDA were obtained by averaging the connectivity values from all electrodes from one ROI to another. For instance, the connectivity from left frontal-central to right frontal-central regions (RoI 3 and RoI 4 in Fig. 3) is the average connectivity of all pairs from (F1, Fc1, F3 and Fc3) to (F2, F4, Fc2 and Fc4). Then, a vector of 45 features per subject was the input for each LDA classifier. The LDA performances were evaluated using a 10-fold cross-validation for each class. LDA classification accuracy for negative, neutral and positive conditions is shown in Table 2, 3 and 4, respectively.
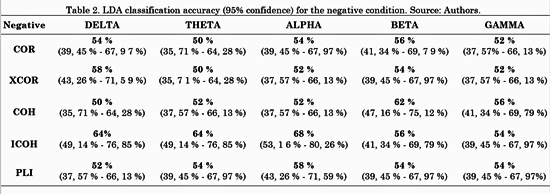
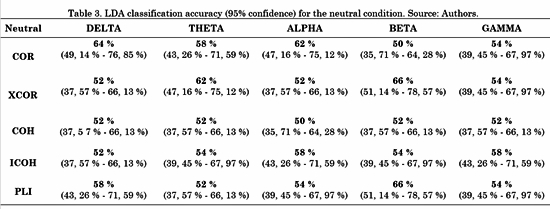
For the negative condition, Table 2 shows that the metric with highest performance was ICOH in three out of five (Delta, Theta and Alpha) frequency bands. COH had a better performance for Beta and Gamma bands. For the neutral condition, Table 3 shows no concrete results about which metric was better, since each one had higher accuracy for one or two out of five frequency bands, except for COH with none.
For the positive condition, Table 4 shows that the performance of ICOH was considerably better in the Beta band than the other metrics. Additionally, ICOH had a better performance in Theta and Gamma bands. COH showed better performance in the Delta band and PLI showed better performance in the Alpha band.
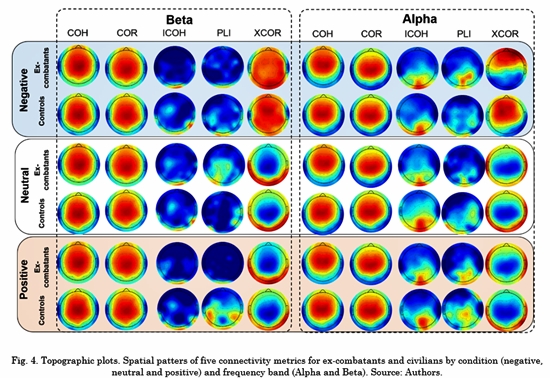
3.2 Representation of spatial patterns
The topographical connectivity maps for Alpha and Beta frequency bands across each condition are depicted in Fig. 4. Each map represents the within-group average value of the connectivity metric per electrode. The strongest connection is depicted in red color and the weakest in dark blue. All the maps were plotted using the topographic plot function of EEGLab toolbox [20] . Based on Fig. 4, the connectivity spatial patterns of COR, XCOR and COH suggest that their results were affected by volume conduction. Besides, the ICOH and PLI patterns were similar to each other in both groups, concentrated in the occipital-parietal brain areas. Together with LDA results, ICOH had the best performance when classifying ex-combatants vs. civilians. Thus, ICOH was selected for further analysis.
3.3 Selection of the brain region of interest
Regarding the ROI, the connectivity spatial patterns of ICOH exhibit low connectivity in the frontal regions in most frequency bands (See Fig. S1-S5) for every task condition. Additionally, no significant differences were found between ex-combatants and controls in any of the connections across the frontal regions (ROI1 to ROI4) and the remaining area. Even though the frontal lobe is crucial for cognitive control functioning, there is no evidence of a difference in this dimension inex-combatants. Indeed, previous studies have suggested a reorganization of posterior neural regions during the processing of social cognition among ex-combatants [3, 6] . Particularly, N170 is a posterior ERP component that has been associated with valence recognition of faces and words. In this line, studies in ex-combatants have suggested a larger activation across parietal regions during face processing and limited modulation for the emotional content of words. This kind of modulation has not been reported in frontal areas. It should be noted that this is an emotional recognition task designed to modulate and activate posterior and central areas, i.e., the task does not include an explicit cognitive control instruction necessary to elicit more robust anterior activation.
Then, the four frontal ROIs were rejected for the final model. The new ROIs were ROI1= C1, Cp1, C3 and Cp3, ROI2= Cz and CpZ, ROI3= C2, Cp2, C4 and Cp4, ROI4= P1, P3, Po3 and Po5, ROI5= PZ and PoZ, and ROI6= P2, P4, Po4 and PO6.
3.4 Statistical test results
Group (Ex-combatants vs. Controls): In this test, the full information (all frequency bands and all conditions) was included. No significant differences were found in each pair. However, the p-values suggested a tendency to differentiate the connectivity of both groups between pairs: ROI1-ROI2 (p=0.021, q=0.173), ROI2-ROI3 (p=0.023, q=0.173) and ROI3-ROI5 (p=0.049, q=0.245). In these three cases, the median connectivity between ROIs was higher in the controls than in the ex-combatants group, and the percentages of difference in connectivity were 11%, 8% and 10%, respectively (See Table S1).
Condition × Group: No significant differences were found between ex-combatants and controls for negative and neutral conditions. Significant differences between ex-combatants and controls were found in the connectivity across ROI1-ROI4 (p=0.0027, q=0.0209) and ROI3-ROI4 (p=0.0010, q=0.0152) for the positive condition. Consistently with the differences found in the first test, the connectivity across these regions was higher in controls. The connectivity across regions ROI1 and ROI4 was 17.42%, and across ROI3 and ROI4 was 26.79% higher in the control group (See Table S2).
Condition × Band × Group: No significant differences between ex-combatants and controls were found in Delta, Theta, Alpha, and Gamma bands for any condition. In the Beta band, significant differences between ex-combatants and controls were found for positive condition in the connectivity between regions ROI2-ROI4 (p=0.0044, q=0.0336), and between regions ROI3-ROI4 (p=0.0005, q=0.0088). The connectivity of controls in ROI2-ROI4 and ROI3-ROI4 was 17.63% and 27.46% higher than the ex-combatants’ connectivity, respectively (See Table S3-S7).
With the proposed methodology, significant differences between ex-combatants and civilian people were obtained. Differences in the connectivity were found in the stimulus with positive valence in the Beta frequency band. Even though neutral valence is commonly misclassified as negative in normal population, the recognition of emotional stimuli that refers to potential negative/neutral information is necessary for evolutionary purposes [29]. In this sense, combat experience might preserve the ability to categorize images with content.
The overall results are consistent with Table 4, in which the best performance for the ICOH metric in the beta band corresponded to the positive stimulus. The Beta band has been associated with emotional processing in the evaluation of all types of valence [30] . Some studies demonstrated a wide posterior and anterior synchronization associated with the evaluation of positive content [30]. The authors found that the Beta band was more strongly involved in the evaluation of positive content than negative-valence content [31]. Additionally, these findings support the literature regarding the difficulties Colombian ex-combatants have to process emotional information with positive valence [6, 7].
4. Conclusion
In this work, we presented a methodology to find atypical functioning in the EP of Colombian ex-combatants using brain connectivity analysis. First, we presented the advantages and drawbacks of five widely used functional connectivity metrics: COR, XCOR, COH, ICOH, and PLI. Their connectivity spatial pattern representations were affected and several LDA were implemented. As a result, we identified that COR, XCOR and COH metrics were influenced by the volume conduction, because their patterns revealed that the connectivity was dominated by local connections among adjacent sensors. In contrast, PLI and ICOH patterns were similar to each other. Additionally, local connections were absent in ICOH and PLI. Then, with the results of the LDA we concluded that ICOH presented the best performance, because using this metric we obtained higher accuracy values for two out of the three task conditions.
By using the ICOH metric, ex-combatants presented significant differences in the processing of emotional information with positive valence. These differences were found in the connectivity across two pairs in the Beta frequency band: the first is composed of the medial central-parietal (Cz-Cpz) and the right central-parietal (C2, Cp2, C4, Cp4) regions, and the second one comprises the right central-parietal and left parietal-occipital (P1, P3, Po3, Po5) regions. Based on these results, we conclude that Colombian ex-combatants and civilians present a similar processing of emotional information for stimuli with neutral and negative valence, but there are differences in the stimuli with positive valence. This atypical connectivity may be due to the conditions experienced in the armed conflict. There is potential in using these functional markers in diagnosis and as a first step in the development of future intervention treatments. The use of biological markers obtained with this method might help to complement neuropsychiatric evaluation of chronic exposition to combat (i.e., Post-traumatic Stress Disorder) and be the basis for future intervention treatments, not only for ex-combatants, but for population directly exposed to armed conflicts.
References
[1] S. Trujillo, N. Trujillo, J. D. Lopez, D. Gomez, S. Valencia, J. Rendon, D. A. Pineda, and M. A. Parra, “Social Cognitive Training Improves Emotional Processing and Reduces Aggressive Attitudes in Ex-combatants,” Front. Psychol., vol. 8, p. 510, Apr. 2017. [ Links ]
[2] C. Tobón, D. C. Aguirre-Acevedo, L. Velilla, J. Duque, C. P. Ramos, and D. Pineda, “Perfil psiquiátrico, cognitivo y de reconocimiento de características emocionales de un grupo de excombatientes de los grupos armados ilegales en Colombia,” Rev. Colomb. Psiquiatr., vol. 45, no. 1, pp. 28-36, Jan. 2016. [ Links ]
[3] S. P. Trujillo, S. Valencia, N. Trujillo, J. E. Ugarriza, M. V. Rodríguez, J. Rendón, D. A. Pineda, J. D. López, A. Ibañez, and M. A. Parra, “Atypical Modulations of N170 Component during Emotional Processing and Their Links to Social Behaviors in Ex-combatants,” Front. Hum. Neurosci., vol. 11, p. 244, May 2017. [ Links ]
[4] M. Batty and M. J. Taylor, “Early processing of the six basic facial emotional expressions,” Cogn. Brain Res., vol. 17, no. 3, pp. 613-620, Oct. 2003. [ Links ]
[5] R. A. Morey, C. M. Petty, D. A. Cooper, K. S. LaBar, and G. McCarthy, “Neural systems for executive and emotional processing are modulated by symptoms of posttraumatic stress disorder in Iraq War veterans,” Psychiatry Res. Neuroimaging, vol. 162, no. 1, pp. 59-72, Jan. 2008. [ Links ]
[6] C. Tobón, A. Ibañez, L. Velilla, J. Duque, J. Ochoa, N. Trujillo, J. Decety, and D. Pineda, “Emotional processing in Colombian ex-combatants and its relationship with empathy and executive functions,” Soc. Neurosci., vol. 10, no. 2, pp. 153-165, Mar. 2015. [ Links ]
[7] A. Quintero-Zea, L. M. Sepúlveda-Cano, M. Rodríguez Calvache, S. Trujillo Orrego, N. Trujillo Orrego, and J. D. López, “Characterization Framework for Ex-combatants Based on EEG and Behavioral Features,” in VII Latin American Congress on Biomedical Engineering CLAIB 2016, Bucaramanga, Santander, Colombia, October 26th-28th, 2016, 2017, pp. 205-208. [ Links ]
[8] A. Carballedo, J. Scheuerecker, E. Meisenzahl, V. Schoepf, A. Bokde, H.-J. Möller, M. Doyle, M. Wiesmann, and T. Frodl, “Functional connectivity of emotional processing in depression,” J. Affect. Disord., vol. 134, no. 1-3, pp. 272-279, Nov. 2011. [ Links ]
[9] L. A. Pan, S. Hassel, A. M. Segreti, S. A. Nau, D. A. Brent, and M. L. Phillips, “Differential patterns of activity and functional connectivity in emotion processing neural circuitry to angry and happy faces in adolescents with and without suicide attempt,” Psychol. Med., vol. 43, no. 10, pp. 2129-2142, Oct. 2013. [ Links ]
[10] S. Haufe, V. V Nikulin, K.-R. Müller, and G. Nolte, “A critical assessment of connectivity measures for EEG data: A simulation study,” Neuroimage, vol. 64, pp. 120-133, Jan. 2013. [ Links ]
[11] K. J. Friston, “Functional and Effective Connectivity: A Review,” Brain Connect., vol. 1, no. 1, pp. 13-36, Jan. 2011. [ Links ]
[12] N. M. Kleinhans, T. Richards, L. Sterling, K. C. Stegbauer, R. Mahurin, L. C. Johnson, J. Greenson, G. Dawson, and E. Aylward, “Abnormal functional connectivity in autism spectrum disorders during face processing,” Brain, vol. 131, no. 4, pp. 1000-1012, Apr. 2008. [ Links ]
[13] M. X. Cohen, Analyzing neural time series data: theory and practice. MIT Press, 2014. [ Links ]
[14] E. W. Lang, A. M. Tomé, I. R. Keck, J. M. Górriz-Sáez, and C. G. Puntonet, “Brain Connectivity Analysis: A Short Survey,” Comput. Intell. Neurosci., vol. 2012, pp. 1-21, 2012. [ Links ]
[15] P. Lang and M. M. Bradley, The International Affective Picture System (IAPS) in the study of emotion and attention, vol. 29. Oxford University Press USA New-York, NY, USA, 2007. [ Links ]
[16] J. A. Mikels, B. L. Fredrickson, G. R. Larkin, C. M. Lindberg, S. J. Maglio, and P. A. Reuter-Lorenz, “Emotional category data on images from the international affective picture system,” Behav. Res. Methods, vol. 37, no. 4, pp. 626-630, Nov. 2005. [ Links ]
[17] C. A. Gantiva Díaz, P. Guerra Muñoz, and J. Vila Castellar, “Colombian validation of the international affective picture system: Evidence of cross-cultural origins of emotion,” Acta Colomb. Psicol., vol. 14, no. 2, pp. 103-111, 2011. [ Links ]
[18] W. Schneider, A. Eschman, and A. Zuccolotto, “E-prime, Version 1.1,” Pittsburgh, PA: Psychology Software Tools. 2002. [ Links ]
[19] C. Neuroscan, “NeuroScan 4.5,” North Carolina: Compumedics USA. 2008. [ Links ]
[20] A. Delorme and S. Makeig, “EEGLAB: an open source toolbox for analysis of single-trial EEG dynamics including independent component analysis,” J. Neurosci. Methods, vol. 134, no. 1, pp. 9-21, Mar. 2004. [ Links ]
[21] M. R. Calvache, A. Quintero-Zea, S. T. Orrego, N. T. Orrego, and J. D. Lopez, “Classifying artifacts and neural EEG components using SVM,” in 2016 IEEE Latin American Conference on Computational Intelligence (LA-CCI), 2016, pp. 1-5. [ Links ]
[22] M. A. B. Brazier and J. U. Casby, “Crosscorrelation and autocorrelation studies of electroencephalographic potentials,” Electroencephalogr. Clin. Neurophysiol., vol. 4, no. 2, pp. 201-211, May 1952. [ Links ]
[23] G. Pfurtscheller and C. Andrew, “Event-Related changes of band power and coherence: methodology and interpretation.,” J. Clin. Neurophysiol., vol. 16, no. 6, pp. 512-519, Nov. 1999. [ Links ]
[24] G. Nolte, O. Bai, L. Wheaton, Z. Mari, S. Vorbach, and M. Hallett, “Identifying true brain interaction from EEG data using the imaginary part of coherency,” Clin. Neurophysiol., vol. 115, no. 10, pp. 2292-2307, Oct. 2004. [ Links ]
[25] C. J. Stam, G. Nolte, and A. Daffertshofer, “Phase lag index: Assessment of functional connectivity from multi channel EEG and MEG with diminished bias from common sources,” Hum. Brain Mapp., vol. 28, no. 11, pp. 1178-1193, Nov. 2007. [ Links ]
[26] M. Esslen, R. Pascual-Marqui, D. Hell, K. Kochi, and D. Lehmann, “Brain areas and time course of emotional processing,” Neuroimage, vol. 21, no. 4, pp. 1189-1203, Apr. 2004. [ Links ]
[27] P. Xanthopoulos, P. M. Pardalos, and T. B. Trafalis, “Linear Discriminant Analysis,” in Robust Data Mining, Springer, 2013, pp. 27-33. [ Links ]
[28] F. Wilcoxon, “Individual Comparisons by Ranking Methods,” Biometrics Bull., vol. 1, no. 6, p. 80, Dec. 1945. [ Links ]
[29] Y.-Y. Lee and S. Hsieh, “Classifying Different Emotional States by Means of EEG-Based Functional Connectivity Patterns,” PLoS One, vol. 9, no. 4, p. e95415, Apr. 2014. [ Links ]
[30] M. Balconi and C. Lucchiari, “EEG correlates (event-related desynchronization) of emotional face elaboration: A temporal analysis,” Neurosci. Lett., vol. 392, no. 1-2, pp. 118-123, Jan. 2006. [ Links ]
[31] T. Costa, E. Rognoni, and D. Galati, “EEG phase synchronization during emotional response to positive and negative film stimuli,” Neurosci. Lett., vol. 406, no. 3, pp. 159-164, Oct. 2006 [ Links ]

