


 Inglês (pdf)
 Artigo em XML
 Referências do artigo
 Enviar este artigo por email
 Citado por SciELO
  Citado por Google
  Similares em
SciELO
Similares em
SciELO  Similares em Google
 Permalink
1. INTRODUCTION
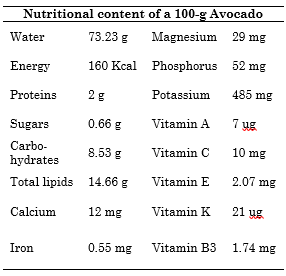
The Hass avocado (Persea Americana Mill) is a tropical fruit highly demanded worldwide due to its nutritional content (shown in Table 1), its different consumption options in fresh and processed products, and its use in the cosmetics industry [1]. Avocado crops have had a great impact on the development of technified fruit crops in Colombia, and the fruit has become a part of the culinary tradition in all the regions in the country. Recently, the number of Hass avocado crops has noticeably increased in Colombia, due to their expanding local and international market. This is important for the Colombian agricultural sector because it represents an excellent export opportunity. Currently, the area cultivated with this kind of fruit is growing in several regions of the country, mainly in the Departments of Tolima, Antioquia, Caldas, Santander, Bolivar, Cesar, Valle del Cauca, Risaralda and Quindío, which represent 86% of the sown area in the country.
Avocados are one of the few fruits that do not ripen on the tree because avocado tree leaves produce a ripening inhibitor that is passed to the fruit through the peduncle [2]. Therefore, a post-harvest management methodology is required to determine the ripening status of avocados in order to have control over the transport chain and guarantee the excellent quality of the product when it is exported. There are different methods to determine the ripening state of avocados [3]. First, probably the most widely used, is the visual inspection of the avocado skin color, since it changes from bright green to dark green or brown [4]; this occurs due to the degradation of chlorophyll and the high concentration of carotenoids and anthocyanins [5]. Second is the firmness method, which is one of the most accurate and reliable techniques to evaluate the ripening state [6]; however, this method is invasive, since it can damage the product, and it requires high-cost industrial instruments such as a penetrometer [7]. And, third, there is the oil content method, which measures the dry matter content of the avocado; this method is a good indicator of ripening, but it is also invasive, expensive, and time-consuming [8].
Considering the impact of specialized and low-cost alternatives [10], non-invasive techniques have been proposed [11], including acoustic image processing [12], spectroscopic imaging [13], and image processing through hyperspectral images (HSI) [14]. HSI have been broadly used by the industry because they provide a large amount of quantitative information in the visible and infrared electromagnetic spectrum region, which can be employed to determine the physicochemical state of a fruit or a crop, monitor the growth of a culture, and analyze stress in a crop, among many other purposes [15].
HSI have a fundamental role in the study of non-invasive classification methods, exploiting spatial and spectral information of the object under study, which is commonly represented by a tridimensional cube with two spatial dimensions and one spectral dimension. Particularly, HSI have reflectance values between 400 and 2500 nanometers along the visible (VIS) and the near infrared (NIR) electromagnetic spectrum [16]. The spectral information acquired in a spatial pixel of an HSI cube is known as a spectral signature. Spectral signatures are important for classification and target detection algorithms because each fruit or object in the scene produces a unique spectral signature, which provides information about its specific characteristics. For that reason, HSI are commonly used in different fields such as agriculture, mining, biology, geology, environmental sciences, and food quality measurement and inspection [17].
Since the use of non-invasive and low-cost methodologies allows the monitoring of fruit ripening and quality, this work studies, analyzes, and tracks the ripening state of Hass avocados via a non-invasive hyperspectral imaging system that captures spectral images of avocados. The latter are then processed using principal component analysis (PCA) and spectral vegetation indices such as NDVI, RVI, and PRI, and compared with colorimetry analysis in the RGB and CIE L*a*b* color space, as well as using the TGI index. In particular, the quantitative and qualitative analyses were carried out on 7 avocados over a period of 10 days stored at room temperature. The avocados were classified into three categories: unripe, close-to-ripe and ripen.
2. MATERIALS AND METHODS
2.1 Avocado Selection
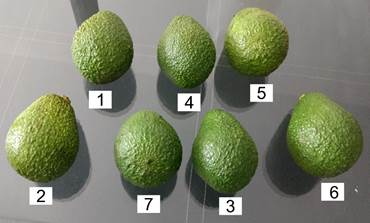
The Hass Avocados were collected during the harvest season of October 2018. Seven samples were collected, which were cut from the peduncle, three millimeters away from the base of the avocado (see Fig. 1). The avocado farm is located in the town of Tona, Santander, Colombia (7° 15° north latitudes, 73° 03' west longitude) in the village Montechiquito. Such avocados were cut from the same crop and the same tree, and classified by the farmer, via visual and tactile inspection, into three different states: unripe, close-to-ripe and ripen.
Afterwards, the avocados were evaluated by means of a temporary analysis in the laboratory, capturing the spectral signatures of each avocado every day for 10 days using the optical setup described below.
2.2 Experimental Setup
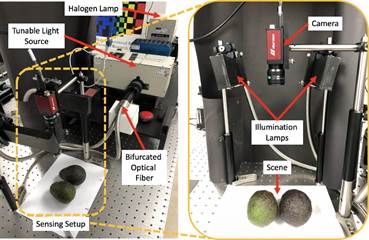
An optical assembly was built in our laboratory to capture spectral images of the avocados. The built setup is shown in Fig. 2. This assembly uses a tunable light source (Oriel Instruments, TLS-300XR) that decomposes the illumination from a halogen light source in its corresponding monochromatic wavelengths, with steps of 6 nm within the spectral range between 300 and 900 nanometers. Such monochromatic light is propagated through a bifurcated optical fiber (Illumination Technologies, 9145HT dual 6" lightline) towards 2 lamps that illuminate the sample scene.
Source: Authors’ own work.
Fig. 2 Optical assembly built in our lab to capture hyperspectral images of the avocados. Monochromatic light between 300 and 900 nm was used to illuminate the sample scene, which is observed by a grayscale sensor.
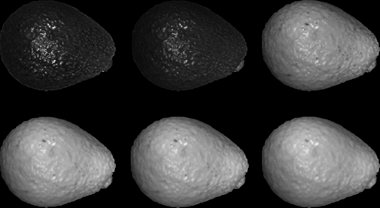
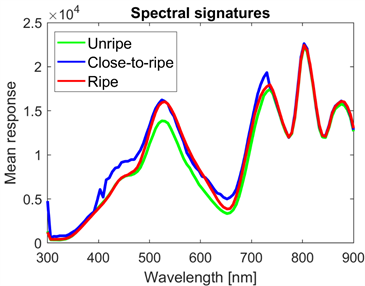
The lens (Navitar, MVL8M23, 8 mm EFL, f/1.4) and camera (Stingray F-080B) pair is focused on the scene in such a way that the monochromatic sensor captures the intensity of the monochromatic light reflected by the avocados. The hyperspectral image of each avocado exhibits 600*900 pixels of spatial resolution and 100 wavelengths. Some examples of spectral bands captured with the proposed assembly are shown in Fig. 3, and the mean spectral responses of the three categories are plotted in Fig. 4.
Source: Authors’ own work.
Fig. 3 Example of some spectral bands captured by the optical assembly for each avocado. Two bands of the visible spectrum (480 and 600 nm) and four of the infrared spectra (720, 750, 840 and 870 nm) are shown.
2.3 Pre-processing
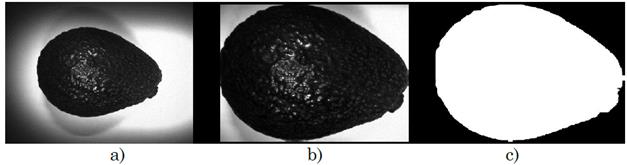
To analyze the set of hyperspectral images acquired in the laboratory, we first implemented an algorithm to extract the region of interest, i.e. the avocado. Such algorithm performs erosion, dilation, and close operations, followed by binarization and extraction. In particular, Fig. 5 (a) shows the original image acquired by the sensor; Fig. 5 (b), the trimmed avocado image; and Fig. 5 (c), the cropped and binarized image. After the pre-processing, the binarized image was multiplied with the hyperspectral image of each sample to obtain the reflectance values of the avocados.
2.4 Principal Component Analysis (PCA)
The method we selected to perform the avocado ripening analysis was principal component analysis (PCA). Such method is commonly used in the analysis of large amounts of data, since it allows to reduce their dimensionality into a few uncorrelated variables that describe the total variance of the data. In our case, each avocado contains 100 spectral bands between 300 and 900 nanometers; that is, each pixel of each avocado has 100 variables that describe its behavior. If we assume each pixel of each avocado as a sample, we have 600*900 = 540,000 samples per avocado.
It is important to clarify that many of these samples are highly correlated because each avocado is mostly uniform; however, certain spatial variations within each avocado that may indicate its ripening state. Therefore, we carried out both analyses, the one considering each pixel of each avocado as a sample, and the one where each avocado is considered as a sample. For the latter, we assume that the average of all the spectral signatures of each avocado describes its behavior.
2.5 Spectral Vegetation Indices
Biophysical features of plants can be spectrally characterized by vegetation indices defined as unitless radiometric measurements. The latter are calculated as ratios or differences of two or more bands in the visible (VIS), near infrared (NIR), and short-wave infrared (SWIR) wavelengths [18] [19]. The usefulness of a vegetation index is determined by its high correlation with biophysical parameters of plants. It is well known that the reflectance of light spectra from plants changes with plant type, water content within tissues, and other intrinsic factors. Therefore, we analyzed different vegetation indices to quantify and correlate the ripening of the avocados with their spectral characteristics.
One of the most widely used and implemented indices, calculated from multispectral information, is the Normalized Difference Vegetation Index (NDVI) [20]. Due to the high NIR reflectance of chlorophyll, this index is used to detect plant greenness. The NDVI is mathematically calculated as (1):
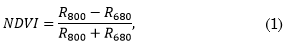
Where 𝑅800 denotes the spectral reflectance at the 800-nanometer NIR wavelength and 𝑅680 represents the 680 nm red wavelength.
A simpler vegetation index is the Ratio Vegetation Index (RVI) [21], defined as (2):
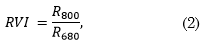
which divides the near infrared reflectance values by their visible red reflectance counterparts. The NDVI and the RVI are calculated in order to observe the transition between the red and infrared spectral bands of each avocado because, as the maturation process unfolds, the intensity of the signatures in that particular range is expected to decrease.
Besides infrared radiation to detect plant changes, the visible part of the spectrum has also been useful for early stress detection. This involves using indices focused on bands at specific wavelengths, where photosynthetic pigments are affected by water stress conditions such as chlorophyll. An example of this sort of indices is the Photochemical Reflectance Index (PRI) [22], which is given by (3):
Where 𝑅531 and 𝑅570 are the spectral reflectance values at 531 and 570 nanometers, respectively.
2.6 Colorimetry Indices and CIE Color Spaces
Spectroscopic methods, such as those presented before, could be relatively expensive and laborious, a large number of samples needs to be processed, and a significant laboratory area is required. For those reasons, state-of-the-art methods have focused on using simple RGB color cameras along with image processing [23]. In the particular case of avocados, which are usually classified by visual inspection, this work includes an analysis of RGB images.
In a colorimetry analysis, the avocado skin color was tracked in the RGB coordinate domain as well as in the CIE L*a*b* color space. The latter is used since it expresses color as three numerical values, L* for the lightness, a* for the green-red and b* for the blue-yellow color components. This color space was designed to be perceptually uniform with respect to human color vision [24] [25]. The color differences in the RGB domain were measured by simple subtraction of color indices between each day and the indices since the first day; and the L*a*b* differences were measured through the ∆E index, given by (4):
Where:
 , with
  and
and  as the color parameter values of the first maturation day, and
  , and
, and  as the color parameter values of the sample during the ripening day under analysis [26].
In addition to the colorimetry analysis, we used the Triangular Greenness Index (TGI) [27], which calculates the area of a triangle surrounding the spectral features of chlorophyll with peaks at 670 nm, 550 nm, and 480 nm, by (5):

Where 𝑅670, 𝑅480 and 𝑅550 correspond to the red, blue, and green bands, respectively.
3. DATA ANALYSIS AND RESULTS
In this section, several analyses are carried out to guide the classification of Hass Avocados in terms of their ripening, over a period of 10 days. First, a PCA-based study is conducted. Second, different spectral indices are analyzed, including the NDVI, RVI, and PRI. Finally, some colorimetry indices in the RGB and CIE L*a*b* color space are calculated and compared with the first two analyses.
3.1 PCA Analysis of the Avocados assuming Pixels as Samples
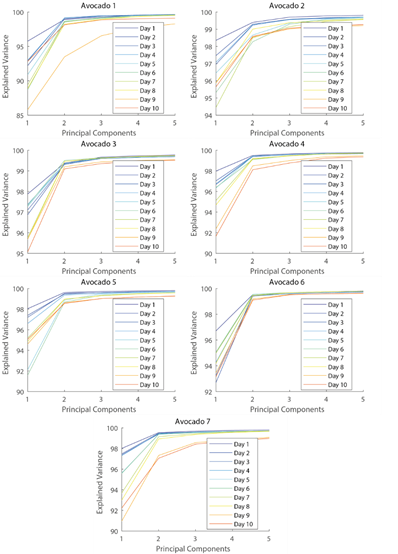
When employing PCA, first, it is critical to know the variability of the data under study. A common way to calculate this is through the explained variance plot, which shows how much variance of a data set is explained by the principal components. Fig. 6 shows the variance explained by the principal components for each avocado during the 10 days. From this figure, it can be noted that the first two principal components explain more than 95% of the avocado’s variance, regardless of the day of ripening.
Source: Authors’ own work.
Fig. 6 Cumulative explained variance, in terms of the principal components of the data, for the 7 avocados over the 10 days. Note that the first 2 principal components account for more than 95% of the data variability for all the avocados and at any given day.
Based on that observation, we analyzed the dispersion map of the avocados in terms of the first two principal components, as shown in Fig. 7. Each sub-figure shows the point cloud (540,000 pixels) of a different avocado in order to analyze its spatial distribution. Between the days 2 and 5, all the avocados exhibit a similar behavior, where the distribution of points of the principal components extends towards the positive quadrant of both axes. On day 6, avocado number five (in yellow) presents a distribution of points with a decreasing trend in the second principal component.
Source: Authors’ own work.
Fig. 7 Analysis of the distribution of the spectral signatures of the 7 avocados, assuming pixels as samples, in terms of the first two principal components. Note that, in the first days, the point clouds of all the avocados exhibit a growing distribution in both positive components. As time passes, some of them change their trend from positive to negative along the second component, providing indications of their ripening state.
On days 7 and 8, the first (blue), second (light blue), and fifth (yellow) avocados exhibited a distribution of points with a decreasing behavior. On day 9, the behavior of avocados one, two, and five did not change and, additionally, the seventh avocado (red) exhibited the same decreasing trend. Finally, on day 10, the avocados mentioned above followed the same trend, but now the fourth avocado (green) joined that decreasing tendency.
Note that, out of the 7 avocados, the third (cyan) and sixth (orange) maintained their increasing behavior until day 10. Considering those trends, it can be concluded that the decreasing behavior in the second principal component is indicative of the ripening level of avocados and, therefore, avocados 1, 2, and 5 correspond to the ripen category, since they are the first to exhibit the decreasing behavior. They are followed by avocados 7 and 4, which fall into the close-to-ripe category. Finally, avocados 3 and 6 can be classified as unripe.
3.2 PCA Analysis of Averaged Spectral Signature Samples
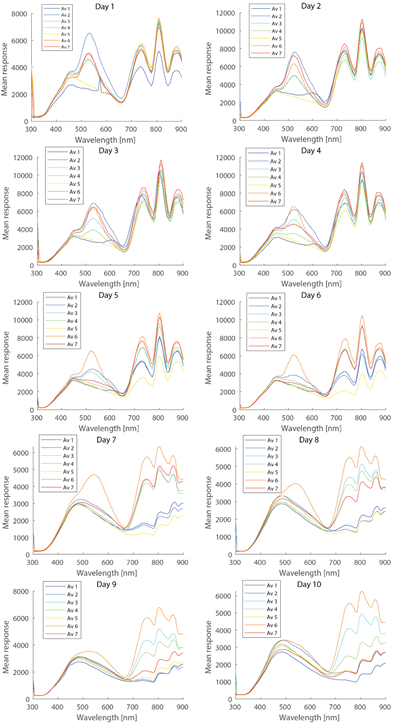
Overall, to study and analyze the average spectral signatures of each avocado, we also used the PCA method. First, in Fig. 8, we show the averaged spectral signature of each avocado throughout the 10 days. On day 1, the spectral behavior of all the avocados is similar, except for the first and fifth avocados, which exhibit a lower spectral response in the visible region (400-700 nanometers).
Source: Authors’ own work.
Fig. 8 Averaged spectral signatures of all the spatial points of each avocado, evaluating its behavior throughout the 10 days. Note: the decreasing intensity behavior in the green (around 500 nm) and NIR (around 800 nm) as days pass by.
On days 3 and 4, the spectral responses of the fourth and seventh avocados decrease in the visible region, while they remain unchanged in the region of the NIR. From day 5 to day 10, the spectral response of most avocados, except for the sixth one, is observed to constantly decrease in the visible spectral region. In contrast, the NIR region varies drastically since day 5 since different changes in the spectral response take place.
Particularly, note that, on day 6, the fifth avocado (yellow) exhibits the largest drop in the NIR. On day 7, the same decreasing trend is followed by the first and second avocados (blue and light blue, respectively). That is, avocados 1, 2, and 5 correspond to the ripe category, since they are the first to exhibit the decreasing behavior. On day 8, the mean responses of the fourth and seventh avocados (green and red) begin to decrease as well and, on day 9, their behavior completely diverges from the initial one, thus corresponding to the close-to-ripe category.
Finally, on day 10, only the third and sixth avocados exhibit a similar behavior to that displayed at the beginning, which matches the principal component analysis in Fig. 7; therefore, they correspond to the unripe category. In accordance with this analysis, it could be concluded that, as avocados start their ripening process, their spectral response in the VIS and NIR spectral region decreases, converging to a dark-green close-to-brown color, which indicates an advanced ripening state.
3.3 Classification of Hass Avocados
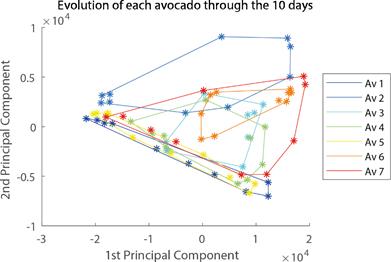
Based on the averaged spectral signatures in Fig. 8, we applied PCA to analyze the spatial dispersion of each avocado along the first two principal components, as well as their evolution over the days. This strategy seeks to classify avocados into three different categories: unripe, close-to-ripe and ripe. The results of that analysis are shown in Fig. 9, where 10 points are plotted for each avocado (each point corresponds to one day). Such points are enclosed in a neighborhood (convex hull) to establish their spatial dispersion along the first two principal components. By analyzing the shape of the neighborhoods and their overlapping, we can identify 4 representative groups. First, the group composed of avocados 1 (dark blue) and 5 (yellow).
Source: Authors’ own work.
Fig. 9 PCA applied to the averaged spectral signatures of each avocado over the 10 days. Each day under analysis is shown as an asterisk. The neighborhood (convex hull) of each avocado is also plotted to show the dispersion of each avocado along the first two principal components. Note that the distribution of the avocados exhibits a grouped behavior in three different classes.
The second group is formed by avocados 3 (cyan) and 6 (orange). The third group encompasses avocados 4 (green) and 7 (red). Finally, the fourth group is defined by avocado 2 (light blue), which slightly overlaps with the third group. Compared to the information provided by the farmer (who said that avocados 1 and 5 belong to the ripe category; 3 and 6, to the category of unripe; and 2, 4, and 7, to the close-to-ripe category), it can be observed that the exploratory method adopted through PCA provided a good methodology to track and classify Hass Avocados in the three given categories, except for avocado 2, which behaved differently but closer to the third group identified above.
Therefore, it can be determined that unripe avocados are characterized by a low spatial dispersion over the days, with a positive tendency in both principal components. The close-to-ripe avocados are characterized by a high dispersion in both principal components, but a negative one in the first component and centered around the 0 axis in the second component. Finally, ripe avocados are characterized by a small negative dispersion in the second principal component and a high negative dispersion along the first component, given their elongated behavior in one of the components.
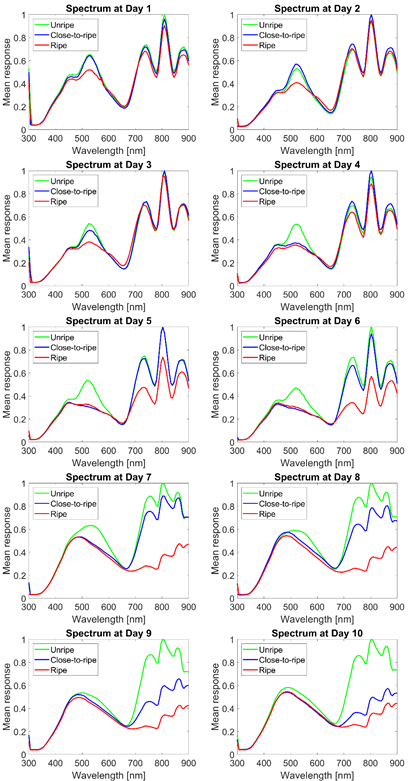
Considering the results in Fig. 9, the spectral signatures in Fig. 8 are grouped and averaged by category, and the obtained results are shown in Fig. 10.
Source: Authors’ own work.
Fig. 10 Averaged normalized spectral signature of each category (unripe, close-to-ripe and ripe) at each day over the 10 days.
In Fig. 10, it can be noticed that the spectra at day 1 are highly correlated with those in Fig. 4, and the ripe spectrum starts to be noticeable after day 6. Note that, at day 10, a clear separation of the categories is observed in the NIR spectrum.
3.4 Analysis of Spectral Vegetation Indices
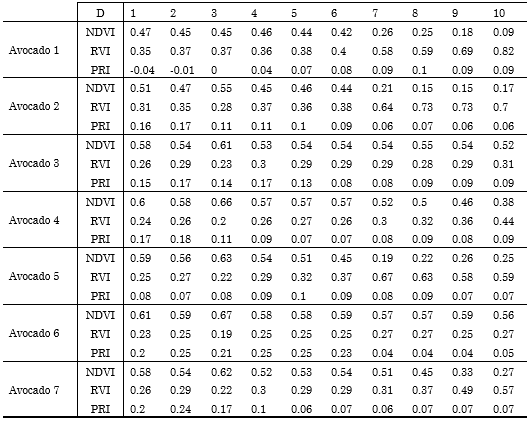
Based on the description of the spectral vegetation indices and their equations in the previous section, we calculated them for each avocado over the 10 days of the study. The obtained results are summarized in Table 2. Each column in the table represents the vegetation indices (NDVI, RVI, and PRI) of an individual avocado, and each row represents the day of the ripening process. By analyzing the NDVI vegetation index, it is observed that, as time passes, the NDVI reflectance value decreases, which is a sign of the ripening process, since the color skin of the avocado changes from bright green to close-to-brown dark green.
Table 2 Quantitative analysis of the 7 avocados by means of spectral vegetation indices: NDVI, RVI and PRI.
Source: Authors’ own work.
In particular, note that, at day 7, avocados 1, 2, and 5 reach an NDVI < 0.3, whereas avocados 7 and 4 present an NDVI = 0.3 at days 9 and 10, respectively. Furthermore, avocados 3 and 6 never exhibit an NDVI below 0.5. Therefore, an NDVI around or below 0.3 indicates a ripe state; between 0.3 and 0.5, a close-to-ripe state; and above that, an unripe state. By contrast, in the analysis of the RVI vegetation index, it is observed that the reflectance values tend to increase because the NIR reflectance value decreases as time passes. In particular, avocados 1, 2, and 5 reach an RVI > 0.5 at day 7, followed by avocados 4 and 7, which tend to 0.5 at days 9 and 10, whereas the RVI of avocados 3 and 6 remains under 0.31. Therefore, we can conclude that, in contrast to NDVI, an RVI<0.3 represents an unripe state; 0.3<RVI<0.5, a close-to-ripe state; and RVI>0.5, a ripe state.
Finally, the PRI vegetation index exhibits a behavior contrary to that of the RVI vegetation index, since the value of the reflectance in the green band tends to decrease, which is correlated with the loss of their characteristic green color. It should be noted that the PRI does not vary significantly from category to category, and a classification based on such index is not straightforward; therefore, it should not be used in further studies.
3.5 Colorimetry Analysis
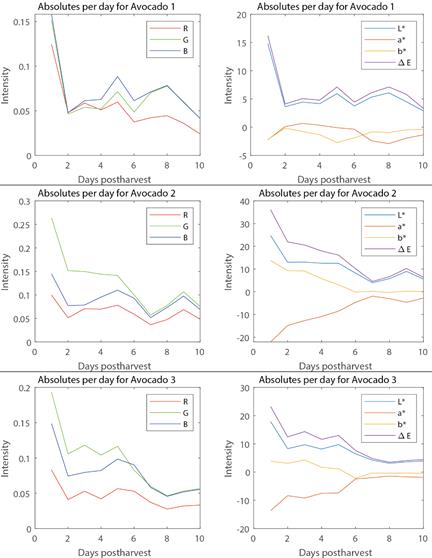
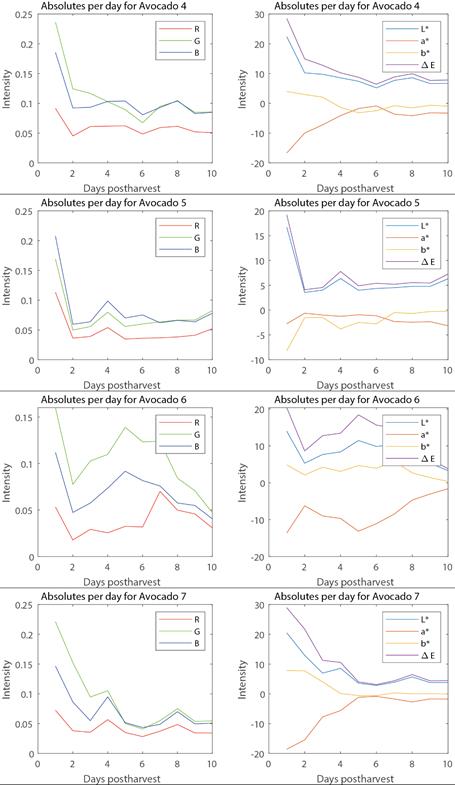
To compare our method with less precise but cheaper color imaging alternatives, we performed a colorimetry analysis of RGB-mapped representations of the hyperspectral images. To obtain the RGB images from their hyperspectral counterparts, we followed the HSI2RGB mapping suggested in [28]. The analysis of the variation of the RGB (in the first column) and L*, a*, b*, ∆E (in the second column) indices of each avocado over the 10 ripening days is shown in Fig.11a and Fig.11b, where an abrupt decrease in the RGB intensity values can be noticed as days go by. Regarding the CIE color space analysis, the L*, b*, and ∆E curves followed a similar behavior, decreasing over time, whereas the a* (green to red) value increased progressively over time.
It can be noted that the values tend to zero as days go by, being the sixth day when most avocados normalize their trend, except for avocados 3 and 6.
Source: Authors’ own work.
Fig. 11a (First column) RGB and (Second column) variation of the L*, a*, b*, and 𝛥𝐸 indices over the time for each avocado.
Source: Authors’ own work.
Fig. 11b (First column) RGB and (Second column) variation of the L*, a*, b*, and 𝛥𝐸 indices over the time for each avocado.
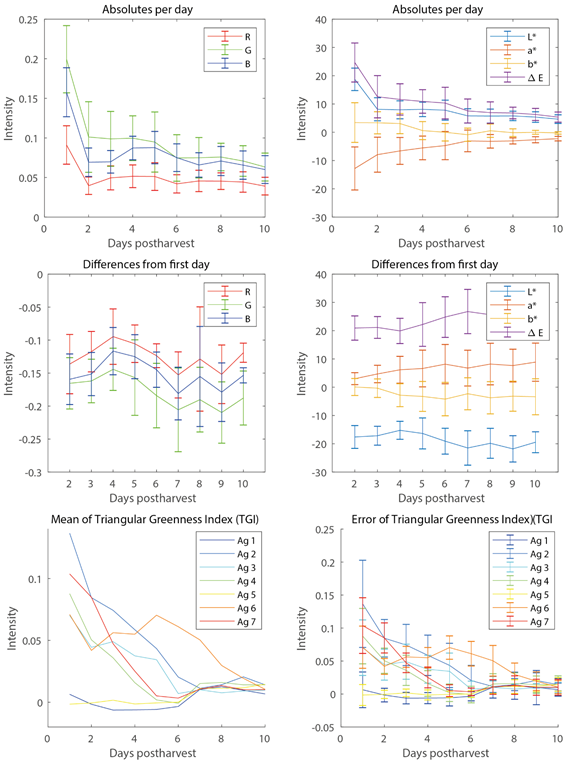
To show the variability of the indices over the time and within the samples of avocados under study, Fig. 12 presents the variation of the color indices along with their averaged value. The first row contains the averaged value of the 7 avocados during the 10 post-harvest days, together with the deviation of the absolute indices, that is, without subtracting the initial reference. It is observed (on the left) that the intensity in the 3 RGB channels decreases, with the green channel suffering the biggest attenuation. Regarding the CIE color space, a trend of intensity values towards zero can be seen (on the right), presenting a smaller variation error in the final days.
The second row of Fig. 12 shows the averaged values of the specific errors with respect to the first day (differences from first day). In RGB (on the left), a variant deviation of the three channels is observed, with day 6 exhibiting the greatest variation. Such day is considered critical for the avocado population under study because most of them undergo an advanced state of ripening by then. With respect to the CIE color space (on the right), ∆E and a* present an increasing behavior, whereas the intensity values of L* and b* decrease over time.
The third row of Fig. 12 shows the average TGI index (on the left) and the error average (on the right), which indicates that the intensity of the avocados tends to zero as days pass and the ripening state of each avocado. Note that the orange (avocado 6), cyan (avocado 3), and light blue (avocado 2) curves fall slowly, presenting a greater variation in the last days, which can be correlated with the level of ripening. Therefore, the closer the TGI value to zero, the riper the avocado.
4. CONCLUSIONS
This paper proposed the analysis of the ripening process of Hass Avocados via a non-invasive hyperspectral image system in order to classify them into three different categories: unripe, close-to-ripe, and ripe. The obtained results show that, applying PCA to the spectral signatures of the avocados, it is possible to detect ripening changes as days’ pass. Moreover, the PCA results were compared with conventional spectral and colorimetry vegetation indices, which showed high correlations with the PCA analysis. Nevertheless, the spectral analysis showed a greater precision since a higher variation could be observed and quantified along the spectral signatures in the visible and infrared electromagnetic region of the spectrum.

