


 English (pdf)
 Article in xml format
 Article references
 Send this article by e-mail
 Cited by SciELO
  Cited by Google
  Similars in
SciELO
Similars in
SciELO  Similars in Google
 Permalink
1. INTRODUCTION
It is clear that support for the agricultural sector in Colombia has not been the most appropriate over the years; government assistance for farmers is not available or often based on policies and procedures that are poorly defined or that, in many cases, depend on political interests for their approval and implementation.
For that reason, there are countless drawbacks when the harvesting and production processes are optimized. Our country has an enormous agricultural potential, but government support is very limited or nonexistent, and other factors (such as the high price of agricultural inputs and high interest rates for farm credits) end up discouraging investment in the field. Nevertheless, the rise of new technologies has enabled the improvement and automation of industrial processes in all fields of production, including coffee.
For that reason, aided by technology, an agricultural sector such as the coffee industry has the potential to take the country’s productivity to new horizons, in addition to providing countless benefits for production processes and the optimization of final products [1].
Precision Agriculture (PA) covers multiple practices related to the management of crops, trees, flowers, plants, etc. One of its most interesting applications is the control of pests and diseases [2]. By means of strategically placed sensors, parameters (such as temperature and relative humidity of the soil, temperature and humidity of the leaves, and solar radiation) can also be monitored in order to quickly detect adverse situations and establish the appropriate treatments. Another great advantage of the use of this technology is the timely detection and optimal application of pesticides only in those areas where it is really necessary [3].
One of the most significant problems that currently arise in agriculture is the constant monitoring and control of the environmental variables that affect its activities, from the sowing process to obtaining the final product. Therefore, PA enters the stage because it can be implemented in any type of crop and labor as long as there is spatial variability (i.e., usable spaces), regardless of the area where it will be carried out.
In a very general way, the specific aspects of PA can be adapted to each productive system and variables such as climate, temperature, humidity, soil type, genetic material, and management system [4].
Colombia is known for producing the best soft coffee in the world. Its production, according to reports by the National Federation of Coffee Growers (the entity that represents Colombian producers internationally), has grown by 26 % compared to 2011. That makes the Latin-American country the third largest producer of coffee beans worldwide. The Federation, along with coffee growers, has promoted aspects like the renovation of crops and sowing special and organic coffees, among other strategies, to encourage the cultivation of the grain [5].
For that reason, in this work, we propose the design, development, and subsequent implementation of a wireless sensor system applying the concept of the IoT (Internet of Things) [6], in order to establish a set of measurements, alerts, and controls to improve the production and quality of coffee crops [7].
The design and development of this sensor system offer traditional farmers an invaluable agricultural technification tool, which allows them to increase their economic benefits, reduce their environmental impact, and therefore improve their quality of life. From another viewpoint, PA tends to result in a higher quality product thanks to its well-known optimization of resources; moreover, it works as a predictive element to avoid possible crop losses due to lack of management, supervision, or timely actions.
2. MATERIALS AND METHODS
2.1 Conceptual Background
The Internet of Things continues to set the pace in many aspects, areas, and processes of scientific and technological development throughout the world. In addition, it is expected to do so, at least, over the next ten years, and, according to forecasts, billions of devices connected to the internet are expected to be monitoring and controlling various aspects of daily life [8].
Agricultural production is affected by soil, climate, and crop management components, which interact and create more than 50 factors that influence it in different ways [9]. These components present spatial and temporal variability, which, in many cases, is also reflected in the production [4]-[9].
However, with the modernization of agricultural practices, new challenges arise, mainly regarding the concept of environmental and economic sustainability of production process. In the face these new challenges, the research, extension, and innovation departments in sectors related to agriculture have responded by developing technology that can be used to develop techniques to quantify and manage the natural variability of the producing area in a different way [10].
Soil and crop characteristics vary in space (distance and depth) and time. Where A is a set of techniques aimed at optimizing the use of agricultural inputs (seeds, agrochemicals, and of the coffee corrective) based on the quantification of spatial and temporal variability of agricultural production. Such optimization is achieved with the distribution of the correct quantity of these inputs depending on the potential and the needs of each point in the managed areas [5], [10].
In another work, an instrumentation system was implemented in the greenhouse La Aldana, an agro-ecological unit at the University of Quindío, Colombia [11]. Said system measures physical variables such as temperature, relative humidity, and soil moisture. Subsequently, these data are controlled inside the greenhouse and simultaneously monitored wirelessly; then, depending on the data, the system autonomously activates a hysteresis drip control system that rationalizes the use of irrigation system water.
By means of the Internet of Things and the application of PA, this technological solution (focused on monitoring a coffee crop) offers a high level of control, through the deployment of a set of devices that collect information and transmit it for subsequent analysis and comparison with established parameters, in order to make timely decisions [12]. For that purpose, the system takes a series of variables related to the percentage of soil moisture, ambient temperature, and relative air humidity as baselines. The permanent control of these values seeks to provide an invaluable tool to minimize coffee growers’ arduous manual work of controlling and monitoring extensive coffee crops; furthermore, such variables also determine the quality of the crops that are produced [11], [12].
2.2 Research Methodology
This applied study includes hardware and software components that must be designed and tested. Therefore, a methodology should be proposed in order to follow the scientific method and integrate and develop electronic devices and their interaction with a software application, which will be available on the internet in the future. The methodological phases of can be visualized in Fig. 1.
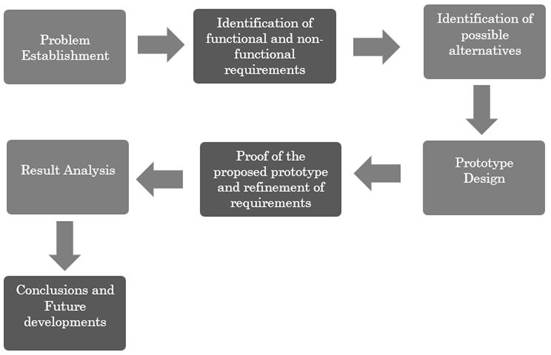
Definition of the problem: In this stage, the study is conducted under ideal climatic conditions that allow the cultivation of the best coffee in Colombia.
-Identification of functional and non-functional needs and requirements: In this stage, the hardware and software requirements that should be met to create the wireless sensor network are identified.
-Identification of possible alternatives: Other electronic devices that allow the creation of mesh-type open networks are verified and an optimal solution is selected.
-Prototype design: In this stage, the system is designed for a coffee crop of one hectare, where the nodes that connect the sensors are located.
-Proof of the proposed prototype and refinement of requirements.
-Results analysis.
-Conclusions and proposal for future work.
Significant technological advances, with many useful applications. Therefore, the purpose of this article is to explain the design of a remote system that uses a wireless sensor network and applies PA in order to monitor and control, in real time.
2.3 Introduction to wireless sensor
A Wireless Sensor Network (WSN) consists of autonomous, spaced, distributed devices that use sensors to monitor physical or environmental conditions. A WSN system incorporates a gateway, which provides wireless connectivity as a complement to the wired networks and distributed nodes. The selection of the wireless protocol depends on the requirements of the application. Some of the available standards include 2.4 GHz radios based on IEEE 802.15.4 or IEEE 802.11 (Wi-Fi) standards or proprietary radios, which are regularly designed for 900 MHz [13]. In the last decade, WSNs have become perhaps one of the most order to monitor and control in real time, the parameters of environmental interest, yield and production quality of a coffee crop [14].
2.4 Components of a wireless sensor network
According to [15], the components or elements of a wireless sensor network are:
Sensors: These devices are responsible for taking the information from their environment and converting it into electrical signals that are delivered to a control system. Eventually, they can be of any type and measure any type of variable (light, temperature, wind, pressure, and humidity, among others).
Actuators: These devices, following the orders of the control system, perform a series of actions that affect or have an impact on the real world (e.g., opening a valve, closing a membrane, lighting a bulb).
Sensor nodes: They receive the data collected by the sensor through their data ports and send the information to the base station. Sensor nodes must have a low power processor, as well as a radio transceiver with the same feature; for that purpose, optimized software must be added, which requires some resources, making the power consumption even more restrictive.
Intermediate nodes: These devices are in charge of extending the reach of the network, circumventing obstacles to wireless transmission and providing alternative routes for the transit of the messages that are sent to the gateway.
Gateway: This is a key device in the system because it serves as an interface between the application platform and the nodes that make up the network. It also allows the connection between the system and the environments because it handles different types of protocols and can operate in the upper layers of the OSI model (transport, presentation, application, and session), thus enabling the conversion of protocols to interconnect networks with different high-level protocols.
Wireless network: A medium for transmitting information, typically based on the 802.15.4 standard (ZigBee).
Base station: It is responsible for connecting and coordinating intermediate nodes in order to collect data from the network; it is usually made up of a PC or an embedded visualization system.
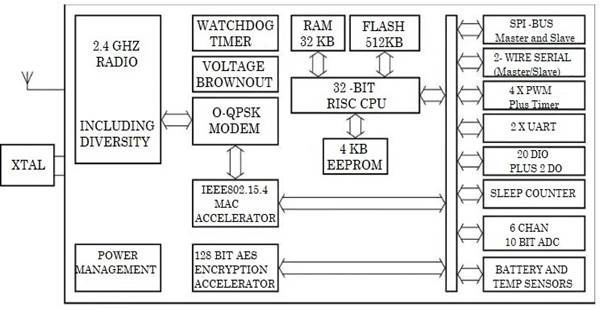
The architecture of a sensor node, according to the IEEE 802.14 Standard, can be visualized in Fig. 2.
2.5 ZigBee protocol
The ZigBee Alliance was formed by an association of industries that work together to develop standards and products. ZigBee is the name of the specification of a set of high-level wireless communication protocols designed for low-power digital broadcasting applications based on the IEEE 802.15.4 standard for wireless personal area networks (Wireless Personal Area Network, WPAN) operating at 868 MHz, 915 MHz, and 2.4 GHz. ZigBee technology is integrated into a wide range of products and applications for commercial, industrial, and government consumers [10], [15].
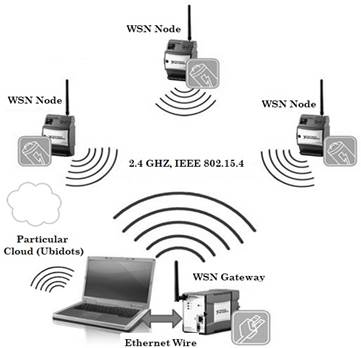
In the Fig. 3, we can visualize the connectivity between the gateway, the sensor nodes and the online platform in charge of receiving the data.
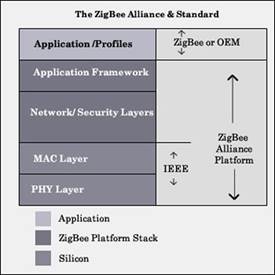
The objective of this technology is not to attain very high transmission speeds (it can only reach a rate of 20 to 250 Kbps in a range of 10 to 75 meters), but to implement sensors whose transceivers offer very low power consumption. In fact, some devices can operate for 2 years powered by the same two AA batteries. Therefore, ZigBee devices spend most of their time in a stand by state, that is, sleeping to consume much less power [18]. Fig. 4 presents the protocol stack of the ZigBee standard.
In order to select a technology to transmit information in wireless networks, many aspects should be considered, such as transmission rates, costs, distances between nodes, and maintaining the battery charge of the devices outdoors. The ZigBee standard was selected for the following technical characteristics; thanks to which it stands out over other alternatives:
-Low consumption that enables the use of conventional alkaline batteries [15], [18].
-Low device, installation, and maintenance costs.
-High performance and low latency for low duty cycle devices work, very suitable for sensors and controls.
-Easy integration with other technologies and standards [18].
2.6 Topologies of wireless networks
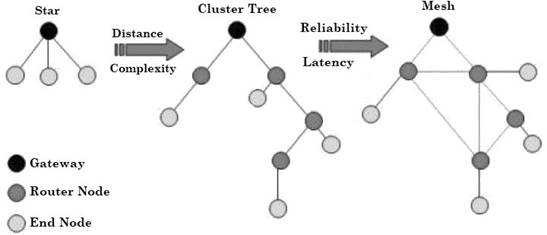
The word “topology” can describe two aspects of wireless networks: on the one hand, at the physical level, how the different hardware-level devices that make up the WSN network are distributed; and, on the other hand, at the logical level, how the data is transmitted throughout the network. That is why it is so important to define the physical and logical topologies according to the solution to be implemented.
In addition to the classical mesh of WSNs, two other topologies can be adopted: In star networks, each wireless node directly communicates with a gateway device that acts as a communication bridge with a wired network. In cluster trees (an emerging and common intermediate solution in WSNs), the routers communicate with the gateway; the sensors only need to establish the point-to-point communication with the routers and, therefore, they can remain simple and low- power while improving the range and redundancy of the network itself [20].
The IEEE 802.15.4 standard defines two types of devices: Full Function Devices (FFDs) and Reduced Function Devices (RFDs). FFDs contain the complete set of MAC services and can operate as a PAN (Personal Area Network) coordinator or as a simple network device. In turn, RFDs contain a small set of MAC services and can operate only as a network device [5], [20].
Said standard assumes the use of star, cluster tree, and point-to-point topologies, and it provides the structure for programming in the application layer. Its objective is to support the development of applications for wireless networks that require secure and stable communications with low data rates and reduced energy consumption [17].
In Fig. 5 the star topology consumes the least energy, but it has limitations such as the radio transmission distance between each sensor node and the gateway. Moreover, it does not offer an alternative communication path in case one of the sensor nodes has obstructed the communication path, which would lead to the loss of the information of that node. In said topology, all the sensor nodes are identical and the gateway is in charge of capturing the information or sending data between them. The gateway is also used to transmit data outside the network and monitor the network [3], [20].
3. PROPOSED ARCHITECTURE FOR THE SENSOR NETWORK
Fig. 5. shows the proposed architecture for the sensor network that will allow the control and monitoring of a coffee crop. For that purpose, a plot of less than 1 hectare was defined as the cultivated land, located on Santa Ana Farm in Pueblo Tapao, Department of Quindío, Colombia.
The sensor nodes are responsible for monitoring environmental variables such as soil temperature and humidity, ambient temperature, and rainfall index, precipitation level using a rainfall meter [21].
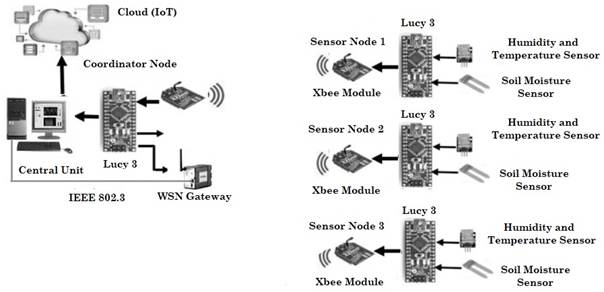
A gateway can also be seen in Fig. 5. Its role is to send the information collected by the sensor nodes to the coordinator node responsible for establishing the communication with the central unit, which is composed of a computer with internet connection that uploads the received information to a cloud storage site for processing and further analysis.
3.1 Components of the proposed sensor network
The network proposed in this work includes multiple sensor nodes, whose objective is, basically, to be data acquisition units responsible for collecting data about environmental variables, such as ambient temperature, relative humidity, soil moisture, and atmospheric pressure, the components of the sensor network and its connectivity can be visualized in Fig. 6. The measurements of the variables are transmitted to the coordinator node through Xbee devices that work with the Zigbee wireless telecommunication protocol. One of the nodes is located in a range of 100 meters.
The sensor nodes are located 100 meters from each other. Each sensor node is composed of a Lucy 3 Colmakers programmable card (see Fig. 7) with the following technical specifications:
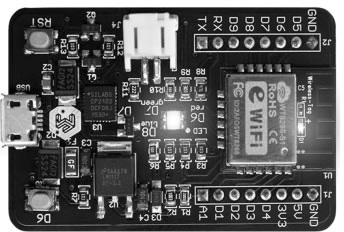
Input power: From 5V DC - 9V DC to 100 mA. Consumption under normal operation: 0.5 Watts. Output power: Between 4.3 VDC - 8.3 VDC 1.5 A (protected), 3.3 VDC - 700 mA. Operating temperature: -20-70 °C. Communication protocol: TCP / IP (WIFI). Digital outputs: 9 (D1, D9). Outputs with interruptions: 8 (D2, D3, D4, D5, D6, D7, D8, D9). Outputs with pwm: 9 (D1, D2, D3, D4, D5, D6, D7, D8, D9). Digital inputs: 6 (D1, D5, D9). Analog inputs: 1 (A1) Ports for I2 C: 2 (D4: SCL, D5: SDA). Xbee module for data transmission and communication with the gateway, humidity and temperature sensor, and a sensor for soil moisture measurements [23].
-Coordinating node or gateway: It collects the data from each sensor node to process them and send them to a computer via USB cable. Among other functions, it is also responsible for controlling the network and the paths that devices must follow to connect with each other. Its main technical specifications are the following:
Protocols: UDP / TCP, DHCP, LEDs: Power, Network (LAN / WAN), ZigBee (HAN / PAN), Worldwide version: XBee® ZB SMT transmit power: 6.3 mW (+8 dBm); Receiver sensitivity (1 % PER) -102 dBm, North American version: XBee®-PRO ZB SMT transmit power: 63 mW (+18 dBm); Receiver sensitivity (1 % PER) -102 dBm, Memory (User-available memory varies by firmware and OS version): 64 MB RAM, 128 MB Flash, Ethernet: Ports: 1 RJ-45 port, Physical Layer: 10 / 100 Base T, Data Rate: 10/100 Mbps (auto-sensing), Mode: Full or half duplex (auto-sensing), Power Input: 5 VDC, Power Supply: 5 VDC power supply with barrel connector included, Power Consumption: Typical: 1.2 W, Max: 2.5 W, Environmental: Operating Temperature: 0 °C to 40 °C (32 °F to 104 °F). Relative Humidity: 5 % to 95 % (non-condensing). Ether Isolation: 500 VAC min per IEEE802.3 / ANSI X3.263 [17].
-XBee-Pro S2C modules: These low-cost modules enable wireless connections between electronic devices. They work with a frequency of 2.4 GHz and can be used to create point-to-point, point-to-multipoint, broadcast, and mesh networks. In this new generation of XBee-Pro S2 C Series, SPI (Serial Interface Interface) communication is incorporated to provide high-speed data exchange between devices, optimizing the connection with microcontrollers. This model of the XBee-Pro S2 C works in a range of 90 meters indoors and up to 3200 meters outdoors in the line of sight and under the best conditions. Its main technical characteristics are the following:
Number of pins: A set of 15 I/O pins, 4 of which can be used as analog 10-bit inputs. Input power: Low current consumption (1 uA in sleep mode), Working frequency: 2.4 GHz, data rate (max): 250,000 b / s, range: Up to 3200 meters, sensitivity: -101 dBm, source voltage: 2.7 V ~ 3.6 V, current - Reception: 31 mA, current - Transmission: 120 mA, communication interface: SPI, UART, memory capacity: 32 kB Flash, 2 kB RAM [17].
-TEGR-101 soil moisture sensor: This sensor is designed for measuring the moisture of loose soil, clay, silt, etc. It is ideal for applications such as irrigation systems, moisture measurement in crops, and automatic control. Its specifications are listed below:
Input power: 3.3 VDC - 5.5 VDC 10 mA, normal operation consumption: 0.055 W, output type: analog, sampling period: simultaneous.
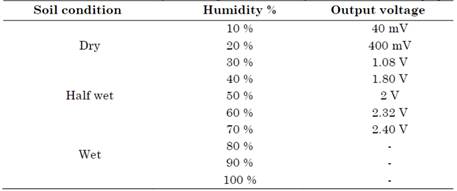
The moisture sensor sends an analog signal proportional to the percentage of humidity present in the soil where the measurement is obtained. Such analog signal ranges between 0 V and 2.4 V, where 0 V means that the soil is dry or its humidity percentage lies between 0 % and 5 %, and 2.4 V represents a humidity percentage from 70 % to 100 % [24].
-TEHU-120 temperature and humidity sensor: This sensor is designed for measuring relative humidity and relative air temperature (Relative humidity -> Range of 20 % to 90 %, Relative temperature -> Range from 0 °C to 50 °C). It is ideal for applications such as weather stations, humidity measurement, and automatic control temperature, etc. [25].
We can observe the ranges od humidity or dryness of the terrain that can be monitored by the Lucy 3 programmable card in Table 1.
Specifications: Input power: 3.3 VDC - 5.5 VDC 0.3 Ma, normal operation consumption: 0.00165 W, output type: digital, sampling period: more than 2 seconds.
The sensor performs the measurement according to a series of pulse trains sent by the device. When the sensor is turned on, it is automatically set to high for subsequent synchronization between the sensor and the Lucy card. Once this synchronization is complete, the sensor sends 40 data, which are distributed into 5 bits. The first two bits contain the value of relative humidity. The third and fourth bits contain the value of relative humidity. And the fifth bit is called the parity bit, which is responsible for performing the calculation of humidity and relative temperature based on the 4 bits previously described. The data is transmitted by serial communication, which allows the use of a single-pin connection, thus avoiding electromagnetic interference [25].
-Base station: Constituted by a laptop PC with an Intel® Core I5 processor and 4 GB of RAM for information processing, it is used for data cloud storage and processing. The data of the variables are stored and monitored using Ubidots, which is a cloud service that allows users to store sensor data and visualize them in real time through a web page. Ubidots provides an API key to each user that is used as an authentication identifier when the sensor data are transmitted to the cloud. This platform allows users to store up to 30,000 dots per month for free [26].
3.2 User Interface
The data from each sensor node are analyzed and displayed in a graphic environment hosted in the cloud that users can access anywhere. The idea is to show alerts or warnings when some parameter is measured outside normal values.
3.3 Ubidot IoT Cloud Platform
Ubidots is a IoT Platform designed to empower you to prototype and scale your IoT projects to production, whilst improving and economizing the world around us with sensor data. They employ a friendly, customizable Application Enablement Platform that provides users with real-time data and visualization of sensor inputs using a secure cloud [26]. You can see the data reading of several sensors through the Ubidots Platform in Fig. 8.
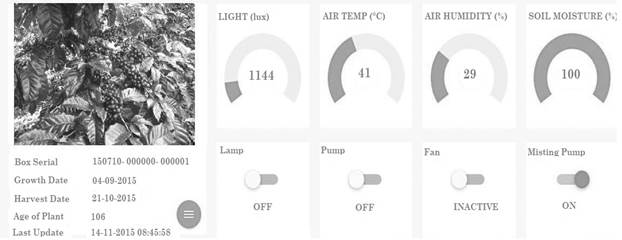
Source: [26].
Fig. 8 Measurement of environmental variables in a coffee crop on the Ubidots platform
4. COFEE AND ITS ENVIRONMENTAL VARIABLES
In this section, we discuss a series of environmental variables that, in one way or another, affect coffee planting and cultivation. Such variables are analyzed in order to obtain essential information through the sensor network, the object of study of the present work.
4.1 Temperature
The optimal temperature for Arabic coffee cultivation is between 19 and 21.5 ºC.
In cold climates, where the average temperature is less than 19 ºC, coffee varieties develop less, their production is lower, and the harvest is distributed throughout the year.
In hot climates, where the average temperature is higher than 21.5 ºC, the productive life of coffee trees is shorter, the harvest can be reaped earlier and is more concentrated, the attack of rust is more severe, and pests such as the coffee berry borer and leaf miner increase.
Air humidity or relative humidity.
This component of the climate presents high variations between day and night. In coffee growing areas, the air is usually humid [27].
4.2 Winds
They are responsible for transporting water vapor and clouds, changing some components of the climate such as rainfall, temperature, and solar radiation.
In general, the most suitable areas for coffee cultivation are characterized by weak winds.
4.3 Rains
Between 1,800 and 2,800 millimeters of rain per year, well distributed among the 12 months, are considered appropriate for coffee cultivation. At least 120 millimeters per month are required.
Periods of abundant rain favor the presence of diseases such as pink and leaky.
Excess rains can also affect the flowering of the coffee plantation, diminishing it or damaging it.
Droughts can cause the leaves of the coffee tree to fall off, due to lack of water, and the attack of pests (such as the red spider mite, the leaf miner, and the coffee berry borer) to increase [28].
In the Colombian “coffee-producing region”, the crop is harvested most of the year thanks to its particular distribution of rainy cycles, unlike in other regions and countries where there is a single concentrated harvest cycle.
This rainfall regime is the result of the passage, twice a year, of the Intertropical Convergence Zone (ITCZ), which is located on the equator, where the trade winds from the Northern and Southern hemispheres converge. This phenomenon generates two periods of intense rains (from March to May and from October to December) that benefit the entire coffee production cycle [9]-[28].
4.4 Soil for cultivation
The soil is essential for coffee trees because it provides the support, water, and nutrients they need for their growth, development, and production.
It is produced by the disintegration and slow decomposition of rocks, mainly caused by the action of water, temperature, and winds. In some regions, these processes are accompanied by ash from volcanoes. With the passage of time, the resulting particles are mixed with the decomposing residues of animals and plants, thus creating the humus.
The soil is composed of solid (organic and inorganic) substances, water, and air [28].
5. RESULTS AND DISCUSSION
Distance tests were conducted to determine the maximum range of the Xbee-Pro S2 C wireless modules in order to ensure reliable data transmission without signal losses or attenuation; their maximum range was found to be 100 meters in outdoors.
Established that coffee cultivation management is quite complex, taking into account the variability of species, terrains, and specific environmental conditions that ultimately affect the production process and final grain quality [16], [29].
It was determined that the development and implementation of wireless sensor networks are now more feasible due to the low costs of sensors, programmable cards, and communication modules, as well as open-source hardware and software which do not require users to pay for licenses [5], [16]. All those factors make WSNs profitable for coffee growers.
In this study, the incidence of environmental variables on the cultivation and production of the grain was determined by establishing how they affect the final quality of the crop.
It was established that, through the Ubidots platform, information is uploaded to the cloud, allowing users to access this information from any device that has an internet connection and can graphically visualize the behavior of variables and alert signals in case of parameters are found outside normal ranges [16]-[26].
It was determined that the application of the IoT to PA is an excellent tool for monitoring and controlling environmental variables, allowing the introduction of technology into agriculture and, more specifically, into coffee cultivation.
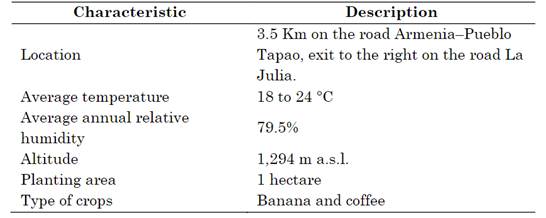
The WSN proposed here will be implemented on Santa Ana Farm, in Pueblo Tapao, which is located 15 Km from the city of Armenia, the capital of the Department of Quindío, Colombia. The main characteristics of the farm can be seen in Table 2.
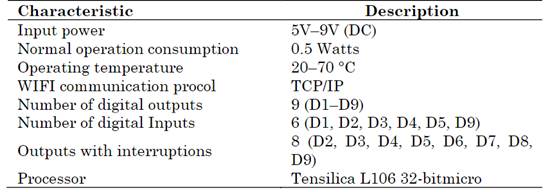
Additionally, the Lucy 3 programmable cards in each sensor node are programmed to receive the values sent by each of the sensors, process said data, and send them to the monitoring center, where the measured values will be analyzed. It will also be determined if the values lie within the programmed ranges, in order to be able to trigger the alert system in case they exceed their specific allowed ranges. The technical specifications of the internal components of the programmable cards are described below [16], [23].
Table 3, shows the technical specifications of the Lucy 3 programmable card in more detail.
6. CONCLUSIONS
We described the topologies and components of wireless sensor networks and proposed their use in various crops in Colombia. Based on the parameters analyzed here, we could established that one of the main problems in coffee crops is intense humidity, which, in the practice, affects the performance of the sensors and their measurements. This is reflected in the fact that the intensity of the signal received from the Zigbee devices fluctuated more than in sites with dry climatic conditions.
There is evidence of coffee growers’ little knowledge of technology and its applications in agriculture, due in part to their lack of education and their heritage of traditional methods for growing and producing coffee. Among the fundamental factors that affect coffee crops, soil quality was found to be one of the most important because on it depends the growth speed and development of the trees; the start, quantity, and quality of the production; the crop’s resistance to the attack of pests and diseases; and the duration of the trees’ productive life.
Zigbee technology was proposed for this project due to its low cost compared to other wireless technologies with similar characteristics.
This study was a first approach to how to establish warning signals according to estimated parameters, since the measuring ranges of the environmental variables are determined by the agronomist who assists the crop. Unfortunately, the tests and implementation of all the estimated sensorization for the project were not completed.

