


 English (pdf)
 Article in xml format
 Article references
 Send this article by e-mail
 Cited by SciELO
  Cited by Google
  Similars in
SciELO
Similars in
SciELO  Similars in Google
 Permalink
1. INTRODUCTION
Parkinson’s Disease (PD) is a progressive neurodegenerative condition that affects approximately 2 % of the population over 65 years old [1].
Individuals with PD usually present motor deficits, such as tremor, rigidity, akinesia, bradykinesia, and postural instability. Additionally, more than 90 % of said patients develop several speech deficits such as reduced sonority, monotonicity, imprecise articulation, and abnormal prosody [2], [3], [4]. Most speech studies with PD patients evaluate sustained vowel phonations because it is one of the easiest tasks compared with monologues or reading long texts, and provides valuable information about phonation and articulation dimensions of speech production [5].
Several studies have found articulation deficits in PD patients using sustained vowel phonations and continuous speech recordings. For instance, in [6], the authors evaluated the characteristics of the articulation of vowels pronounced by 35 native Czech speakers (20 with PD and 15 HC) while performing continuous speech tasks. According to their results, impaired vowel articulation may be considered a possible early biomarker of PD. They stressed the fact that vowel articulation problems may be evaluated in continuous speech signals to obtain accurate models of speech impairments in PD patients. They also reported classification accuracies of up to 80 % in the automatic discrimination between PD and HC subjects.
Other studies have considered articulatory acoustic features extracted from vowels. In [7], the authors considered speech recordings of 68 PD patients and 32 HC (native German speakers). The first two formant frequencies (F1 and F2) were extracted from the vowels /a/, /i/, and /u/, which were segmented from continuous speech recordings. An articulatory acoustic analysis was performed using the Triangular Vowel Space Area (tVSA) and the Vowel Articulation Index (VAI). Said authors reported VAI values significantly reduced in male and female PD patients compared to the HC group. tVSA was only reduced in male PD patients.
Therefore, they concluded that VAI seemed to be more efficient than tVSA to identify articulation deficits of PD patients. These measurements have also been considered in recent studies that asses the automatic evaluation of articulation deficits of PD patients observed in sustained vowels and continuous speech signals [8].
Although the conclusions and observations in the literature are well motivated and supported on strong arguments, it is important to note that most studies in the field have considered classical sustained vowels and continuous speech signals, but not other specific tasks like the production of modulated vowels (i.e., changing the tone from low to high and from high to low). We think that this kind of tasks could be more accurate and robust than classical ones to observe specific speech deficits in PD patients because they are easy to perform and allow the measurement of frequency variations in the voice. For instance, modulated vowels were considered in [5], where recordings of 50 patients with PD and 50 HC subjects (all of them Colombian Spanish native speakers) were discriminated. The feature set included the classical vocal formants and the fundamental frequency extracted using the Hilbert-Huang Transform (HHT).
The automatic discrimination of PD vs. HC speakers was performed implementing a decision tree classifier. The classification experiments were conducted considering male and female speakers separately. The accuracies obtained with the classical sustained phonations were around 82 % and 90 %, respectively; when the modulated vowels were included, the results improved to 84 %.
The analysis provided by the HHT has been used in multiple papers. For example, HHT was used for a geophysical study about the propagation of seismic waves [9].
They concluded that certain Intrinsic Mode Functions (IMFs), those with a higher frequency, could be identified as generated near the hypocenter, while the high frequency content was related to a large tension drop associated with the onset of seismic events. In [10], they used the HHT to study financial time series and as a tool for the statistical analysis of nonlinear and non-stationary data. They obtained space time-frequency decompositions and temporal decompositions of the data.
In [5], the HHT was implemented to compute the instantaneous energy and its range, as well as the instantaneous frequency and the difference between the maximum and minimum values of the IMFs amplitude. In turn, in this study, we used the Hilbert-Huang transform to extract the first and second IMF, which encode information about the temporal variation of the vocal formants (F1 and F2). We extracted features from such IMFs as described in Section 2.3.
In this paper, we introduce the use of HHT for a robust modeling of the frequency bands where the first two vocal formants are located because these two are the main determinants of which vowel is heard, and, in general, they are responsible for the differences in quality between different periodic sounds.
The modeling was based on the extraction of the IMFs that result from the Empirical Mode Decomposition (EMD).
Such frequency bands around the formants were modeled along with their energy content, their first and second derivatives, the instantaneous frequency, their Teager Energy operator (TEO) value, and their entropy. Besides these features, the classical Mel-Frequency Cepstral Coefficients (MFCCs) were considered.
This study aims to contribute with a novel, original, and robust alternative to model articulatory deficits exhibited by PD patients. The experiments employed recordings of the vowels /a/, /i/, and /u/ pronounced in a modulated tone. The same set of recordings of [5] was considered in this study to evaluate the capability of the proposed approach to discriminate between PD and HC speakers and evaluate the severity of their dysarthria.
This paper is organized as follows: Section 2 describes the database, the methodology, the way the features were extracted, and the implemented algorithms. Section 3 details the experiments and discusses their results.
Finally, Section 4 presents the conclusions and future work.
2. MATERIALS AND METHODS
2.1 Participants
Recordings of the corpus PC-GITA were considered here. A total of 100 participants were included, 50 with PD and 50 HC [11].
All the participants were Colombian Spanish native speakers. Their clinical and demographic information is provided in (Table 1). The recordings were captured with a sampling frequency of 44.1 KHz and a 16-bit resolution.
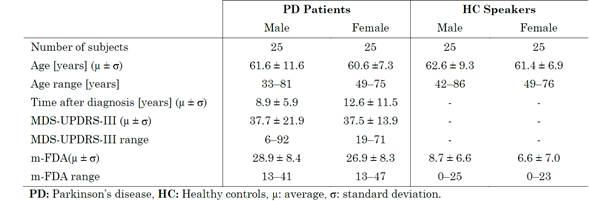
The participants were asked to pronounce sustained modulated vowels (/a/, /i/, and /u/) during one single breath. All the patients were evaluated by an expert neurologist according to the Movement Disorder Society-Unified Parkinson’s Disease. Rating Scale (MDS-UPDRS) [12].
Additionally, with the aim of obtaining a label for the dysarthria level of the participants, all the recordings were evaluated by three phoniatricians according to the modified version of the Frenchay Dysarthria Assessment tool (m-FDA). Further information about the procedure and the scale can be found in [13].
2.2 Methodology
The methodology followed in this study is shown in (Fig. 1.) The procedure begins with the pre-processing of the audio file, which consists of eliminating the DC level of the signal and normalizing the amplitude. The second step is the feature extraction, followed by the classification, which, in this case, is performed using a Support Vector Machine (SVM).
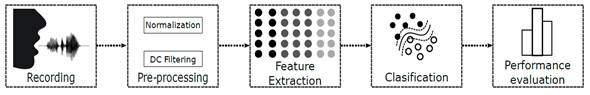
The performance of the system is evaluated using different statistics including accuracy (Acc), sensitivity (Sens), specificity (Spec), receiver Operating Characteristic Curve (ROC), and the Area Under the ROC Curve (AUC). Further details about each step are provided below.
2.3 Feature Extraction
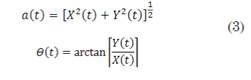
Hilbert-Huang Transform: For an arbitrary time series, X(t), it is always possible to calculate its Hilbert transform, Y(t), as (1):
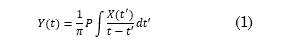
where, P indicates the principal value of the Cauchy integral, and t and t' are two different time instants. With this definition, X(t) and Y(t) form a complex conjugate pair. Hence, it is possible to obtain the following analytic signal, Z(t) (2):
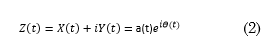
such that
Note that (1) defines the Hilbert Transform as the convolution between 𝑋 𝑡 and 1/𝑡. Therefore, it emphasizes the local properties of 𝑋 𝑡 , although the transformation is global. In (2), the expression of polar coordinates further clarifies the local nature of this representation, which shows the local adjustment of a trigonometric function that varies in amplitude and phase to 𝑋 𝑡 (3).
One of the advantages of the Hilbert transform became popular after Huang et.al. in [14], where the EMD method and the use of HT were introduced. EMD is necessary to pre-process the data before applying the HT. EMD also reduces the data to a collection of IMFs, which are defined as functions that satisfy the following conditions: (i) the number of extremes and zero crossings are the same or differ by a maximum of one over all the data, and (ii) the average value of the envelope defined by the local maxima and the envelope defined by the local minima is zero at any point. EMD decomposes an arbitrary and time-varying signal into IMFs that are modulated in amplitude and frequency [5].
Those IMFs represent the frequencies that are present in the signal, and the sum of those functions reconstructs the original signal.
In speech, the resonant frequencies of the vocal tract are called formants. The most informative formants are the first two, F1 and F2. According to [15], the information of F1 and F2 per vowel is located around the following frequency bands: /a/, between 600 Hz and 1700 Hz; /i/, between 200 Hz and 2600 Hz; and /u/, between 200 Hz and 1100 Hz. Given the capability of IMFs to separate relevant information in different frequency bands, in this study, we take the original band-pass filtered signals and extract their corresponding IMFs to automatically model information of F1 and F2. Note that only one band-pass filter is used per signal, which reduces the risk of introducing alias frequencies or the problem of leakage.
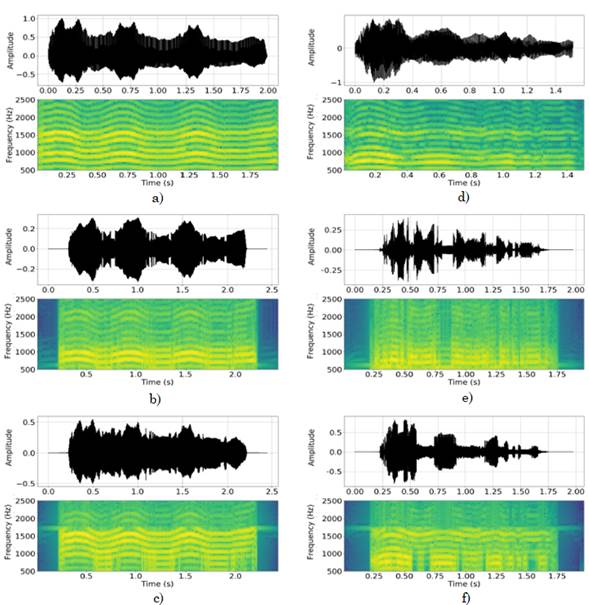
(Fig. 2.) shows the wave forms of the vowel /a/ produced with a modulated tone by a 63-year-old healthy control female (left) and by a 55-year-old female PD patient (right). The patient was diagnosed 12 years ago and the label of her MDS-UPDRS score is 43. The spectrograms of the original signals show the modulation of their frequency content.
(Fig. 2B), (Fig. 2C), (Fig. 2E), and (Fig. 2F) show the IMF signals and their corresponding spectrograms after applying the filtering around the frequencies of the vocal formants. The first IMF allows the modeling of the first formant (Fig. 2B and Fig. 2E), while the second formant is modeled by the second IMF (Fig. 2C and Fig. 2F). Note that the first two IMFs obtained from the patient (Fig. 2E and Fig. 2F) are jumpier, which indicates the possible presence of vocal tremor, which is one of the most common behaviors in PD patients and is typically linked to the difficulty of patients to produce stable vowel phonations.
Source: Created by the authors.
Fig. 2 Waveforms of modulated vowel /a/ and their corresponding spectrogram. (a) Original audio signal of a 63-year-old female HC, (b) first IMF of the HC signal, (c) second IMF of the HC signal, (d) original audio signal of a 55-year-old female PD patient with 43 points in the MDS-UPDRS-III scale and 12 years after diagnosis, (e) first IMF of the PD signal, (f) second IMF of the PD signal.
Considering that the HHT provides a high resolution in the frequency domain (especially in low-frequency bands), which is even better than that of the Fourier transform and the Wavelet transform [14], this method is useful when more detailed information of the modulated vowels is required.
Several characteristics of the 2 extracted IMFs are measured: energy content, first and second derivatives, instantaneous frequency computed in windows of 20 ms with a step size of 10 ms, Teager energy operator (TEO), and entropy (also considered for the audio signal).
Mean value, standard deviation, skewness, and kurtosis are calculated per measurement to create a 32-dimensional feature vector per speaker.
Mel-Frequency Cepstral Coefficients (MFCCs): MFCCs are very common in speech processing due to their robustness and suitability for several applications such as speech recognition, speaker verification, and speaker identification. They are based on the critical band model of sound perception, which is emulated by a filter bank with band spacing and bandwidth similar to the critical bands given by the Mel scale. The conversion from Hertz to Mels is shown in (4).
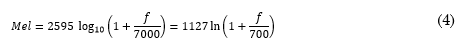
As MFCCs are based on human perception, they have been successfully used to model articulation in PD [16]. The steps to calculate MFCCs are the following: 1) a short-term segment of the signal is extracted, 2) a window (e.g., Hamming) is applied upon the segment, 3) Fourier analysis is performed by the Discrete Fourier Transform, 4) a triangular filter bank is applied to the DFT to estimate the Mel Energy spectrum, 5) the natural logarithm of Mel’s energy spectrum is calculated, and 6) the discrete cosine transform (DCT) is calculated to obtain the MFCC [17].
In this study, we are considering only the first 13 MFCCs as well as their first and second derivatives. From coefficient 14 onwards, the information about the phenomenon under analysis (human voice) is irrelevant. The coefficients are extracted from 30-ms-long frames (approximately statistically stationary signals), with an overlap of 10 ms. Similar to the model of the IMFs, mean value, standard deviation, skewness, and kurtosis are calculated to create a 156-dimensional feature vector per speaker.
2.4 Feature Selection
Given that the number of extracted features is relatively high, we want to evaluate whether a lower dimensional representation is more suitable to perform the automatic classification of PD patients and HC subjects. The representation space can be reduced via dimensionality reduction strategies such as those based on Principal Component Analysis or Linear Discriminant Analysis, or via feature selection. In this work, we decided to evaluate the suitability of the second one.
Particularly, we applied Kruskal-Wallis tests to evaluate the null hypothesis of a group with n independent samples that come from the same population or from identical populations with the same median.
To determine whether any of the differences between the medians is statistically significant, the p value is compared with the level of significance to evaluate the null hypothesis. The null hypothesis indicates that the population averages are all the same. In general, a level of significance (namely α) of 0.05 works properly. α = 0.05 indicates a 5 % risk of concluding that there is a difference when there is no real difference between the two medians. When p ≤ α, the null hypothesis is rejected, and it is concluded that not all the population medians are equal. In turn, when p ≥ α, there is not enough evidence to reject the null hypothesis that the population medians are all equal. A level of significance α = 0.05 was established in our experiments to exclude redundant features that do not provide relevant information for the discrimination between classes.
2.5 Automatic classification
To differentiate between patients and healthy speakers, an SVM with Gaussian kernel was considered. Parameters C and ɣ were optimized through a grid search up to powers of ten with C ∈ {0.001, 0.01, …, 1000, 10000} and ɣ ∈ {0.0001, 0.001, …, 100, 1000}. A speaker independent 10-fold Cross-Validation (CV) strategy was implemented in the training process, i.e., the data were divided into 10 groups (randomly chosen); 9 of them were used for training and the remaining one for the test. The same approach was adopted in [5], where the same corpus was used in the experiments.
3. EXPERIMENTS AND RESULTS
Two cases are considered in this study: (1) classification of PD vs. HC without discriminating by gender of the participants, and (2) classification of PD vs. HC for men and women separately. The experiments were carried out taking into account three groups of features: the features obtained from HHT (G1), the features with MFCCs (G2), and the combination of G1 and G2 (G3). The analysis of the three vowels (/a/, /i/, and /u/) was carried out separately and the 3 vowels together. This is because the vocal space area (VSA) formed by these vowels provides valuable information about the impact of PD in voice generation, and it quantifies the possible reduction in the articulatory capability of the speaker [8].
3.1 Bi-class classification
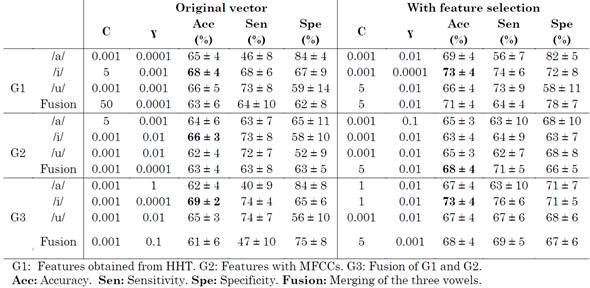
Table 2 shows the results of the classification between PD vs. HC subjects without any prior sex-based grouping. In G1 and G2, the best result was obtained from vowel /i/; meanwhile, in G3, the best result was obtained considering vowel /a/.
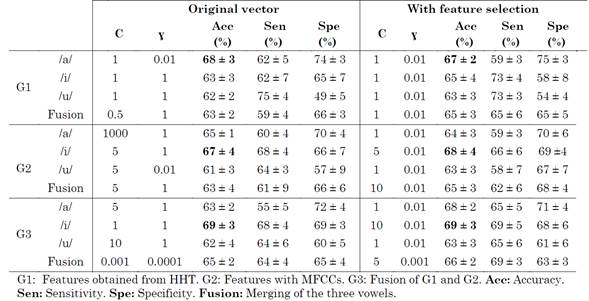
Finally, the highest accuracy, 69 %, was obtained with optimal parameters C = 10 and ɣ = 1.10(-2).. Note that the feature selection process improved the accuracy of the model. Despite the feature selection, the results did not exceed a 70 % accuracy.
We think that it is because a prior grouping based on the gender of the speakers is required due to the fact that women produce more aspiration noise than men (which affects spectral regions that correspond to first formants [18]) and there are differences between the low-pitched voices of men and the high-pitched voices of women. This is reported below.
The results of the classification, considering a prior gender-based grouping of speakers, are reported in (Table 3) and (Table 4).
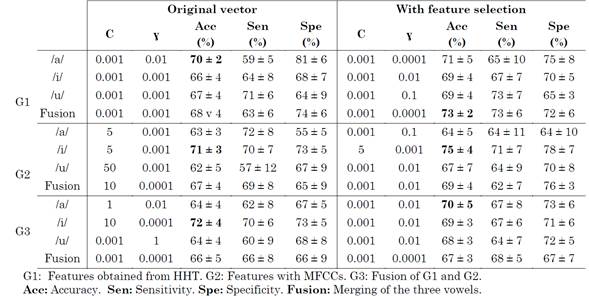
Note that the results are slightly better than those obtained in the previous experiment. Relatively high accuracies were achieved, especially when the feature selection was carried out with the Kruskal-Wallis test. Remarkably, the highest accuracies, in general, were obtained with vowel /i/, which confirms that this vowel contributes to the computation of VSA with suitable information to quantify the reduction of the articulatory capability of PD speakers.
When the original feature vector is taken into account, for men and women, in general, the best result was obtained with the vowel /i/. When the feature selection was performed with the Kruskal-Wallis test, the best results were obtained with vowels /i/ and /a/ and the combination of /a/, /i/, and /u/. Better results were obtained for female than male participants (accuracies of 75 % and 73 %, respectively). This can be explained because, compared to men with PD, women with PD suffer more notoriously from a marked subharmonic energy and segments with voice breaks [19].
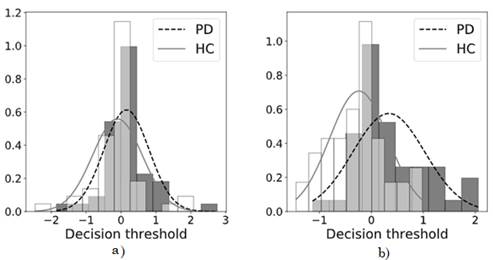
(Fig. 3) and (Fig. 4) show the scores of the classifier, which refer to the distance of each sample to the separating hyperplane. Note that, in general, the scores overlap and the scores of patients with PD are more equally dispersed than those of the HC group. Therefore, there is a tendency to confuse patients and healthy controls.
Among other factors, this is due to the fact that the age of both populations is very similar and parameter c (which controls the distance to the hyperplane between classes), in general, is a very low value. However, it should be clarified that patients with PD and HC speakers can be (slightly) better classified using the feature selection with Kruskal-Wallis test.
Source: Created by the authors.
Fig. 3 Probability density distributions and histograms of the best scores in the SVM of PD patients vs. HC speakers without sex classification. a) Original vector. b) Vector with feature selection through Kruskal-Wallis test.
Source: Created by the authors.
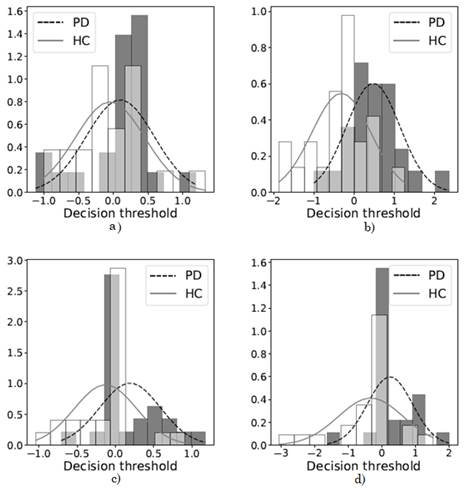
Fig. 4 Probability density distributions and histograms of the best scores in the SVM of a) male PD patients vs. male HC speakers with original vector, b) vector with feature selection through Kruskal-Wallis test, c) female PD patients vs. female HC speakers with original vector, and d) vector with feature selection through Kruskal-Wallis test
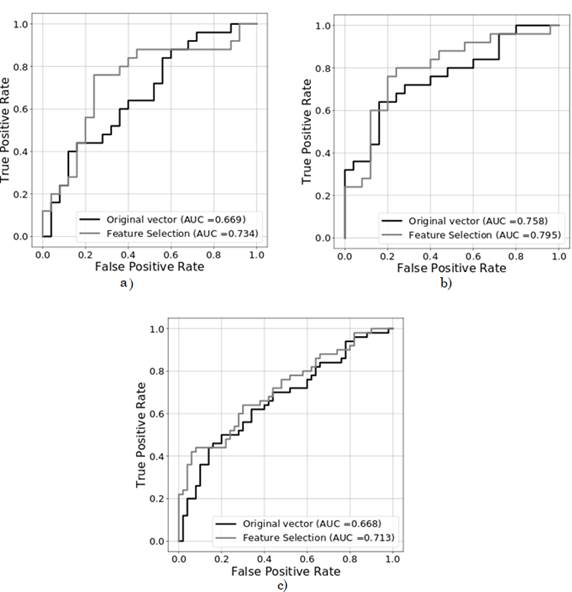
(Fig. 5) shows an additional comparison of the best results obtained in the classification of PD patients vs. HC speakers considering the two experiments (with and without sex-based grouping).
The Receiver Operating Characteristic (ROC) curve represents the results in a more compact way and is a standard measure of performance in medical applications [20]. (Fig. 5.B) shows that the best results were obtained for female speakers. Also note that the feature selection process improves the results in all cases.
3.2 Estimation of speakers’ dysarthria level: Multi-class classification and Regression.
To predict the severity of the dysarthria of patients with PD, we only used the group of features with the best performance in the bi-class classification.
The MDS-UPDRS-III scale evaluates the motor skills of different limbs (e.g., hands and arms). However, only one out of the 33 items in the scale is about speech assessment. This causes a limitation to the evaluation of patients’ neurological state considering only speech recordings.
The m-FDA scale was introduced in [13] with the aim of providing patients and clinicians with a tool that enables a more accurate evaluation of patients’ dysarthria level. Such scale considers several aspects of speech, including breathiness, lip movement, palate movement, laryngeal capacity, tongue posture and movement, monotonicity, and intelligibility [13].
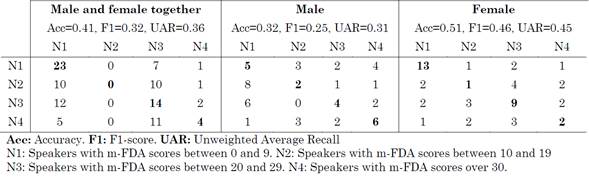
The m-FDA scale classifies speakers into four groups: speakers with m-FDA scores between 0 and 9 (N1), between 10 and 19 (N2), between 20 and 29 (N3), and over 30 (N4).
The results of the multi-class classification (N1 vs N2 vs N3 vs N4) are presented in (Table 5), along with the accuracy, F1-score, Unweighted Average Recall, and confusion matrix. Note that, as in the bi-class classification experiments, the best results here were obtained when the female speakers were considered separately (51 % maximum accuracy), which is significantly higher than when men were studied separately (32 % accuracy) or when men and women were analyzed together (41 % accuracy).
Table 5 Confusion matrix with the results of the classification of healthy controls and patients with PD at different stages of the disease
Source: Created by the authors.
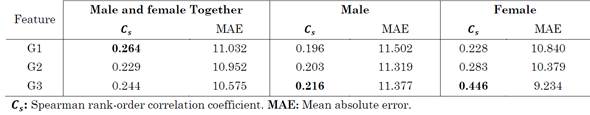
(Table 6) reports the results of the regression experiments in terms of m-FDA scores. It presents a maximum Spearman’s rank correlation coefficient of 0.446, which was obtained for the group of female speakers. This low value is due to the fact that the tasks only considered vowel pronunciations. We believe that these results might improve if longer tasks with continuous speech signals are employed.
4. CONCLUSIONS
This paper introduces a novel method based on the HHT, and it shows that articulation-based features are suitable to discriminate between PD patients and HC speakers considering sustained modulated vowels. The feature selection strategy proposed in this paper, based on the results of Kruskal-Wallis tests, seems to improve the accuracy of the proposed approach. Additionally, a gender-based pre-grouping of speakers can enhance the results, especially in the case of female participants.
The main advantage of this approach is that only modulated vowels are considered to perform the evaluation. Other studies in the literature require longer tasks like reading texts and monologues, which are more expensive, time consuming, and even more invasive. Although better results were obtained in [5] with a similar approach, our methodology is focused on modeling the first two vocal formants using the HHT. To the best of our knowledge, this is the first study that considers the HHT to model the temporal dynamics of F1 and F2.
The main motivation behind the use of the HHT to model the vocal formants is that it allows the analysis of the articulatory capacity of speakers, which, in general, is compromised in patients with PD. The results indicate that the HHT enables us to obtain relevant information in certain frequency bands that could be considered a suitable bio-marker to model the speech of PD patients.
Future work will consider nonlinear dynamical features to assess the complementarity between the information of HHT-based models and NLD features. Moreover, higher accuracies can be achieved considering measurements such as jitter, shimmer, noise measurements, periodicity, and stability of the first and second formant as well as the original signal.

