


 English (pdf)
 Article in xml format
 Article references
 Send this article by e-mail
 Cited by SciELO
  Cited by Google
  Similars in
SciELO
Similars in
SciELO  Similars in Google
 Permalink
1. INTRODUCTION
Segmentation is a well-known, challenging problem in computer vision. State-of-the-art research has traditionally tackled this problem using appearance data and analytical models for the integration of global and local color cues in order to define object boundaries [1], [2].
Nonetheless, the performance of these approaches remains limited because of the diversity and ambiguity of natural images.
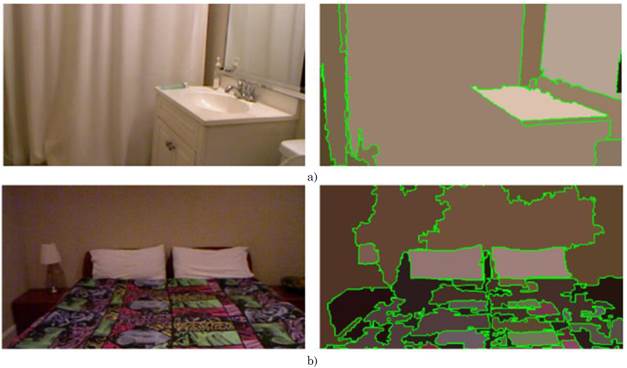
Typical segmentation, therefore, often results in either over-segmented (the image is divided into too many regions) or under-segmented scenes (too few regions), as illustrated in Fig. 1.
Source: Created by the authors.
Fig. 1 Under- and over-segmentation. (a) Segmentation using the superpixel graph algorithm in [7]; in this case, the algorithm fails to differentiate the curtain from under the sink cabinet, clearly because of its close color similarity. (b) Segmentation by statistical region merging [8], where color and light variations cause a noticeable over-segmentation of the wall and the blanket
Recently, the emergence of RGB-D cameras has improved the 3D geometry analysis of indoor scenarios by capturing depth information [3]. This knowledge enriches and complements visual cues by enabling the grouping of coherent regions from structural 3D data. Several strategies have taken advantage of depth geometry for segmentation applications [4], [5], [6]; however, merging visual and geometrical cues in such methods requires the tuning of a large number of internal parameters that increase computational complexity.
For instance, a volumetric superpixel representation of target images was computed in [4], from which a final segmentation was obtained by merging regions based on similarity levels. The NYU-Depth V2 (NYUD2) dataset was implemented in that study, but with a large collection of RGB-D images that capture diverse indoor scenes.
Alternatively, to capture a variety of color and depth features, kernel descriptors have been used on different over-segmentations [5], followed by a region grouping through a Markov Random Field context model.
Their representative results were outperformed in [6], which generalized the hierarchical appearance-based segmentation in [1], where color, texture and 3D gradients were combined in different scales. In such study, semantic segmentation is also performed using a machine learning algorithm that classifies the regions of images in the NYUD2 dataset into 40 dominant object categories [7], [8].
Other approaches propose to cluster RGB-D data with a subsequent globally-optimal segmentation applying graph theory [9], [10]. These methods compute joint color and 3D features, which make them highly dependent on the calibration that matches both data types. Despite several advances in multi-modal segmentation aimed at the integration of depth maps, the use of these complementary sources remains challenging due to missing correspondences between depth points and RGB pixels, often produced by multiple reflections, transparent objects, scattering, and occlusions [11], [12]. In general, multi-modal segmentation should be completed independently since fusing color and depth information from low-level perspectives might impose additional requirements on the registration and coherence of scene pixels.
In addition to classical schemes, learning-based methods have become much more popular in recent years due to their improved performance [13], [14] [15].
Their main limitation is the extensive need of massive amounts of labeled data to achieve proper object modeling. Furthermore, such strategies train closed models with a lot of hyper-parameters linked to the source data format, thus limiting their flexibility to incorporate new segmentation cues. Moreover, learning-based segmentation commonly addresses the problem from a higher level, in which a category object prediction is the most relevant task.
In contrast, in this work, we are interested in finding region proposals by explicit boundary integration of both depth and appearance sources of information, which does not require intense training procedures. It is important to note, however, that such segmentation results are commonly used as input of learning-based methods, which can perform object detection and classification based on multiple image segments. Therefore, throughout this paper, we do not consider a comparison of our method with learning-based methods, but we do highlight the importance of generating good region proposals to follow subsequent steps of semantic image understanding. For a more detailed discussion on learning-based methods, see [16].
This paper presents a multi-modal segmentation framework that integrates independent appearance and depth segmentation maps in a multi-modal segmentation tree (MM-Tree) by means of hierarchical region merging process [17].
The principal contribution is the definition of a coherency term that enables the consensus merging of color and depth information into the MR-tree structure. In contrast to previous approaches, we start the segmentation pipeline by processing both color and depth channels separately.
On the one hand, a color segmentation tree (C-tree) allowed us to obtain two appearance-based segmentation maps. On the other hand, we computed planar and 3D edge segmentation maps only from depth data in order to encode geometrical object information, thus achieving a better global shape description. Then, by building the proposed MM-tree representation, independent segmentation maps can be hierarchically merged following a general agreement metric between segmented regions. Such process is carried out iteratively, thus enabling us to generate different tree levels that integrate irregular shapes with semantic object coherency. In particular, a higher confidence level was assigned to depth maps because of their robustness in describing the global shape of objects, while the appearance maps are mostly useful to locally regularize the contours of segmented regions. As a result, the top level of the MM-tree hierarchy recovers and coherently integrates the available information from each color and depth channel in RGB-D images, allowing a more tractable analysis of such multi-modal and independent sources. An evaluation of our approach using the public NYUD2 dataset [4] shows its competitive performance in a wide range of scenes, outperforming state-of-the-art color segmentation approaches.
2. PROPOSED APPROACH
In this work, we present a multi-modal strategy to segment scene regions by integrating independent geometrical depth and appearance maps into a multi-modal tree structure, namely, the MM-tree.
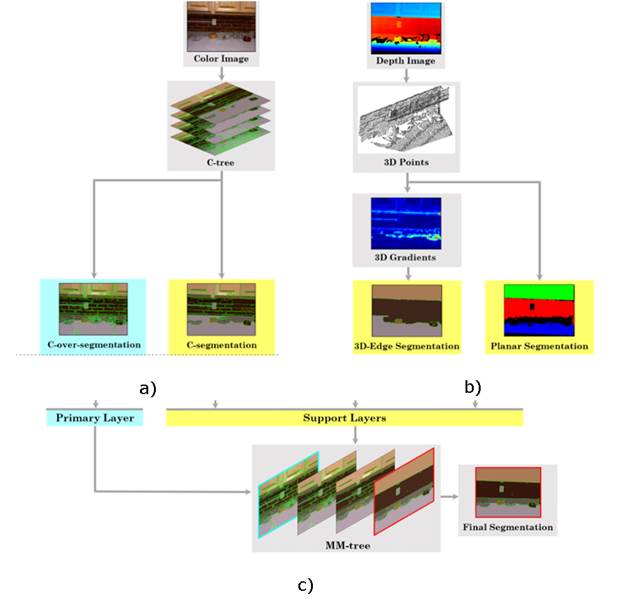
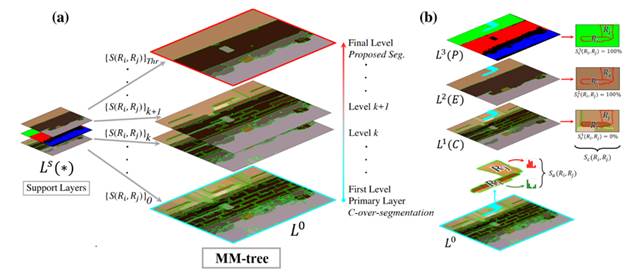
The general pipeline we propose is illustrated in Fig. 2. In it, part subfigure (a) shows the color-based tree representation (C-tree) that was implemented to manage different granularity scales from color space. From this C-tree, a first over-segmented map (C-over-segmentation) was generated as basis map for the region merging, that is, a primary layer. A more compact appearance segmentation was also obtained as support layer (C-segmentation) for further fusion support of the color space. Regarding depth information, Fig. 2 b) presents the main steps to generate the geometrical depth maps. Here, conventional pre-processing steps were followed to align color and depth data and generate 3D point clouds [18]. Subsequently, two independent support layers were obtained: (1) a 3D-edge segmentation layer and (2) a planar segmentation layer. Then, the proposed MM-tree was built from such primary and support layers, as shown in Fig. 2 c).

Where
Source: Created by the authors.
Fig. 2 Workflow of the proposed multi-modal segmentation. (a) Color segmentation tree: C-tree (section 2.1). (b) Geometrical depth maps (section 2.2). (c) Multi-modal segmentation tree: MM-tree (section 2.3). Different segmentations are obtained from depth and color data. This information is incorporated as support layers into a multi-modal tree structure that starts from an over-segmented image in color space, that is, the primary layer. A final segmentation is obtained from the last MM-tree level
This computation allows us to iteratively fuse segmentation maps from the proposed color and depth layers. The process is done by merging adjacent regions on the primary layer applying a similarity support layer criterion [17]. The computations of the primary and support segmentation layers, as well as the MM-tree structure, are described individually in the following subsections.
2.1. Color Segmentation Tree: C-tree
In this study, a first pair of segmentation maps are obtained from color cues by using the widely recognized hierarchical scheme in [1]. Such approach mainly consists in the combination of two components: the Global Probability Boundaries (gPb) algorithm [19] and the Oriented Watershed Transform and Ultrametric Contour Map (OWT-UCM) framework [20]. The gPb algorithm is basically a contour detector that exploits a multi-scale image representation from brightness, color, and texture. The OWT-UCM framework transforms any contour signal into a hierarchy of regions while preserving contour quality. Each region has an associated relevance according to the bounds of the weighted edges. From such representation, we can build an appearance-based segmentation tree with l levels associated to the prevalence of the image edges. Therefore, several maps with different granularities can be generated by changing the value of l In our pipeline, such tree is called the C-tree (see Fig. 2 (a)), from which two outputs are computed: (1) an over-segmented map, namely C-over-segmentation, i.e., the predetermined primary layer of the proposed MM-tree, and (2) a typical color segmentation map, referred to as C-segmentation, which is used as a supporting layer of he proposed MM-tree.
The C-over-segmentation layer is the most granular map, considered as a primary layer due to its role as the first level of the MM-tree, which can initialize the region merging process with many fusion possibilities (see Fig. 2 (c)). In turn, the C-segmentation layer, with considerably fewer regions, introduces an additional support layer to lead the regional agreement alongside the proposed depth maps (see Fig. 2 (b)). For the sake of simplicity, throughout this paper, we will just adopt the gPb term when referring to the whole gPb-OWT-UCM scheme [1], hereafter referred to as the gPb algorithm.
2.2. Geometric Depth Maps
As complementary information, we considered depth primitives computed from the projected 3D point distribution of the depth image, namely, the 3D point cloud [18]. Specifically, two different segmentations based on 3D-gradients and extracted planar surfaces were considered as support layers. The description of such layers is presented in the next subsections.
2.2.1. 3D-edge Segmentation
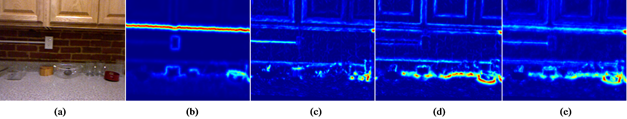
Edge information was used to describe 3D discontinuities and changes in surface orientations. In this study, a coarse geometrical scene segmentation was achieved by firstly computing 3D gradients from the 3D point cloud, as shown in Fig. 2 (b). For this purpose, we implemented the approximated model of 3D-edge detection proposed in [6]. Hence, we identified three types of contour signals: (1) a depth gradient DG, which represents the presence of depth discontinuities; (2) a convex normal gradient NG + , which captures if the surface bends outward at a given point in a given direction; and (3) a concave normal gradient NG - , capturing if the surface bends inward. In the next step, in order to generate a compact representation by a general contour signal, we defined a simple addition of the three gradient cues as: G 3D = DG + NG + + NG -.
Fig. 3 is a set of examples of these types of gradients. Subsequently, by using the OWT-UCM framework [20] (see section 2.1), which works on any contour signal, we obtained a depth segmentation tree from the general 3D gradient G 3D. Such tree yields different 3D-edge segmentation resolutions according to a tree level K 3D ∈ [0, 1]. In this paper, K 3D was set experimentally (see section 3.3).
2.2.2. Planar Segmentation
A planar surface representation [21], [22] was also considered in this study to complement the 3D structure description from 3D edges. This representation can be used to code geometrical planes into a segmentation input layer of the MM-tree process to better describe different scene perspectives. For that purpose, the algorithm starts with a fully dense graph representation that splits the 3D point cloud into uniforms partitions. Then, graph nodes are clustered to obtain K planar regions {P 1 , P 2 , …,P K }. An agglomerative and hierarchical clustering (PAHC) [21] machinery then iteratively finds the best planes that fit the scene by minimizing the mean squared error between points. Such regions are merged with neighbors that satisfy the MSE criteria. Finally, a pixel-wise region growing is performed to refine the boundaries of the clustered plane regions. The PAHC strategy is robust for detecting planes in diverse scenarios from different perspectives and with important object variations. Besides, such strategy is computationally efficient, achieving real-time performance with remarkable accuracy in the state-of-the-art. This planar representation is fundamental in the proposed approach, providing complementary information that allows the algorithm to differentiate objects according to the perspective of the shot.
2.3 Multi-modal Segmentation Tree: MM-tree
In this paper, we propose a multi-modal segmentation tree (MM-tree) that leverages depth and appearance segmentation maps through a hierarchical region merging step (HRM) [17]. The process is illustrated in Fig. 4. The HRM starts from the C-over-segmentation (section 2.1) as a primary layer of the MM-tree, represented by L 0 ={R 1 ,R 2 , …,R i ,R j , …, R n } with n disjoint regions. Each one of these regions is a set of neighbor pixels with shared similarities in visual cues, such as color, brightness, and texture. Additionally, we defined a set of supporting layers L s (*) as follows: (1) C-segmentation (section 2.1) as L 1 (C) , (2) 3D-edge segmentation (section 2.2.1) as L 2 (E), (3) the planar segmentation (section 2.2.2) as L 3 PE).
Source: Created by the authors.
Fig. 4 (a) MM-tree generation. A hierarchical region merging process starts from the primary layer L 0 . At each iteration, a pair of regions R i ,R j ∈ L 0 are merged based on a set of similarity measures {S(R i ,R j )}k over all adjacent region pairs. This merging creates a new level in the MM-tree. (b) Similarity calculation between adjacent region pairs. From L 0 , regions R i ,R j are evaluated in terms of two metrics: (1) the cross-region evidence accumulation Sc(R i ,R j ), which considers the overlapping of R i ,R j over the three supporting layers L s (*) = {L 1 (C), L 2 (E), L 3 (P) }, and (2) the appearance similarity Sa(R i ,R j ), which only considers the color distribution on R i ,R j . These metrics define how the merging is carried out and are summarized into a joint similarity S(R i ,R j ). A final segmentation in the MM-tree can be obtained by specifying a threshold STHr for S(R i ,R j )
The support layers L s (*) encode coarse regions that guide the merging process of small regions in the primary layer L 0 Each L s (*) consists of m different image regions L s = {R s 1, R s 2,…, R s k,…, R s m} generally with m≪n. At each step of the HRM, two adjacent regions on the primary layer R i ,R j ∈ L 0 are considered, with a total cardinality of | R i |⋅| R j | pixel pairs. Such region pair is spatially projected on a particular matching region R s k on each support layer L s in order to assess coherency across depth- and appearance-based maps. This coherency is measured by means of an overlapping rule between R i ,R j ∈ L 0 (see Fig. 4 (b)), which is mathematically expressed in (1) as the joint similarity S(R i ,R j ).
The first term in (1), Sc ∈[0, 1], is a cross-region evidence accumulation (CREA). This term measures the coherency between two adjacent regions R i ,R j on the primary layer L 0 w.r.t. spatially coincident regions R s k over the three supporting layers L s . S c then contributes to the merging of (R i ,R j ) by taking into account its overlapping percentage across each L s , under the assumption that they may represent the same entity, mostly in terms of depth (as it can be noted in the use of two supporting depth maps and only one color map). For instance, the maximum value of S c is reached on a particular support layer when the whole pixel distribution of R i and R j concur in R s k.
Otherwise, if only part of the pixels intersects R s k, a partial coherency is obtained w.r.t. the number of overlapping pixels and the two region sizes. In general, the S c similarity score has a major depth weight on the final regional merging decision, since the definition of coarse object shapes is better reflected in the respective depth maps.
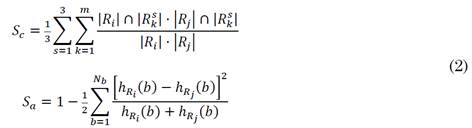
The second term, S a ∈[0, 1], adds an appearance similarity consideration by computing a local histogram representation h R (b) of each compared region. For this purpose, we obtain a CIE-Lab color histogram where N b is the number of histogram bins. Then, a similarity rule is adopted according to the chi-squared distance χ 2 of adjacent region histograms (h Ri , h Rj ) [1]. The appearance confidence is then calculated by locally measuring the χ 2 distance and weighting it by the sum of its respective bins (it must be equal). Therefore, close large bins will represent a close region similarity, being robust to the noisy information of small bins.
Finally, the parameter λ a ∈[0, 1] allows the method to regularize the contribution percentage of the appearance similarity S a .
Thus, by using (1) as a similarity region rule, the HRM is carried out in an iterative manner to gradually build the MM-tree.
Specifically, at each iteration, the two regions with the highest S(R i ,R j ) are merged into a new, larger region. This creates a new tree level where the number of regions has decreased by one. The MM-tree structure then codes new segmentation levels with new region associations (see Fig. 4 (a)). A similarly stopping criterion S Thr defines the selection of a specific MM-tree level as the final segmentation. That is, if, from the whole region distribution in L 0 , there are no remaining adjacent region pairs with significant joint similarity S, the algorithm completes a final segmentation and the iterative process must stop.
In this paper, we propose a multi-modal tree representation (MR-Tree) that hierarchically integrates seminal segmentations obtained from color and depth information. The MR-tree generation process is based on a previous approach that operates only on the RGB space [17], integrating several over-segmented layers into an appearance-based tree. That classical appearance tree uses redundant information over different spatial scales to recover object shapes. Nevertheless, as a traditional RGB approach, it misses additional and complementary information from geometrical depth cues. In contrast, the proposed approach achieves a multi-modal integration by projecting appearance granular regions on coarse depth segments. Also, a regularization term defines additional appearance support. In that way, the regional coherence in RGB-D images is strongly influenced by depth information.
Therefore, a complex texture computation, originally considered in [17], was removed due to its noisy distribution in natural and cluttered scenes.
3. EXPERIMENTAL SETUP
3.1 Dataset and Implementation Details
The proposed strategy was evaluated on the public NYUD2 dataset [4], which is composed of 1,449 RGB-D images and their corresponding ground truth segmentations.
The images capture diverse indoor scenarios of private apartments and commercial accommodations. The NYUD2 dataset is very challenging due to its high scene variability, numerous and cluttered objects, and multiple perspectives. Two image subsets were extracted for the evaluation steps in this study: Tuning set and Test set. For tuning experiments (section 3.2), the tuning set contained 290 randomly selected images (20 % of the total dataset). For the quantitative performance evaluation (section 4.2), we used the remaining images, that is, 1159 pictures.
The experiments were conducted in 64-bit MATLAB R2016b (Ubuntu Linux) on a workstation with an Intel Core i7 CPU (4 cores, 8 threads) processor and 32 GB of RAM. MATLAB libraries Image Processing and Computer Vision toolboxes were required. The specific state-of-the-art segmentation algorithms used as components of this study, as well as those used for comparison, are original implementations by the authors in MATLAB software.
The execution time of the complete pipeline for segmenting a single image was 282.6 seconds on average, which mostly depends on the complexity and number of objects in the imaged scene. This overall duration covers 4 steps with the following typical individual times: 121.1 sec (C-tree, section 2.1), 32.6 sec (3D-edge segmentation, section 2.2.1), 0.14 sec (planar segmentation, section 2.2.2), and 128.8 sec (MM-tree, section 2.3).
3.2. Performance Measures
Three standard metrics were selected to quantitatively evaluate the performance of the segmentation results compared with human ground truth: Segmentation Covering [23], Rand Index [24], and Variation of Information [25].
3.2.1. Segmentation Covering
Segmentation covering has been widely used for comparing the similarity of segmented regions with respect to ground-truth labels [23]. Specifically, this metric quantifies the level of overlapping between the estimated region R and the ground-truth region R’, defined by (3) as:
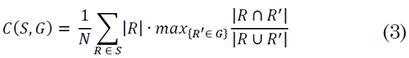
where N denotes the total number of pixels in the image and a value of 1 indicates perfect covering. Therefore, the segmentation is considered better as C approaches 1.
3.2.2 Rand Index
Let us consider two segmentations S and G of N pixels {x 1 ,x 2 ,…,x N } that assign labels {l i } and {l’ i } respectively, to a pixel x 1 . The Rand Index RI can be computed as the ratio of the number of pixel pairs having the same label relationship in S and G [25].
Such ratio is then defined by (4). Where
I
is the identity function and  is the number of possible unique pairs among N pixels. This gives us a measure that quantifies the fraction of pixel pairs whose labels are consistent between S and G. And, as in the case of (2), its maximum value is 1 when the two segmentations are actually the same.

3.2.3. Variation of Information
The Variation of Information (VI) is a global measure of the distance between two clusters of data from a combination of entropy (H) and mutual information (I) indexes [25]. In this case, the metric is defined as the distance between estimated (S) and ground truth (G) segmentations, expressed in a simplified form in (5):

Regarding this metric, unlike in (2) and (3), values close to zero indicate greater similarity since it is an error quantification.
3.3 Parameters Tuning
The experimental setup of this study required a final step: assessing the effect of the main parameters on the performance of our method. For this purpose, we performed a grid search over parameters K 3D , λ a , and S Thr . From that analysis, it was possible to analyze the contribution of each perceptual cue to the segmentation process, namely, 3D-edges (K 3D ), appearance and CREA similarity (λ a ), and RGB-D segmentation tree granularity (S Thr ). The grid search was performed as a different tuning experiment for each of the parameters mentioned above.
Tuning experimentation was then carried out on a randomly selected image subset of 290 images (20 % of the total dataset). The results we obtained are detailed below.
3.3.1 3D-edge Segmentation Level
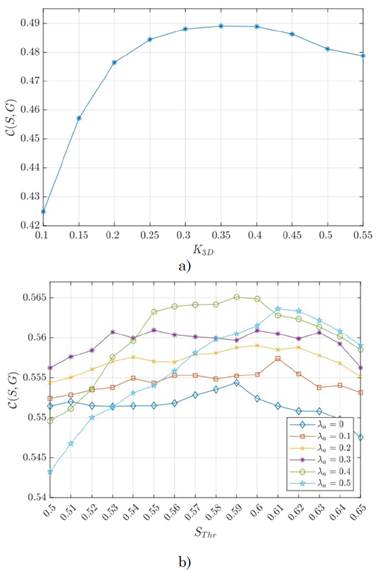
K 3D is the tree level that yields the 3D-edge segmentation from 3D gradients (see section 2.2.1). This support layer represents the main cue from depth data to be fused with appearance information. As shown in Fig. 5 (a), the best covering score for the 3D-edge segmentation was achieved at K 3D = 0.35, which corresponds to gradient maps with few object details and thus removing small noisy image artifacts.
3.3.2. Trade-off between Appearance and CREA Similarities
The λ a parameter weights the importance of appearance and CREA similarity metrics from depth and color information (see section 2.3). Fig. 5(b) presents results for different values of this parameter. The best performance was observed at the peak of λ a = 0.4 which highlights the importance of a balanced trade-off between appearance and depth fusion.
3.3.3 Stopping Criterion for the MM-tree
The parameter S Thr controls the stopping criterion for the MM-tree computation to return a final segmentation (see section 2.3). Such parameter was fixed at S Thr = 0.59 for the previously highlighted λ a value, as it represents the best covering point and the merging of adjacent regions with a joint similarity greater than 0.59 (see Fig. 5 (b)).
Source: Created by the authors.
Fig. 5 Parameter selection. We performed a parameter tuning of the main components of our methodology: (a) 3D-edge segmentation granularity (K 3D ). (b) Appearance and CREA similarity contributions (λ a ) and the final segmentation granularity on the MM-tree level as a function of the S Thr stopping criterion. Subfigure (a) shows the average covering score of the 3D-edge segmentation as a function K 3D . Values within the interval [0.25, 0.5] suggest a low detailed gradient map; this is the best option to support segmentation. Subfigure (b) indicates that the consideration of both modalities via the CREA S c and appearance S a similarities (see Equation (1)) improves segmentation results, that is, λ a >0. Note that the stopping criterion S Thr ∈[0.55, 0.6] yields the best segmentation results at λ a =0.4.
This result is a reasonable value since it is approximately a 60 % probability of being the same region according to the integrated appearance and depth segmentations.
4. EXPERIMENTS AND RESULTS
Four state-of-the-art approaches were considered for comparison. These strategies include widely recognized color-only frameworks such as Statistical Region Merging [8] (referred to as Nock, its creator’s last name), Full Pairwise Affinities for Spectral Segmentation [26] (referred to as MLSS, as in the original paper), and Global Probability Boundaries [1] (referred to as gPb, as explained in section 2.1), as well as the top performing color-plus-depth approach in [6] (referred to as gPbD since it is a generalized version of the gPb algorithm). For a fair comparison, the parameters of the Nock, MLSS, and gPb approaches were tuned based on the segmentation covering scores on the tuning set. The same parameters on the same dataset reported in [6] were used here for gPbD.
4.1 Qualitative Evaluation
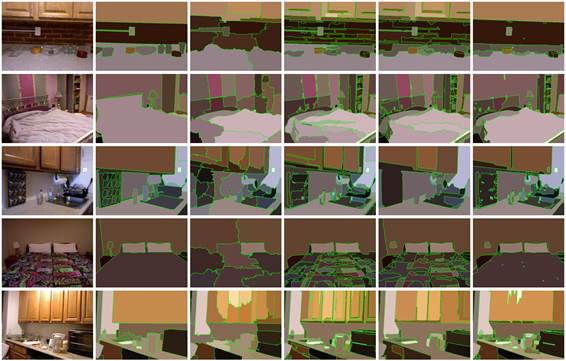
A qualitative analysis of five sample scenes is presented in Fig. 6. The first column presents the original image input.
Source: Created by the authors.
Fig. 6 Sample images and their segmentations. From left to right: input image, ground truth, MLSS [23], gPb [1], gPbD [6], and proposed segmentation
Ground truths are on the second column, and the next three columns report a baseline evaluation performed with MLSS [23], gPb [1], and gPbD [6], respectively.
The last column shows the final segmentation result achieved in this study.
In almost all the images, the proposed approach performs a robust scene segmentation by integrating depth and appearance information. Some local and specific drawbacks are reported because of the sensitivity of the computed features and the integration of initial region proposals, restricted to a color base layer.
Also, in some cases, strong light intensity can affect the results (fifth row).
Particularly, in the images in the first and fourth row, our strategy yields better results than other baseline techniques due to its capability to exploit and properly code depth information. In the third and fifth rows, as well as the first, a richness of small scene objects can be noticed, a particularly challenging problem for most non-supervised strategies.
4.2 Quantitative Evaluation
We carried out a quantitative evaluation of the proposed approach and the baseline strategies compared to human ground truth delineations in the testing set (1159 images) by implementing the benchmarks/metrics detailed in section 3.2.
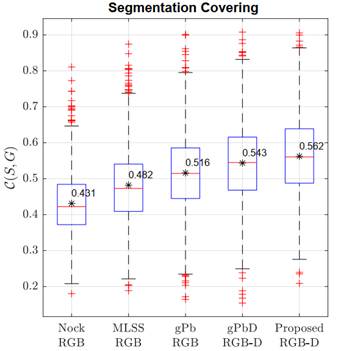
Fig. 7 shows the performance obtained using the Segmentation Covering evaluation. We achieved the best results, in terms of overlapping, with an average accuracy of ∼0.56 (black asterisk in the box plot). This performance was mostly due to the proper integration of depth geometrical features that allowed a better identification of objects categorized on the same plane. Such extra depth cue was also exploited by the gPbD algorithm, but it needed many additional computational resources to segment the objects. Despite small numerical differences, compared to gPbD, our segmentation pipeline is simpler and more flexible in introducing new geometrical and appearance features without changing the general computational framework. In contrast, color-only strategies over-segment images and tend to split objects into small instances because of the high light variability and multiple color distribution in the captured scenes. In such cases, 2-dimensional edges are considerably noisy and cannot support object geometries.
Source: Created by the authors.
Fig. 7 Performance comparison between state-of-the-art and proposed segmentations in terms of Segmentation covering ( C ). Higher values indicate better segmentation. Note that the score obtained with the proposed strategy is competitive because it is higher than that of the other techniques
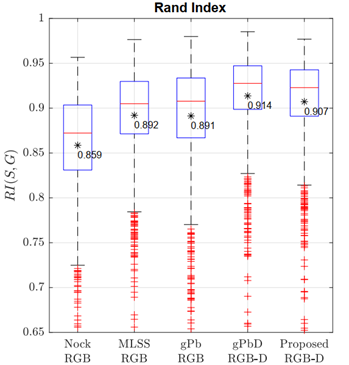
Fig. 8 presents the general scores of the approaches evaluated here using the Rand Index. Our score can be summarized as a mean value of 0.907, being slightly lower than that of the gPbD method (0.914), without statistically significant differences.
Source: Created by the authors.
Fig. 8 Performance comparison between state-of-the-art and proposed segmentations in terms of Rand Index ( RI ) Higher values indicate better segmentation. Here, the score of the proposed segmentation is slightly lower than that of the gPbD scheme, but the performance remains better w.r.t. RGB approaches
The best performance was also achieved with both depth-aware strategies, with even more compact results regarding quartile score distribution. The proposed segmentation results are competitive thanks to the coding of plane and 3D-edge features, but numerous mistakes are produced by the incorrect labeling of tiny scene objects that share the same plane or have negligible edge discontinuities. In turn, the color-based strategies exhibited a lower performance, except for the gPb approach (∼ 0.89), but with a larger variance in the results. The MLSS approach, in contrast, achieves a more compact RI variance with an average accuracy of 0.892, exceeding the gPb average but with the drawback of requiring the number of desired segmented regions.
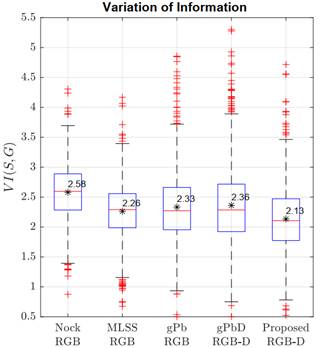
Finally, Fig. 9 reports the results of the metric Variation of Information. In it, the proposed approach achieves the lowest score, with an average of 2.13, while gPbD reached 2.36 with larger score variance (see Fig. 9). Regarding color-based strategies, MLSS achieved the best performance. In general, the proposed segmentations achieve competitive results with respect to the widely known gPbD scheme, which also involves depth information but with more complex joint definitions and relationships of data primitives. In contrast, this study is focused on the computation of simple yet robust primitives from image and depth channels, treated and coded independently.
Source: Created by the authors.
Fig. 9 Performance comparison between state-of-the-art and proposed segmentations in terms of Variation of Information ( VI ). Lower values indicate better segmentation. Note that the score obtained with the proposed strategy in this scenario is competitive because it is lower than that of the other techniques
A hierarchical and iterative merging allow us to efficiently integrate such primitives and obtain a relatively coherent scene grouping. As shown in the previous results, the use of depth primitives is a clear advantage to face the challenging problem of image segmentation.
4. DISCUSSION AND CONCLUDING REMARKS
RGB-D image segmentation is a field in continuous development with powerful and interesting advantages that allow us to deal with several applications limited by the use of color relationships only.
For instance, the problem of object detection is very challenging when objects share a lot of key features in appearance space and also present a wide variability due to differences in perspective, capture, and illumination conditions. With the availability and leverage of depth information, such issues can be significantly reduced. In this study, we presented a novel RGB-D segmentation strategy based on the integration of color and depth information. A key difference of the proposed method with respect to state-of-the-art approaches is the analysis of color and depth data in an independent manner, before performing the fusion of both information sources. To this end, we incorporated consensus clustering algorithms [27] into the segmentation process, which aims to combine a set of different clusters to find a more accurate one. The proposed method achieved competitive results on the NYU-Depth V2 dataset with respect to three relevant segmentation metrics in the literature: Segmentation Covering, Rand Index, and Variance of Information.
Remarkably, the proposed approach only requires visual and depth information without any prior labelling in order to deal with regional segmentation. In that sense, this study can be used as a starting point for more sophisticated approaches, such as visual component regularization, in order to achieve more effective and faster segmentations.
The planar and 3D edge maps computed from depth information supported coherent object segmentation tasks, according to results reported on the public dataset evaluated here. In that sense, the proposed approach is robust compared to the baseline depth gPbD scheme [6]. The computation of independent geometrical cues leverages important patterns to perform segmentation in depth space, without the noisy color components. Also, the use of independent geometrical cues avoids the computation of joint color and 3D features, as done in previous studies [4], [6], [10], a task that involves too many parameters and is difficult to tune and normalize for different natural scenes. Note, however, that the contribution of depth information depends on well-defined geometry features and the plane of capture for some fine-detailed objects. In such cases, it might be necessary to develop additional alternatives that could adaptatively adjust the weight of depth cues in the observed scene. In several cases, the sparse nature of planes and intrinsic object representation could introduce local segmentation errors. As RGB-D acquisition technologies continue to improve, 3D data is expected to achieve a more precise capture of local geometric information, which should naturally yield improved segmentation results.
The proposed approach, non-supervised in nature, can serve as input for supervised frameworks. Currently, most segmentation schemes take advantage of learning-based strategies that learn complex parametric models from hand-labeled images in massive datasets.
Training these approaches is computationally expensive and limited in terms of incorporating new perceptual cues for segmentation improvement, as required with emerging technologies in multi-modal sensors. Conversely, the proposed pipeline has potential for multi-modal cue integration and can contribute as a primary step to automatically segment coherent regions that can be evaluated by more sophisticated learning-based algorithms. Regarding computational cost, our method is efficient and can be parallelized since geometrical and depth features are processed independently.
Additionally, the hierarchical region merging process implemented here is based on an iterative process that can be treated in new computational configurations.
Despite current studies that report remarkable advances in segmentation tasks [13]-[15], the effectiveness of their strategies depends of proper adjustments of learned representations, which, in general, require large training batches.
In that sense, those approaches achieve effectively hierarchical architectures, discovering kernels even to represent basic primitives. The proposed approach could be integrated into first- and mid-level layers of such hierarchical schemes, allowing a more effective and faster training. Finally, the use of these pre-computed regions from the proposed tree representation can reduce overfitting problems and address the segmentation challenges of reduced training datasets.

