


 Inglês (pdf)
 Artigo em XML
 Referências do artigo
 Enviar este artigo por email
 Citado por SciELO
  Citado por Google
  Similares em
SciELO
Similares em
SciELO  Similares em Google
 Permalink
1. INTRODUCTION
Traditionally, analytical techniques such as gas chromatography (GC), mass spectrometry (MS), or a combination of both (GC-MS) have been used to measure the aromatic and saturate contents at the outlet of catalytic cracking units that operate in refineries and to determine their global conversion [1], [2].
Interestingly, a simple concentration analysis in these setups takes more than 10 minutes, while most cracking reactions take 3 seconds or less [3]. Developing measurement techniques that operate in situ and provide real-time information may be beneficial for the study of the heterogeneous catalytic processes that take place in refineries (such as fluid catalytic cracking, FCC) and their interaction with the complex hydrodynamics of circulating fluidized beds. Real-time information may be also useful for process control and to improve process efficiency [4], [5], [6].
Optical techniques allow online and in-situ gas sensing [7], [8]. For instance, in the field of FCC, optical-fiber probes [9] have been extensively used for particle velocity and cluster sizing measurements at atmospheric conditions [10], [11], [12]. While the use of different optical techniques such as Mid-Infrared (MIR) spectroscopy for the analysis of the concentration of hydrocarbons is well documented [13], [14], [15], [16], the methodology to evaluate the global conversion based on the nature of the C-H bonds present in hydrocarbons and Beer-Lambert’s law proposed by Lopez-Zamora et al. [17] was the first applied to FCC.
The experiments in this study were conducted with a helium-neon (HeNe) laser operating at a wavenumber of 2949.85 cm−1 (3.39 µm wavelength) using 1-hexene and 1,3,5-triisopropyl benzene (TIPB) as model compounds. A Riser Simulator® operating at 823 K, a ratio of catalyst to oil (CTO) = 2.5, and a time on stream (TOS)= 7 sec were used to validate the method.
A fiber optic sensor was employed to locate the laser beam aiming at the external annular space (downflow zone) of the reactor, without the presence of particles.
In the peer-reviewed literature in this field, no other optical diagnostic method has been applied to characterize the FCC reaction or other reactions in cracking systems. The evaluation of the effect of catalyst particles on the ability of the MIR described in [17] is an important step towards the widespread application of this technique for the characterization of FCC systems.
While different laboratory-scale reactors have been widely used for kinetic and catalysts evaluation [18]-[29], in their original configurations it is difficult to include an optical setup to perform in-situ and real-time measurements in the presence of a catalyst. In this study, we report the design and construction of such a setup. The equipment was conceived as a testing tool for optical techniques that can be used in a wide range of operating conditions. Our setup was used to validate the operation of the optical setup described by Lopez-Zamora et al. [17] for the evaluation of the 1-hexene concentration in the presence of an equilibrated FCC catalyst.
2. EXPERIMENTS DEVELOPMENT
Fig. 1 presents a simplified process flow diagram of an experimental downer setup. In it, a heater increases the catalyst temperature before it comes into contact with the feed at the upper part of the reactor. The temperature in the catalyst heater is set in such a way that the catalyst stream heats the feed to a previously defined reaction temperature; the reaction continues while both phases are flowing downwards. Finally, products and spent catalyst are separated.
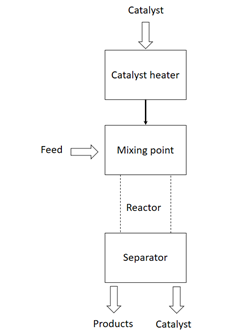
Source: Created by the authors.
Fig. 1 Simplified process flow diagram of the experimental setup that represents the downer reactor used for the study of heterogeneous catalytic reactions
A critical issue in the design of an experimental system for the analysis of heterogeneous catalytic reactions is the need to guarantee that the temperature profile in the reactor stays at a nominal constant value, despite the fact that the catalyst and the feed enter at different temperatures and that the residence time in the reactor is short. We carried out measurements as well as Computational Fluid Dynamic (CFD) simulations to validate the temperature profile in the reactor.
2.1 CFD simulation
The CFD simulation of the downer reactor considered the three spatial dimensions and was developed using an Eulerian-Lagrangian approach where the fluid (gas) is treated as a continuous phase while the dispersed phase (catalyst) is solved by tracking a large number of particles. The commercial CFD software ANSYS Fluent V15.0 was used to discretize and solve the Navier-Stokes equations of continuity, momentum, species, and energy transfer. The equations considered in our simulations have been widely reported and can be consulted in several references [30], [31], [32].
The simulation domain was divided into two zones. The first domain considered the particle-heating zone, where the particles were heated from ambient temperature to a nominal temperature.
The actual process conditions are described below. A second zone included the entrance of the feed stream (FS) into the reactor zone.
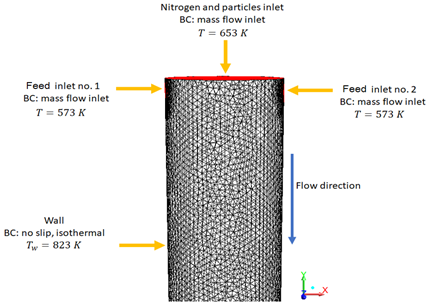
A tetrahedral mesh was used for both zones. The particle-heating zone had 6 × 10⁵ elements with a mean aspect ratio of 0.88. The nitrogen and particle inlet were represented as a Mass flow inlet boundary condition (BC). For the walls, a no-slip condition was considered. A Pressure outlet BC represented the exit of the particle heating zone.
The reaction zone considered 1.8 × 10⁶ tetrahedral elements with a mean aspect ratio of 0.76. More elements were required to model the reaction zone than the heating zone as the former is longer and more refinement is required to capture the flow from the inlet of the FS. While mesh-size independence analysis is desirable to support a CFD calculation, computational and time limitations made such analysis unfeasible in this study. Nevertheless, an adequate agreement between experiments and simulations, as presented below, was considered enough to support the simple CFD conclusion in this paper.
Fig. 2 shows the top of the reaction zone where the refinement is evident; it also presents the BCs used in this simulation.
Source: Created by the authors.
Fig. 2 Lateral view of the mesh used for the simulation of the top of the reaction zone
The inlet of the nitrogen and particles coming from the heating zone to the reaction zone was represented as a Mass flow inlet BC entering at the exit temperature obtained in the simulation of the heating zone.
The FS entered through two holes at a 45° angle on the vertical axis.
The FS input was represented by a Mass flow inlet BC. For the reactor, a Wall BC with a no-slip condition and a constant temperature was considered. A Pressure outlet BC represented the exit flow of the reactor. To decrease the computational time, the simulation did not consider heat transfer through radiation in the reaction zone. The acceptable agreement between experiments and modelling, as presented below, indicates that neglecting radiation does not significantly influence the conclusions obtained from the simulations
The CFD simulation was simplified by neglecting the interaction between the continuous (gas) and discrete (particle) phases. In this way, the solution of the dispersed phase considers the momentum and energy contribution from the continuous phase but not vice versa [33].
To represent the reaction, the simulation considered a pseudo-homogeneous reaction in the continuous phase and inert catalyst particles. To study heat transfer, the effect of the reactions is important because the system is accelerated due to the increase in volume caused by the cracking reactions [34]. The chemical reaction mechanism was that reported by [35].
The CFD simulation required knowledge about properties related to heat transfer in the gas phase as well as the solution of the momentum equation. The thermal conductivity (κ N2 ), specific heat (Cp N2 ), and dynamic viscosity (μ N2 ) of nitrogen were calculated using a polynomial approximation that was a function of the gas temperature (f(T g )= A1 + A2·Tg + A3·Tg 2 + A4·Tg 3 + A5·Tg 4). Table 1 summarizes the polynomial coefficients.
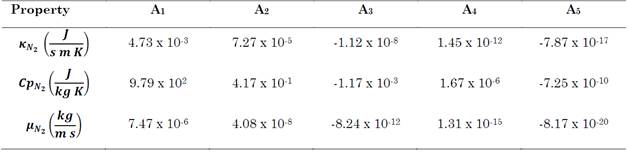
The ideal gas law was used to calculate density. While experiments, as discussed below, were conducted with 1-hexene, in the CFD simulation, the properties were those of TIPB at 823 K (κ = 0.05 J/s ·m K, Cp = 3000 J/kg · K, and μ = 1.4 × 10⁻⁵ kg/ms [36]).
TPIB is a hydrocarbon typically used as a surrogate in refinery reactions whose kinetic parameters are publicly available.
While some minor changes in the simulation are expected with 1-hexene, they should not affect the conclusions in this paper. In the reaction zone, all properties were calculated by a mass-weighted mixing law. For the catalyst, a mean diameter of 8.46 × 10⁻⁵ m, a catalyst density of 1525 kg/m3, and a particle specific heat capacity of 1090 J/kg · K [38] were considered. The particle density (ρp) and diameter are similar to those in other studies [39], [40]. The dimensions of the reaction zone are described below.
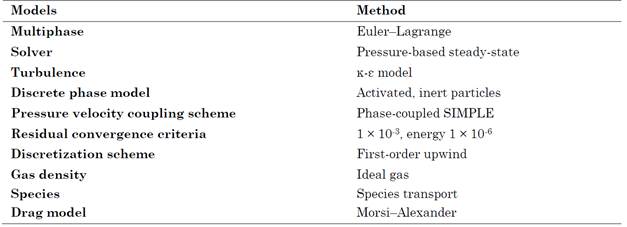
The emissivity (εw) was 0.6, a value that corresponds to that of 3-mm thick fused quartz at 800-900 K [41]. The Morsi-Alexander drag model [42] for a spherical particle was implemented. The models relevant to the CFD simulation are listed in Table 2[43].
2.2 Lab-scale downer
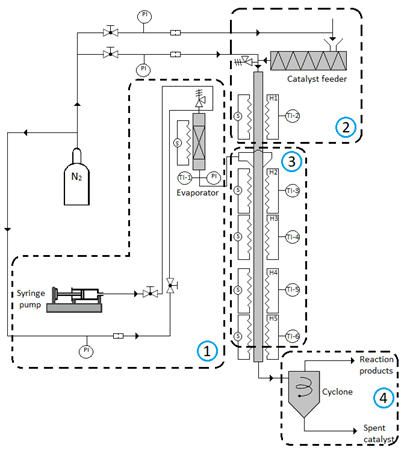
Fig. 3 is a schematic representation of the experimental setup that includes four zones: (1) Evaporation, (2) Particle heating, (3) Reaction, and (4) Separation. In the Evaporation zone (No. 1 in Figure 3), a precision syringe pump (New Era Pump Systems NE-8000 model) with a 200-ml stainless-steel syringe (partially filled to about 140 ml) controlled the rate of injection of the feed, 1-hexene (C6H12, 84.16 g/mol, boiling point = 336 K), through a resistance-heated steel cylinder (0.12-m length and 0.025-m diameter) with a dedicated temperature control and packed with Ottawa sand (particle diameter, between 0.85 mm and 1 mm). The experiments reported here were conducted at feed rates from 0.6 to 2 cm3/min of liquid 1-hexene.
Source: Created by the authors.
Fig. 3 Experimental setup: (1) Evaporation zone, (2) Particle heating zone, (3) Reaction zone, and (4) Separation zone
Nitrogen was flown (0.42 slpm, standard conditions were considered as 293 K and 101325 Pa) through the system initially to purge the evaporator and, later, to help entrain the evaporated feed.
Two stainless-steel hypodermic tubes transported the N2/feed stream into the reactor. The reactor was a clear fused quartz tube (0.013 m ID ( 0.016 m OD ( 1.80 m long) with two ports located at 180° on the reactor surface 0.70 m from the catalyst inlet. These ports, used for the feed entrance, were tilted 45º from the vertical axis, in the direction of the flow.
The catalyst flow was controlled by a volumetric screw feeder (Schenck Process AccuRate 106M) that was calibrated for a catalyst mass flow between 7.5 g/min and 105.9 g/min. In the experiments, the catalyst flow was 30 g/min, which, for the feed flow described above, yields a catalyst to oil ratio of 0.4 to 1.25. Equilibrated catalyst particles between 53 and 106 µm were used in the experiments. A tube furnace (H1 in Fig. 3) of 0.45 m in length, located in the particle heating zone (Zone 2 in Figure 3) before the inlet of the feed ports, heated the catalyst particles up to 873 K. Nitrogen entered the quartz tube (0.13 slpm) and the upper part of the feeder hopper (0.035 slpm) to neutralize the buoyancy effect of the hot gases in the reactor and purge the catalyst from oxygen, respectively. The time on stream of the downer considering the feed and nitrogen flows was estimated at 2 s.
Depending on the operating conditions, cracking reactions can take place throughout the lower part of the fused quartz tubing, i.e., from the feed entrance where the evaporated feed, the catalyst, and nitrogen mix, to the fused quartz end, approximately 1.10 m below.
This is the Reaction zone, No. 3 in Fig. 3. Four additional tube furnaces with different lengths (0.30 m, 0.25 m, 0.20 m, and 0.20 m), individual temperature controls, and that can be moved in the vertical position to allow optical access keep the Reaction zone at a maximum reaction temperature of 823 K. The temperature control used type K thermocouples located 5 mm away from the exterior of the quartz tube.
At the end of the Reaction zone, a separation cyclone removes spent catalyst from the gas reaction products, a flexible stainless steel hose is connected from the cyclone’s gas outlet to an exhaust hood, and the catalyst is received in a collection box with 4.5 L of capacity (No. 4 in Fig. 3).
A data acquisition system continuously logged the temperature at the outlet of the Evaporation zone (TI-1 in Fig. 3), the temperature of the five furnaces (TI-2 to TI-6 in Fig. 3), and relevant data from the optical measurements.
2.3 Optical setup
As previously mentioned, Lopez-Zamora et al. [17] demonstrated the use of a HeNe laser operating in the MIR for monitoring the progress of a FCC reaction. In the present study, the same optical setup proposed by Lopez-Zamora et al. was adapted to operate in the reactor in Fig. 3 and evaluate the effect of particle flow. Other authors [17] have reported details of the spectroscopic information of 1-hexene in the MIR region.
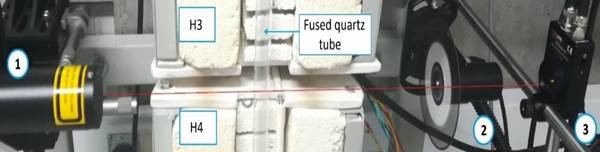
Fig. 4 is a picture of the optical setup operating in the quartz reactor.
Source: Created by the authors.
Fig. 4 Photo of the optical setup adapted to the reactor: (1) He-Ne Laser, (2) Optical chopper, and (3) Photodetector. The picture shows a section between H3 and H4 as labelled in Fig. 3
The optical setup includes three parts: (1) a continuously operating HeNe laser (Research Electro Optics, Inc.) with a wave number of 2949.9 cm−1 (3.39 µm wavelength), a beam diameter of 2.02 mm, and a maximum output power of 7 mW; (2) an optical chopper that can reach a frequency up to 1000 Hz; and (3) a PDA20H (-EC) PbS photodetector (Thorlabs) with a detection wavelength range between 1.5 µm and 4.8 µm. There is a 0.45-m distance between the He-Ne laser and the photodetector, but the actual absorbing path length is equal to the reactor’s inner diameter, i.e., 0.013 m.
The changes in concentration of the feed stream along the reactor were related to changes in the intensity of the laser beam according to Beer-Lambert law (1) [44]:
where I 0 and I are, respectively, the intensity of the radiation before and after the interaction of the laser beam with the medium; σ λ,i is the absorption cross-section of species i that depends on the temperature and pressure; n i , the concentration of species i; and L, the path length. a i is known as absorbance and, as (1) states, for a constant temperature, pressure, and path length, the absorbance should be proportional to the concentration of species i.The previous statement has one condition: it assumes that, for the catalytic cracking of one species (as is the case in this study), any interference of the products at the specific wavelength of the experiments is negligible. The results of Lopez-Zamora et al. [17] suggest that this is the case.
During the experiments, a significant and not deliberate power drift in the HeNe laser was observed. This drift was not documented in [17]; however, such behaviour was previously reported by Klingbeil [45], who implemented a beam splitter and a reference detector to correct for the effect of the laser power drift. While the setup by Klingbeil [45] clearly mitigates any problem caused by the laser beam drift, space constraints made the use of a second photodetector difficult. The correction of the laser drift was, nevertheless, accomplished by a careful averaging and iteration procedure where feed injection was interrupted in a periodic fashion so that the variation in I 0 during the experiment could be documented.
3. RESULTS
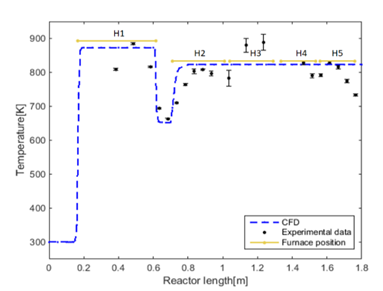
Fig. 5 compares the gas temperature profile measured along the reactor with the CFD predictions. The experimental data were obtained at a nominal temperature of 823 K in the reaction zone, when particles and gas were flowing at the values described in the experimental section.
Source: Created by the authors.
Fig. 5 Comparison of the temperature profiles along the reactor predicted by the CFD model and measured in the experiments. Error bars represent one standard deviation after three measurements
Although there are differences between the CFD simulations and the experiments, particularly at the reactor’s inlet and outlet, the agreement is acceptable in the Reaction zone, where the optical measurements were taken and which was the focus of this analysis.
Most importantly, the measurements as well as the simulations indicate that a relatively flat profile can be obtained after the feed enters the reactor and the temperature significantly falls at around 0.6 m. There is some uncertainty in the measurements between 1.1 m and 1.3 m, when using a long thermocouple became difficult. While the results in Fig. 5 were obtained at a nominal temperature of 823 K, a similar profile is expected in the lower temperature range (373 K to 673 K) where the optical measurements were performed.
3.1 Correction of the Optical Signal because of Laser Power Drift
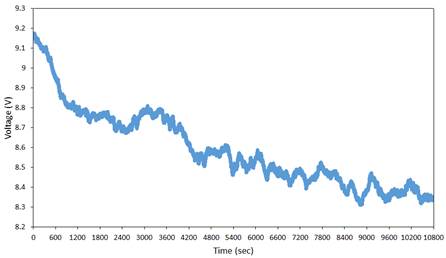
Fig. 6 presents evidence of the laser power drift when the distance between the laser and the photodetector was 5 cm and only the optical chopper was between them. After two hours of laser operation (7200 s), the fluctuations in laser intensity decreased over time but were still very intense; furthermore, there was no clear pattern. The results in Figure 6 were observed in different opportunities and could not be related to any other variable in the lab or the experiment.
Source: Created by the authors.
Fig. 6 Variation in laser intensity over time. Only the chopper was placed between the laser and the detector
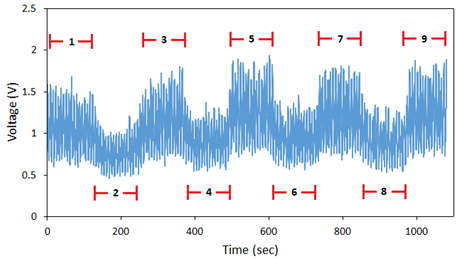
To correct the signal for the laser power drift documented in Fig. 6, the experiments incorporated an iterative injection of feed and N2. Basically, a roughly 2-min feed injection was alternated with a 2-min injection of N2 with a volumetric flow equivalent to the feed flow. While I was recorded when the feed was flowing, I 0 was recorded in the presence of N2. Fig. 7 illustrates the detector output during the experiments.
Source: Created by the authors.
Fig. 7 Typical variation of laser intensity over time in an experiment with catalyst and 1-hexene. Uneven numbers indicate an injection of N2; even numbers, an injection of 1-hexene
The uneven numbers (1, 3, 5, 7, and 9), i.e., zones with higher voltage, indicate periods of time when only nitrogen and catalyst were flowing. Even numbers (2, 4, 6, and 8) represent periods of time when the feed (1-hexene) was injected and N2 injection stopped, always in the presence of particles. While the high-frequency peaks and valleys in the signal were caused by the detection of particles passing through the laser signal, the average signal between each section also changed because of the laser drift. As some disruption can be expected when the flow is switched from N2 to the feed and vice-versa, the following procedure was applied to obtain an average laser signal in each zone. The time at which the highest value of intensity during N2 Injection i takes place was determined.
Then, the intensity data 15 seconds before and 15 seconds after that maximum were averaged.
This averaging process was repeated for N2 injection i+2 so that a total of 60 s was recorded. The average intensity value of these 60 s was the value of I 0 used to compute I/I 0 for feed Injection i + 1.
I was then simply calculated as the average signal 60 s after the feed injection had started. I/I 0 for feed Injection i + 1 was then calculated as the ratio of the average values of I 0 , and I was computed as previously described.
3.2 Optical measurements
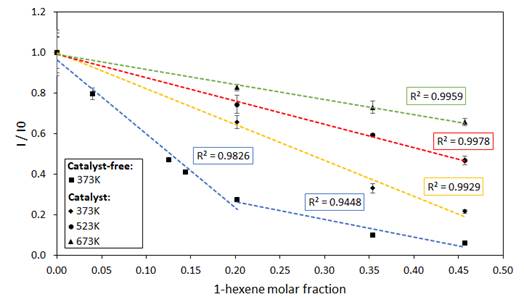
Fig. 8 presents the variation in fractional transmission with the molar fraction of 1-hexene with and without particles and at different temperatures.
Source: Created by the authors.
Fig. 8 Variation in fractional transmission (I/ I 0 ) as a function of the molar fraction of 1-hexene at different temperatures and in the presence and absence of a catalyst
As the molar fraction of 1-hexene increases, I/I 0 decreases because the amount of absorbed light is higher.
Interestingly, at 373 K and in the absence of a catalyst, when the molar fraction is only 0.45, I/I 0 is already almost 0, which indicates the high sensitivity of the optical system to the concentration of 1-hexene.
At the same temperature and without a catalyst, the variation of I/I 0 with the molar fraction of 1-hexene indicates that, when the molar fraction of 1-hexene is higher than 0.2, the system does not obey Beer-Lambert’s law, i.e., I/I 0 does not linearly vary with the concentration of 1-hexene. The nonlinearity of Beer-Lambert’s law in concentrations higher than 10 mM has been previously reported [46].
In turn, a linear trend was obtained when the variation of I/I 0 with the molar fraction of 1-hexene was evaluated at the same temperature (373 K) but in the presence of an equilibrated catalyst. The error bars of catalyst-laden experiments are larger than those of the catalyst-free trials, as one would expect given the random noise that the particle flow causes.
Furthermore, the value of I/I 0 , at the same molar fraction of 1-hexene, increased.
This result was somehow unexpected as light scattering should decrease the value of I0 in a magnitude similar to the reduction in I because both depend on the number of particles flowing in the system.
One possible explanation for the increase in I/I 0 in the presence of the catalyst is the absorption of 1-hexene in the catalyst. 1-hexene absorption would decrease the amount of 1-hexene present in the homogeneous phase and, therefore, the value of i would be higher in the presence of a catalyst. Nevertheless, the results at 373 K in the presence and absence of a catalyst are encouraging as they indicate that the measurement of 1-hexene in the reactor in the presence of a catalyst is possible and that Beer-Lambert’s law can be used to estimate the 1-hexene concentration in the range of molar fractions in Fig. 8.
In the experiments at higher temperatures in Fig. 8 (all of them in the presence of a catalyst), it is evident that, at a given value of 1-hexene, fractional transmission increases as molar concentration increases. This was expected because the higher the temperature, the lower the molar concentration of 1- hexene.
Fig. 9 presents the same data as Fig. 8, but this time the 1-hexene concentration on the x-axis is expressed as a molar concentration instead of a molar fraction.
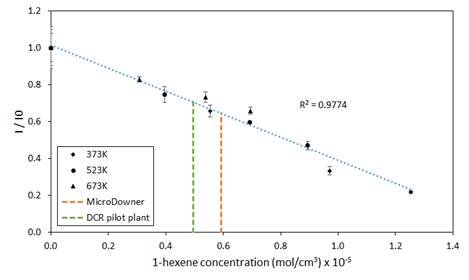
Clearly, all the temperature lines collapse into a single line. This result indicates that, even in the presence of catalyst particles, this method could track the conversion of 1-hexene in a temperature range relevant for certain refinery processes (673 K). Although the absorption cross section of 1-hexene depends on temperature, in the range evaluated in this study, that dependence was low, an observation that further supports the potential application of this laser technique for the evaluation of the conversion of hydrocarbons during refinery processes.
4. CONCLUSIONS
As demonstrated by CFD simulation and experimental measurements, the laboratory-scale downer unit that allows optical access used in these experiments can operate in conditions where heterogeneous catalytic reactions take place. The optical setup described by Lopez-Zamora et al. [17], which includes a He-Ne laser operating at 3.39 µm, presents a significant drift that can be corrected without the need for a beam splitter and a reference detector if the experiments can alternate between a non-absorbing species (such as N2) and the feed (1-hexene in our experiments).
The absorption of 1-hexene at the MIR frequency of the laser used in the experiments was high. In fact, the fractional absorption of the absorbing path length was close to zero (0.013 m) at 1-hexene concentrations higher than 1.254 x 10⁻⁵ mol/cm3. Nevertheless, in the temperature range between 373 K and 673 K, even in the presence of a catalyst, there was a linear response of the fractional absorption as a function of the 1-hexene molar fraction. It even seems possible to use a single calibration curve to determine the 1-hexene concentration for all the temperature and concentration ranges in this study. The results indicate that these systems can be confidently used for in-situ and real-time characterization of the progress of solid catalytic reactions.

