


 English (pdf)
 Article in xml format
 Article references
 Send this article by e-mail
 Cited by SciELO
  Cited by Google
  Similars in
SciELO
Similars in
SciELO  Similars in Google
 Permalink
1. INTRODUCTION
Parkinson’s disease (PD) is a neurodegenerative and progressive disorder that affects motor and cognitive functions [1] and nearly 1 % of the population over the age of 60 [2]. According to Magill et al., PD is associated with an increment in the oscillatory activity in the outer and intern part of the globus pallidus and particularly in the neurons of the subthalamic nucleus (STN) [3][4]. There are quite effective medications to treat the motor symptoms of PD. Nevertheless, in advanced stages, the patient can exhibit medication-resistance, which is routinely treated with Deep Brain Stimulation (DBS) [1]. Since its approval by the FDA in 2002, more than 70000 patients have undergone DBS surgery [5].
This procedure frequently uses stereotactic Magnetic Resonance Imaging (MRI) to identify the target approximately in the middle of the STN [6]. The coordinates are calculated referring to a stereotactic frame placed on the patient’s head. The mid-commissural point is marked in the MRI as the origin of an orthogonal coordinate system defined by the anterior and posterior commissures, known as AC-PC. The AC-PC line defines the y-axis, while the AC-PC plane defines the coplanar x-y counterpart [7]. The gold standard method for targeting the sensorimotor part of the STN is microelectrode recording (MER) [8], but this is still a matter of debate [9].
The targeting procedure with MER is confirmed and refined intraoperatively by a neurophysiologist or a functional neurosurgeon [6]. MER can capture the electrical activity of a single neuron and groups of few neurons [8], and it can be used to assess neurophysiological parameters such as local field potentials (LFPs), the shape and rate of spikes (firing rate), and the background noise level [6].
The electrical activity is mapped along a transversal trajectory usually starting 10 mm above the expected target [6] and ending at the bottom of the STN or the border between the STN and the substantia nigra pars reticulata (SNr). The distance between the electrode’s tip and such planned target (estimated distance to target, EDT [6]) is measured in the z-axis (perpendicular to the AC-PC plane).
During surgery, MER and test stimulation are used to improve the targeting accuracy [10]. It has been established that the procedure’s prognosis depends on a precise localization of the surgical target [11]. When the electrode is finally placed, the specialist programs the stimulation parameters; typically, 1-3 V, 0.1 ms, and 150 Hz [12]. The treatment does not finish with the implantation of the stimulation electrode. After the DBS electrode is fixed, the final location is confirmed with MRI or computed tomography. Subsequently, the stimulation parameters could be adjusted postsurgically to improve the treatment [13].
The effectiveness of this surgical procedure depends on the correct placement of the microelectrode, a laborious task due to the small size and intrinsic displacement of the structures involved [14] [15]. Small deviations of the electrode’s position (~1 mm) produce alterations in the electric field around the STN, affecting other neighboring structures [12]. An incorrect positioning of the target, which has been reported in nearly 12.5 % of the procedures [16], can lead to additional interventions, increasing the risk of side effects such as intracranial hemorrhage (up to 10 %), stroke (up to 2 %), infection (up to 15 %), and even death (up to 4.4 %) [5]. Regardless of the use of MRI and the stereotactic frames, DBS surgeries still have a subjective component when the correct placement of the electrode is evaluated intraoperatively by means of MER [17].
Several studies agree on the fact that an increased synchronized oscillatory activity across the cortico-basal ganglia pathways is a phenomenon associated with PD [18]. This augmented activity generates an increased power in LFP recordings [19], mainly in the beta and gamma bands.
The beta band is mostly divided into low-band (13-20 Hz) and high-band (21-35 or 21-40 Hz) [20]. According to Kühn et al., the STN has an elevated frequency power in the beta band associated with bradykinesia and rigidity instead of tremor, which might serve as a potential biomarker [21],[22]. Excessive beta oscillations produce akinetic-rigid symptoms in PD, although the underlying mechanisms remain unclear. This beta activity is suppressed by levodopa treatment and DBS, which improve the motor performance, i.e., they produce an amelioration of the rigidity and bradykinesia (in healthy subjects, beta activity is suppressed during movement execution) [23], [24]. In turn, in PD patients, the ventral region and the ventral medial non oscillatory region of the STN have reduced beta activity and increased gamma activity [25].
The gamma band is divided into low-gamma (40-80 Hz), high-gamma (80-50 Hz), and broadband gamma (40-150 Hz) bands [26]. However, different authors use different reference values; for instance, the broadest gamma band has been reported in the 40-200 Hz range. Although the gamma band exhibits less power than the beta band when the microelectrode is approaching the STN [27], [28], [29], there is a tendency toward increased activity in the low-gamma band during periods of stronger tremors [26]. Another band of interest is High-Frequency Oscillations (HFO), defined by the frequency range between 200 and 400 Hz. In contrast to the beta band, gamma and HFO bands have a higher spectral density when dopamine is delivered, suggesting that these bands are pro-kinetic. It is not completely understood how the abnormal activity of the aforementioned bands is related to hypo-kinetic motor symptoms in PD [30].
Therefore, the frequency components of MER, associated with the occurrence of specific rhythms, are fundamental in the study of this type of signals.
The aforementioned ideas led us to hypothesize that the variation of frequency-related indexes could help us to identify the surgical target (STN) intraoperatively in a quantitative way.
Thus, we assessed a methodology to identify the STN based on spectral and parametric (autoregressive) analyses applied to the beta, gamma, and HFO bands of MER signals acquired from patients with PD. We computed five variables as sources of information of the target location: variation of parameters of an autoregressive model of MER signals, the derivative of such parameters, a parametric power spectral estimation, the ratio between high- and low-frequency components (H/L ratio), and its derivative.
We analyzed the values of the evaluated indexes in order to establish the final location of the electrode’s tip on the z-axis of the AC-PC plane.
2. MATERIALS AND METHODS
2.1 Experimental data
We acquired signals from microelectrode recordings (MER) in 11 patients (8 males and 3 females) with advanced Parkinson’s disease undergoing standard DBS surgery of the bilateral STN. This study was conducted observing the protocol approved by the local ethics committee of Centros Especializados San Vicente Fundación (Rionegro, Colombia).
The medical staff recorded up to four channels per microelectrode. All the recordings were obtained while the patients were awake, at rest, and monitored for alertness. The STN was anatomically localized using preoperative
MRI and then intra-operatively using its firing pattern and background activity.
A Guideline 4000 LP+ microTargeting system (FHC, Inc) was employed to acquire the MER signals. The coordinates of the planned surgical targets are summarized in Table 1.
Table 1 Planned targets for both right and left hemispheres in mm (mean ± standard deviation)
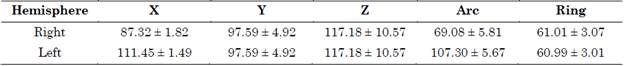
Source: Created by the authors.
LFPs were obtained from the basal ganglia along the intra-operative trajectory. The theoretical (planned) coordinate was compared with the final placement of the electrode’s distal tip and the differences were computed in terms of error in each axis.
2.2 Signal acquisition and preprocessing
The MER signals were acquired with a sampling rate of 48 kHz and a 16-bit analog-to-digital converter. The equipment applied a digital band-pass filter with two cutoff frequencies, 0.03 and 2.5 kHz (by default), and a power line noise adaptive filter. The cutoff frequencies were modified to obtain an optimal visualization of the spikes according to the neural activity; this process was completed by the surgery staff during data acquisition. The filter bandwidth was set from 5 to 3000 Hz to attenuate low-frequency noise.
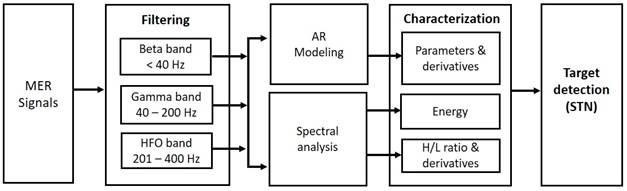
An offline filtering stage was applied to analyze the beta, gamma, and HFO bands separately. To retrieve the beta band, we implemented a lowpass FIR filter with an order of 1500 and a cutoff frequency of 40 Hz. In turn, for the gamma and HFO bands, we used bandpass topologies with 40-200 Hz and 201-400 Hz cutoff frequencies, respectively. Afterwards, down sampling was applied at 192 Hz for the beta band analysis, and at 800 Hz for the gamma/HFO analysis.
The characterization and modeling techniques were computed offline in MATLAB (The Mathworks, Inc.). Fig. 1 summarizes the proposed methodology.
2.3 Modeling and evaluation of parameters
An auto-regressive structure (AR) is defined as a difference equation of a discrete linear system with a random error term instead of an input signal (1):
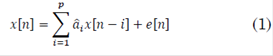
Where e[n] is white noise, x[n] is the time series to be modeled (MER signals in this case),  are the parameters and p is the order of the model. The order was estimated by the small sample-size corrected Akaike's Information Criterion (AICc) for three frequency bands, i.e. beta, gamma and HFO. AICc was computed as follows (2), [31]:
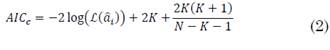
Where  is the maximum likelihood estimator of the parameters
  , k is the asymptotic bias correction term and N is the length of the time series, in this case, the MER signal. Although AICc is valid for signals with any spectral component, a higher order is expected if the bandwidth also increases.
The proper order for each band was selected and after that, the fitting of each model was computed at different depths of the trajectory in order to have a quantitative measure of the whole goodness of fit of the models. After selection of the model’s order, the variation of the last parameter  along the surgical track was assessed, aiming to infer dependencies of each parameter with the distance to target.
A cubic interpolation curve with spacing of 0.05 mm was built for each parameter. Afterwards, the derivative of such curve was plotted aiming to detect rapid variations along the surgical track, and both curves were analyzed for the three frequency bands. The maximal value of and its derivative were analyzed as biomarkers of the presence of the STN.
2.4 Spectral estimation
There are different methods to estimate the power spectral density (PSD), nonparametric (FFT based methods) and parametric estimation methods (e.g. Yule-Walker) [32]. However, parametric overcome non-parametric methods in terms of frequency resolution, as it does not suffer from distortions caused by sidelobe leakage effects [33]. Furthermore, parametric methods do not require long segments of data, and they are based on the generation of mathematical models that are able to represent the behavior of the modeled signal, with the help of indexed parameters.
The PSD was estimated via Yule-Walker method for the AR model parameters. This was done for each signal at each recording depth. The Yule-Walker estimation was computed with the biased autocorrelation, given (3):
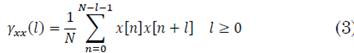
PSD was computed as follows (4), [34]:
Hence, W fi is the phase factor of the FFT.
Subsequently, the PSD was computed for high and low ranges for the beta, gamma and HFO bands. Thus, the total energy at each range was estimated.
Moreover, the total power in the entire band was obtained. The maximal value of energy was also explored as biomarker of the presence of the STN.
2.5 H/L ratio
There are several types of characterization based on the PSD. One of them is the high-to-low (H/L) ratio, which relates the high and low-frequency bands.
It is widely used in biosignals analysis as it gives an idea of the spectral displacement of a specific signal depending on certain events. In MER signals, this concept has been used by Valsky et al. to detect the border between STN and SNr [25].
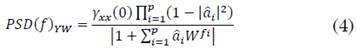
H/L ratio was computed at every depth of each surgical approach, as (5):
Two approaches were carried out, one for the beta band and another for the gamma and HFO bands together.
Frequency ranges were defined according to literature: for beta band, low and high frequencies were delimited by 13-20 Hz and 21-35 Hz, respectively. The second approach involved the ratio between the HFO (201 - 400 Hz) and gamma (50 - 200 Hz) bands.
Afterwards, a sensitivity analysis was performed to identify the change of the H/L ratio with respect to the depth, far and close to the surgical target. It was done by the derivative of the curve H/L vs. depth.
It was also considered the total energy calculated at each depth of the surgical pathway. Like the variation of parameters, H/L ratio was also hypothesized to mark the presence of the STN as well as its derivative.
2.6 Statistical analysis
To compare the target’s localization estimated with the methods developed here, the Kruskal-Wallis test was applied for each studied frequency band. The proposed parameters were studied as variables in the statistical test, with a significance level α=0.05. The variables were: variation of the highest order parameter in the AR model, changes in its derivative value, changes in the energy of the signal, and changes of the H/L ratio and its derivative.
3. RESULTS AND DISCUSSION
Models with an AR structure were identified at each depth using a 17th order for the analysis of the beta band, 19th for gamma, and 20th for HFO, according to the AIC. The accuracy of the models is shown in Table 2.
Table 2 Mean and standard deviation of the goodness of fit of AR models with a 17th order for the beta band, 19 for the gamma, and 20 for the HFO. The mean and standard deviation are related to different measures along the trajectory
Source: Created by the authors.
Missing data represent patients who did not undergo a bilateral DBS surgery or approaches whose bandwidth was not related to the bands of interest.
The accuracy of the models decreased at higher frequency ranges. While the fit in the beta band was above 90 %, in the gamma band it was around 85 %; and, in HFO, lower than 70 % with a higher standard deviation. Furthermore, the order required to represent signals with higher spectral components was also higher (see Table 2), which is the expected behavior in AR models. Moreover, the standard deviation also increases with the frequency range, which means that the model is worse at some depths of the trajectory. Thus, in contrast to the beta band, low-order AR models seem to be unsuitable to characterize the dynamics of the gamma and HFO bands.
The variability of each parameter of the different AR models in each surgical approach was analyzed. It was found that the parameters with the most notable variations along the surgical track, were the 14, 15, 16 and 17 parameters for the beta band. Finally, the 17 was selected as it expressed the most remarkable differentiation when comparing its value at depths close to the target, and the interpolation curve was plotted.
The derivative of the interpolation curve was built.
It was found that in 77 % of the analyzed cases, the point of maximal change in beta band and parameter 17 matched the points with maximal power in the surgical approaches.
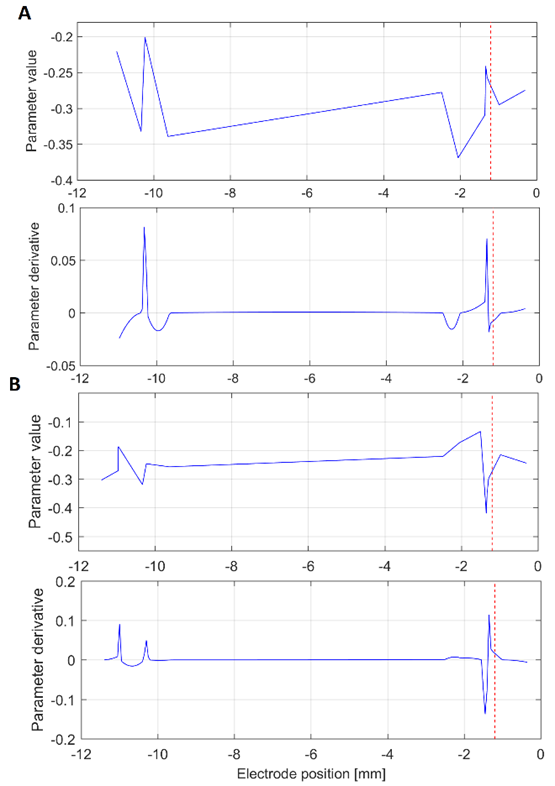
The Fig. 2A illustrates an interesting case in which, despite of the maximal value of the derivative is not close to the target, is clear that its vicinity has a local maximum. This effect was recurrently observed, which suggests interesting correspondence between the target and this proposed index. The reason why the target and the maximum value do not correspond exactly requires complementary analysis because it could be related to the mechanical accuracy of the stereotactic frame.
Source: Created by the authors.
Fig. 2 Interpolation curve (top) and derivative (bottom) of the 17th parameter of the (A) central and (B) lateral electrodes. The target at -1.2 mm is shown as a red dashed line. This analysis was carried out in the beta band
Like in the beta band, the variability of the parameters in the gamma and HFO bands was evaluated. Parameters 19 and 20 were selected for the gamma and HFO bands, respectively, since they exhibited the most remarkable variation in the vicinity of the target. Despite the low accuracy obtained for these bands, specially the HFO (see Table 2), the analysis was also applied to the beta band.
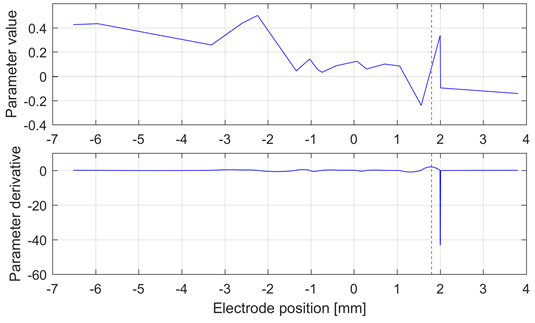
Fig. 3 shows the best result obtained for the HFO band, in which the maximal variation of the derivative of the 20th parameter is close to the target. However, this result is not consistent in the whole database, as expected based on the low accuracy of the models for these frequency bands.
Source: Created by the authors.
Fig. 3 Interpolation curve (top) and derivative (bottom) of the 20th parameter of the lateral electrode in the left hemisphere of Patient 5. The target at 1.8 mm is shown as a red dashed line. This analysis was carried out in the HFO band. This patient exhibited the best performance with this method
As previously mentioned concerning frequency domain analysis, this study was based on the idea that the energy of beta and gamma bands increases in the proximity of the STN and this change may be clinically useful to determine the electrode position intra-operatively [21].
Fig. 4 and Fig. 5 illustrate changes in energy in the assessed bands along the surgical track in two patients.
Source: Created by the authors.
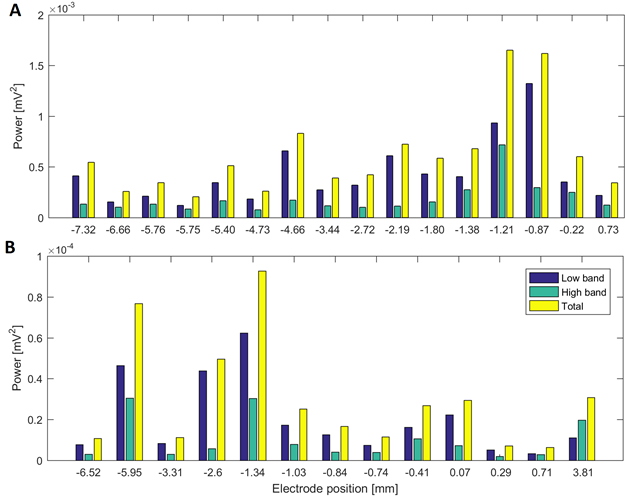
Fig. 4 Power in low and high beta bands at different electrode positions of a surgical approach in two patients: (A) power in the surgical trajectory on the left hemisphere with lateral electrode in Patient 2 (target at 0 mm) and (B) surgical approach of Patient 4 in the left hemisphere with central electrode (target at 0 mm)
Source: Created by the authors.
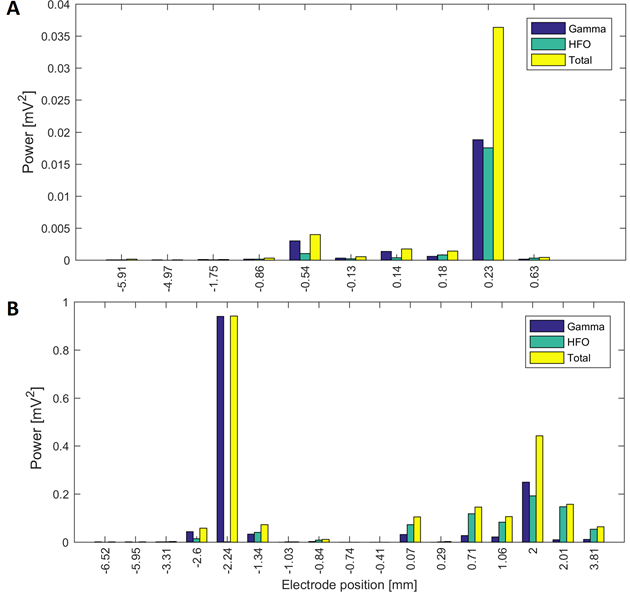
Fig. 5 Power in the gamma and HFO bands at different electrode positions of a surgical approach in two patients: (A) power in the surgical trajectory on the right hemisphere with central electrode in Patient 6 (target at 0.2 mm) and (B) surgical approach of Patient 4 in the left hemisphere with central electrode (target at 0 mm)
In the beta band, most cases exhibit the highest power near the target. We found that the variation of parameter 17 in the beta band exhibited agreement between the points of maximal energy and its maximal change (which may suggest the presence of the STN [21]) in all the cases.
For gamma/HFO bands, this behavior is not always present and a pattern in the surgical path was not detected, despite some exceptions.
Patients 1, 5, 7 and 11 had tracks with distance to target smaller than 1.5 mm, simultaneously in the three frequency bands. Patient 3 had maximal energy values at 1 mm to the target in gamma and HFO bands, whilst patients 2, 9 and 10 had maximal values less than 1.5 mm only in the beta band. Fig. 4A and Fig.5A show variations in the power of the patient 6 in the central electrode of the right hemisphere, for beta and gamma/HFO bands, respectively. In such patient, the vicinity of the target contains the highest energy in beta and HFO bands that could be taken as a careless confirmation of the previous hypothesis. However, some recordings exhibited an important energy content in beta band at points far from the target (see Fig. 4B). In such cases, this spectral content affects other frequency bands, such as the gamma shown in the Fig. 5B
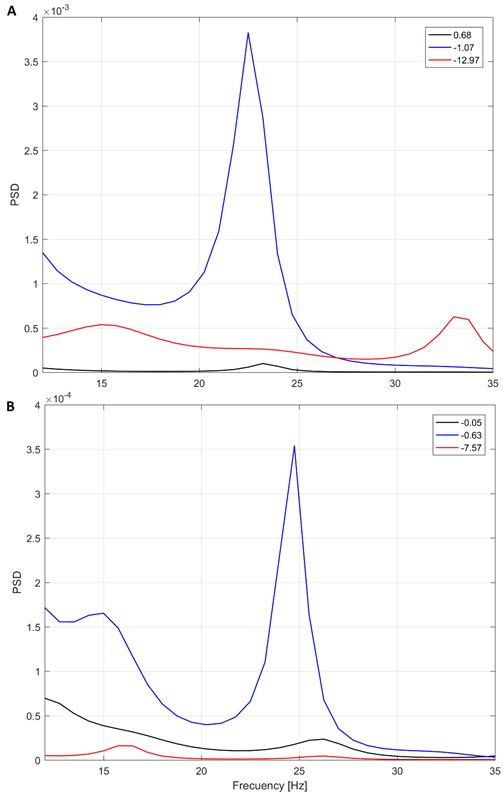
The analysis was complemented with the PSD-based spectral analysis. Fig. 6 shows the PSD at three depths in two patients.
Source: Created by the authors.
Fig. 6 Yule-Walker PSD for three different depths in patient 5 (A) and 2 (B). Target at 0 mm (found intraoperatively)
We expected an increased PSD in the vicinity of the target. In contrast, as the previous analysis shown, the peaks in the PSD did not correlate to the depth in some cases.
In fact, we found interesting cases such as the illustrated in the Fig. 6. Note that the peak in the beta band at -1.07 mm from the target in Fig. 6A is quite distinguished, instead to expected peak at 0.68 mm (closer to the target in patient 5, that is 0 mm). This behavior is like the shown in Fig. 4B, in which the closest point to target does not have the highest power.
There were found energy profiles with two peaks, one distant (the maximum) and another close to the target.
In many cases, the energy seemed to be affected by artifacts that could not be deleted with the preprocessing stage.
These distant points to target could be disregarded by a simple restriction in the search distance. Since the stereotactic frame has an intrinsic error targeting around 3 mm [35], this could be a suitable search distance in the z plane.
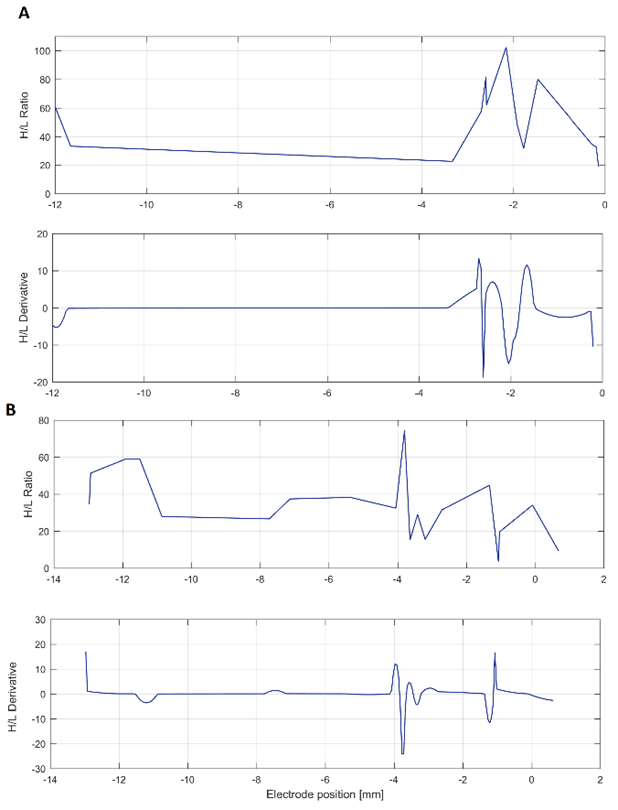
Regarding to the H/L ratio, it was detected a high variation at the points with maximal beta power in approximately 50 % of the cases. However, due to the intrinsic inter and intra-patients variability, evidenced in the middle graphs on Fig. 7, is not possible to determine an exact value of the H/L ratio that can properly identify the STN of all subjects. Although positions of the maximal value of H/L ratio and its derivative do not match exactly with the position of the target, they were found to be reasonably close. In 8 of the 17 surgical approaches analyzed, these values were in the range of ±1.5 mm from the target position found during the surgery.
Source: Created by the authors.
Fig. 7 H/L H/L ratio and its derivative. Two illustrative cases are shown, both with the target placed at 0 mm. (A) shows the patient 7, with maximal variation 2 mm before the target, whereas (B) corresponds to patient 10, with maximal variation at 4 mm before the target, approximately
Although the measurement of the H/L ratio variation along the surgical approaches suggests that there is a change in the PSD distribution in the surroundings of the STN, it could not be confirmed in this experiment.
Even though we replicated the same procedure we used for the gamma/HFO bands with the H/L ratio, we found that such index is not a good biomarker, in contrast with its derivative. The latter works well but only in the left hemisphere.
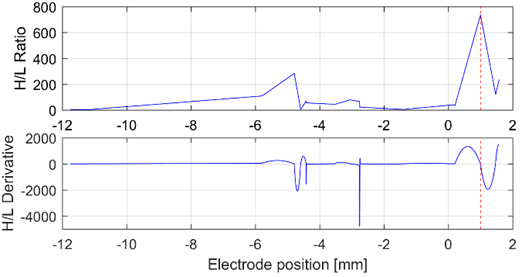
Although it could be explained by intrinsic differences in the surgical approach, further efforts must be made in order to explain this behavior. In eight patients, the H/L ratio or its derivative achieved an error under 1.5 mm. However, no patient could be completely characterized by both indexes in all the channels. Fig. 8 illustrates the variation of such indexes in the left hemisphere of Patient 13.
Source: Created by the authors.
Fig. 8 H/L ratio and its derivative analyzed from the bands gamma and HFO, in the left hemisphere of patient 13. The H/L ratio allows to infer the presence of the target (the red dashed line at 1 mm)
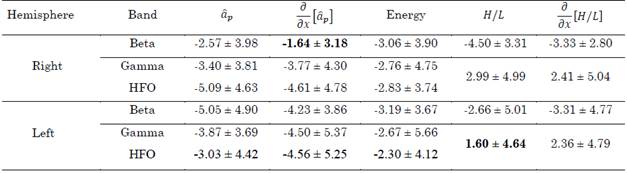
Table 3 summarizes the errors in distance produced by the aforementioned methods (i.e., the distance between the surgical target and the points with maximal energy,  and H/L ratio as well as their derivatives). These values were computed for the beta, gamma, and HFO bands. In total, 29 approaches were analyzed.
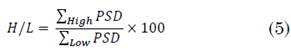
Table 3 Distance to target in mm achieved by the proposed methods in the beta, gamma, and HFO bands. The best results are highlighted in bold
Source: Created by the authors.
Out of that group, the following tracks were in a range of ± 1.5 mm from the target position found surgically: in the beta band, in the same order as presented in Table 3
 , energy, H/L, and
  , 10, 9, 10, 3, and 7 passes were in this range, respectively; in the gamma band, 5, 8, 7, 7, and 5 passes were in the range; and in the HFO band, 4, 4, 10, 7 and 5 passes were in the range.
According to Table 3, the best results were achieved with the derivate of the 17th parameter in the beta band and the H/L ratio in the gamma/HFO bands. These indexes are in agreement with results reported in the literature. However, these results are only valid for one hemisphere, since in the opposite hemisphere the indexes produced higher errors. Thus, this behavior cannot be generalized. Although more consistent results were obtained with the H/L ratio and its derivative regarding the gamma/HFO bands in both hemispheres, the standard deviation was too high in all the cases, which, in addition to the poor confidence in the use of energy in bands, suggests caution when this index is employed.
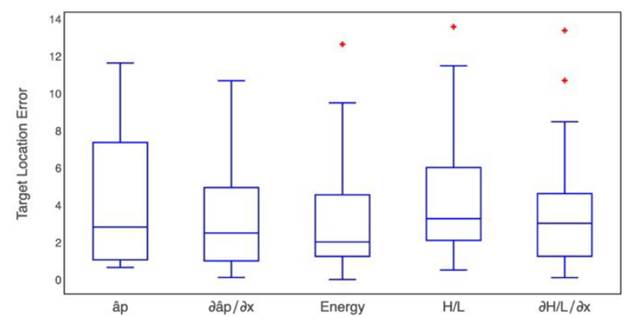
To compare the results of each method evaluated here, we estimated their error in target location. Target position error was defined as the absolute value of the difference between the surgical position reported by the surgeon and the estimated location by each proposed method. Fig. 9 shows the box-plot of the target position error in the beta band produced by each one of the proposed methods. Additionally, the Kruskal-Wallis test retrieved a p-value of 0.282 (α=0.05).
Source: Created by the authors.
Fig. 9 Box-plot for the target position error obtained by each one of the five proposed methods for the beta band
It does not reject the null hypothesis that all data groups come from the same distribution, therefore, there are not differences among the proposed methods, but the lower dispersion was obtained in the index  .
.
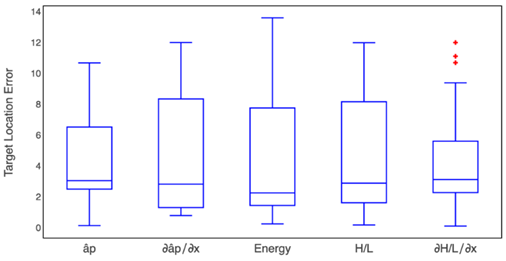
In a similar way, Fig. 10 shows the box-plot of the target location error in the gamma band. Furthermore, the Kruskal-Wallis test retrieved a p-value of 0.92, and, in the beta band, there were no differences among the methods.
Source: Created by the authors.
Fig. 10 Box-plot of the target position error obtained by each one of the five proposed methods for the gamma band
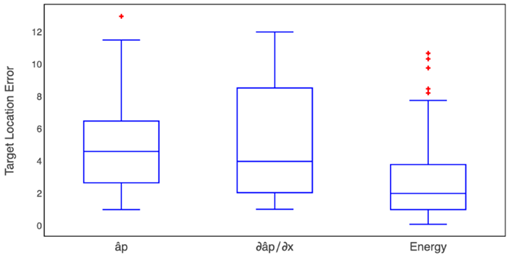
The Kruskal-Wallis test of the HFO band presented a p-value of 0.003885, which indicates a difference between some pairs of methods. To identify the methods between which there were differences, we implemented a pairwise comparisons using the Wilcoxon rank-sum test with a Bonferroni p-value adjustment method.
In this case, we obtained p-values of 0.01 and 0.012 between the energy method and the method, respectively.Fig. 11 shows the box-plot of the target location error in the HFO band.
Source: Created by the authors.
Fig. 11 Box-plot of the target position error obtained by three proposed methods for the HFO band where statistical differences were found
Results of the current work are comparable to the reported error of STN DBS targeting using other methods. With traditional stereotactic frames, an error of 3.1 ± 1.41 mm was reported [35]. However, image-based methods have improved this result. For instance, Starr et al. achieved a mean absolute tip error of 2.2 ± 0.92 mm using interventional MR (iMR) imaging in STN DBS implants [35], whilst Shahlaie et al. obtained 1.65 ± 0.19 mm using the same techniques [36]. On the other hand, Burchiel et al. reported an accuracy of electrode placement of 1.59 ± 1.11 mm using intraoperative computed tomography [37]. Also, Kochanski et al. reported an average MER track error per hemisphere of 1.75 ± 0.09 mm using intraoperative computed tomography extrapolation [38].
In terms of mean error, our results are also comparable to the work published by Brahimaj et al. [39]. They combined MER signals with computed tomography, achieving a radial error of 1.2 ± 0.2 mm.
According to results, AR derived descriptors and H/L ratio are interesting as features for the automatic detection of the surgical target in DBS procedures.
Whilst autoregressive coefficients have not been used for MER characterization, the concept behind H/L ratio was used successfully to detect STN borders with Hidden Markov Models: Valsky et al. achieved the best reported accuracy for STN detection, i.e. 0.04 ± 0.18 mm [25].
Moreover, MER based analyses have used other features for classification and prediction purposes [40], which can be grouped as follows [41]: spike-independent features (EDT, basal amplitude, signal kurtosis, curve length, thresholds, peaks, energy, zero crossings, normalized RMS, PSD related features, phase amplitude coupling); and spike-dependent features (inter-spike intervals, bursting and firing rates). For instance, Wong et al. [42] achieved detection errors of -0.063 ± 0.44 mm for the STN-entry, and -0.04 ± 0.31 mm for the STN-exit. They used both groups of features with a fuzzy c-means clustering algorithm. Despite the aforementioned results, spike-dependent features are susceptible to errors and they have high computational complexity, especially for real-time applications with longer recordings [41]. So, there is a recent trend to use spike-independent features instead [41].
In this way, Moran et al. [6] obtained an error of 0.30 ± 0.28 mm in the prediction of the center of the STN, by means of RMS and a Bayesian classifier.
Furthermore, Zaidel et al. [43] detected the STN-entry, the ventral boundary of the dorsolateral oscillatory region, and the STN-exit with an error of -0.09 ± 0.35, -0.27 ± 0.58, and -0.20 ± 0.33 mm, respectively. They used the normalized RMS and PSD related features together with Hidden Markov Models.
Other works based on machine learning algorithms are not comparable to ours, since they report performance measures rather than error between real and theoretical distances [44][45][46].
Thus, we propose as future work, the use of the assessed parameters not individually but together with other spike-independent features reported on literature as input of classification models, aiming to strengthen the feature space improving the detection performance. One advantage of the assessed parameters is their low computational complexity. This may have potential use in the intraoperative environment as a tool for detection of basal ganglia during DBS procedures aimed with machine learning techniques.
As limitation, it was not possible to determine whether the deviations of the planned target vs. the real one produce alterations in the effectiveness of the DBS procedure. This procedure requires post-surgical tomography. Furthermore, due to the retrospective nature of the study, there was not control over the recording points.
Equispaced and close points are recommended in order to stablish more precise dependencies between the distance to target and the evaluated parameters.
Moreover, the filtering stage carried out at surgery room depends of the surgeon criteria; in this case, open bands are recommended, because restrictions in the bandwidth led us to discard a significant amount of MER signals, since they did not include the whole frequency range necessary to analyze beta, gamma and HFO bands. Finally, the presence of noise was problematic in this study. We observed cases in which, despite of the presence of the characteristic spikes related to STN, low and high frequency noise appear even in the bands of interest.
4. CONCLUSIONS
In this study, we proposed and assessed five indexes based on MER signals for target localization in DBS procedures. In contrast to the main hypothesis in this paper, neither the energy computed from the Yule-Walker PSD nor the variation of parameters of AR models helped us to correctly identify the surgical target because they produced errors above 2 mm.
However, the analysis of the derivative of the parameters of the AR models in the beta band may suggest a more accurate STN identification because they are presumably less affected by artifacts that may contribute to an unexpected increment in total power. The derivative of the last parameter of the beta band produced an error similar to that obtained with the computed tomography without MER. Furthermore, the H/L ratio computed from the gamma/HFO bands also produced errors similar to those of image-based methods. However, its results are consistent only for one hemisphere and intrinsic characteristics of the surgical procedure must be considered in order to determine the factors that hinder the generalization of the methodology presented here. Further efforts must be made to improve target localization based on the methods introduced in this study together with other spike-independent features because they are simple, can be applied in real time, and do not need medical images.

