


 Inglés (pdf)
 Articulo en XML
 Referencias del artículo
 Enviar articulo por email
 Citado por SciELO
  Citado por Google
  Similares en
SciELO
Similares en
SciELO  Similares en Google
 Permalink
1. INTRODUCTION
In 2020, thousands of cases of SARS-CoV-2 infection were reported around the world [1]. The first known case was identified on December 29th, 2019, in Wuhan, the capital of the Hubei province in China. This first patient presented symptoms of pneumonia [2]- a pattern increasingly observed in people with SARS-CoV-2 who had the Middle East Respiratory Syndrome (MERS) in the initial phase [2].
In January 2020, this disease was confirmed to be highly contagious, with a severity ranging from asymptomatic to lethal [3], [4], which favors its propagation. Its rapid spread around the world forced governments to restrict economic, social, and cultural activities in the hope of reducing the number of people affected by it. These polices, however, negatively affected the global development of cities and communities. For instance, the demand for tourism and gastronomy decreased, leading to a 20 % reduction in causing the agricultural production to drop by 20 % [5]. Likewise, due to the implementation of biosafety and physical distancing protocols seeking to prevent infections, educational institutions had to be closed [6], [5]. This disease has also had an impact on the current population index. By the end of October 2020, approximately 2.391.405 people in the world had died of SARS-CoV-2 [7].
These events encouraged researchers to focus on two fundamental topics: (1) developing a vaccine to prevent the disease and (2) studying its evolution over time in infected individuals. Regarding the latter, various deterministic [8], [9] and stochastic [10], [11] methodologies and models have been proposed, which, when applied or adapted to a set of population data and limited to a series of assumptions linked to the model used, provide tools to adjust and predict the disease dynamics. This, in turn, contributes to a better decision making and to the analysis of hypothetical situations that help to identify potential risk factors or improvements, which are aspects that serve as guidelines to devise strategies to counteract the rapid evolution of the disease and minimize the death rate.
Deterministic models are designed or adapted. Their application demands reconsidering a set of relationships between variables, as well as several assumptions that delimit and define the situation to be modeled. They, thus, result in sophisticated dynamic systems requiring complex analysis of stability and studies that provide certainty on the proposed model and eliminate the uncertainty of possible contradictions regarding singularities in their interpretations, as reported in [12]-[14]. Given the approximation and adaptation process of the classical dynamical models that implement integer differential operators, we will here focus on a special type of deterministic models: fractional dynamical systems. These systems base the structures of immediate change in time on the fractional definitions of the derivative-a concept that generalizes the classical definition of infinitesimal change given by Newton and Leibniz of infinitesimal change to non-integer value.
The theory of fractional calculus broadens the possibilities of the classical differential models. It generates systems whose equations establish dynamics that are more sensitive to change, thereby leading to an improvement in modeling the coupling of the real phenomena.
This gives consistency to the models-order models because they allow for a more detailed description of the memory and the hereditary properties of the processes [15]. Nowadays, this generalization of dynamic systems has proven to be very useful to model not only biological but also physical, chemical, and economic systems, among others [15]. Thus, implementing fractional orders in differential systems not only enables a wider study of the models but also improves the accuracy of the obtained results due to the limitations of complex integer models with few coefficients [16], [17], as in the case of SARS-CoV-2 propagation.
Given the difficulties of the Susceptible‐Infectious‐Recovered (SIR) integer model to suit complex behaviors using few coefficients (such as those that depend on complex interactions among the community regarding sociological, economic, and political aspects [18]), we propose the use of a fractional SIR model to describe SARS-CoV-2 propagation in two different countries (France and Colombia) under two government policy scenarios: ruling during lockdown and ruling before it. France and Colombia were selected as case studies from Europe and Latin-America, respectively.
1.1 Experimental Setup
The propagation of SARS-COV-2 behaves different in different countries, due to the cultural particularities, availability of medical resources and applied politics used to deal with the health crisis, among others. The SIR models are widely used in the literature to describe disease propagation, due to its simplicity and easily interpretation [19]. Unfortunately, this naive model is not always suitable to fit the real data [20]. In this work, a fractional order generalization is applied to model the SARS-COV-2, the models were adjusted to fit the behavior of two datasets from two different countries (France and Colombia), as explained below.
-French dataset: It was obtained from the website of the French Ministry of Solidarity and Health, and its collection and distribution are led by Etalab. Data started to be collected since May 1st, 2020 and are updated daily. In this study, we considered data from May 1st to September 6th, 2020 (i.e., 179 days) because the regulatory policies in France changed dramatically around two weeks after this latter date. For instance, movement outside the country was restricted, and citizens were confined to move in their surroundings as the government imposed a quarantine. For each day, there is a record of the cumulative number of recovered, infected, and dead cases. The number of susceptible people was calculated by subtracting the number of recovered infected, and dead individuals from the total French population reported in [21]. Finally, assuming that the recover people is taken as the quantity that return to their home. The number of people recovered is obtained by assuming that the infected people is healthy after 14 days of first infection [22].
-Colombian dataset: It was obtained from the datos.gov.co website run by the Colombian Ministry of Information Technology and Communications. This public database was specifically created to monitor the evolution of SARS-CoV-2 within the country. It includes data such as date, department, and patients’ age and status. Data started to be collected since March 6th, 2020 and are updated daily. In this study, we considered the period during which the population was under quarantine (from March 24th to July 10th, 2020) (i.e., 80 days). Dates outside this range were not considered because the behavior of the virus may have been different during such days. This dataset monitors 23 variables every day. The number of susceptible people was calculated as the difference between the total population and the sum of the cumulative number of infected, recovered, and dead cases. The number of infected individuals was computed by subtracting the number of deaths and recoveries from the number of daily infected people. Finally, the number of recovered individuals was estimated by adding the daily number of recovered cases reported on the dataset.
1.2 Fractional SIR Model
In this study, we employ Caputo’s fractional derivate [23] because the initial condition problem can be more easily solved with it rather than using other definitions of fractional derivatives [24], [25]. Formally, being the order of the derivative and C D denoting the derivative with respect to Caputo’s derivative, which is defined as in (1).
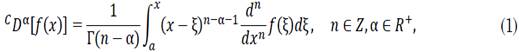
where n-1≤ α ≤ n. The SIR model is the classical model used to analyze the spread of infectious diseases over time in a community whose population is assumed to be constant and where the reinfection rate is negligible. It divides the population into three disjointed sets: susceptible (S), infected (I), and recovered (R).
The SIR model considers a one-way infection transition among the populations sets (S, I, and R). Susceptible individuals could get infected or remain susceptible; infected individuals could only recover or remain infected; and recovered individuals represent the final stage of the model (see Figure 1).
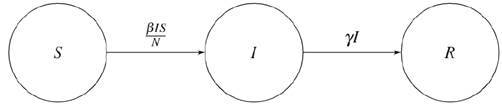
Source: Authors’ own work.
Figure 1 Structure that models the transition process of an infected individual
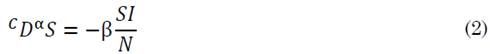
To transit from S to I, a ratio of 1 is assumed because the entire S population is vulnerable to contracting the virus. The probability of infection is calculated by dividing the number of current susceptible individuals, S(t), by the total number of people, N. Finally, the total population is estimated by multiplying the number of infected people over time, I(t), by the expected number of people that an individual infects per day (β). The alpha parameter allows us to model sub-propagations or super-propagations, which are understood as propagation speeds that are lower or higher than those of an entire model with the same coefficients. This effect can be observed in the configuration of interactions between individuals, which are not necessarily homogeneous, and in other factors such as environmental impacts. Formally, the change in the susceptible population is given by (2).
To transit from I to R, a ratio of γ, which will be the proportion of infected individuals recovered per day, is assumed. The probability of recovering from the disease (that all can recover) is 1. Finally, the total population is the number of infected individuals over time, I(t). Formally, the change in the recovered population is given by (3).

Lastly, the equation that represents the infected population is obtained by assuming that the change of the total population with respect to time is a value that is approximately equal to zero. Thus, the following is the expression that models the infected population by (4):

where α, δ, and ϵ are the order of those derived from the susceptible, infected, and recovered populations, respectively. Note that if α= δ= ϵ= 1, the resulting equation is the classical SIR integer order model.
1.3 Fractional Equation Solution Method
The equations of the fractional SIR model are solved using Riemann-Liouville integration, whose solution function is generated from a set of fractional power series expressed as seen in (5).
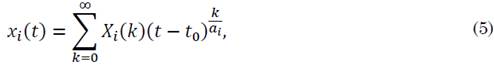
where ai is an integer value (usually the lowest one) for which ai αi is an integer, and coefficients Xi (k) are given by the fractional transformation of the function defined as in (6).
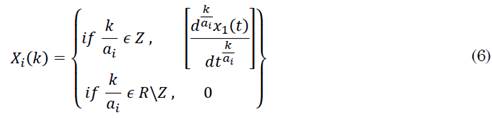
This is known as the fractional transformation method [26], [27]. Solving systems makes it possible to establish generalizations of classical models to study problems under a set of specific assumptions required by the differential system. In broad terms, the solution to non-integer order differential systems provides more degrees of freedom to classical differential equations whose immediate changes with respect to time are fixed. We will apply the fractional calculation mechanics presented earlier to fit real data regarding the evolution of SARS-CoV-2 in its stages of development.
1.4 Evaluation Metrics
The model’s solution offers three uniquely time-dependent functions that describe the evolution of three population sets over time. As observed in the system, the growth of the recovered set depends on the behavior of the infected set; and the growth of this latter is conditioned by the development of the susceptible set. Because of this relationship between the three population sets, we consider that a global evaluation metric that estimates the dispersion of a model with respect to the real values of a community is the most appropriate option [28], [29]. Therefore, in this study, we calculated the fitting error as shown in (7), (8), (9) and (10).
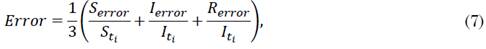


where S, I, and R are the actual data on population dispersion for the susceptible, infected, and recovered sets, respectively. In addition, S*, I*, and R* represent the approximate data set by the model for the same population; and S ti , I ti , and R ti , the actual number of data associated with S error , I error , and R error at time i, respectively. Since the solution method is applied using fractional power series, changing a value in the order of the derivatives implies altering all the set of constants obtained in the power series. A high decimal value in the derivative could suggest a slow convergence and, therefore, a greater number of monomials to obtain an approximation, which, in turn, leads to higher computational costs. In this study, we restricted the order of the differential equations to three decimal places and its fractional expansion to 130 terms because we seek to maintain a balance between accuracy and computational cost.
2. RESULTS
The solution to the differential equation system under study provides three polynomial equations expressed by means of fractional power series. Each resulting expression models the evolution of the susceptible, infected, and recovered populations across different periods of time. Therefore, the behavior of each solution depends on five parameters: the infected and recovered population coefficients (β and γ) and the order of the derivatives (α, ϵ, and δ). Due to this, there is at least a set of coefficients that fit the solutions to the dataset. However, since the convergence of the solutions depends on the number of decimal places in the order of the derivatives, we established the following restrictions to obtain the optimal coefficients with a minimum computational cost:
-The order of the derivatives must have a maximum of three decimal places.
-The error of each model is the maximum overall relative error.
-The approximations will have polynomials of 130 terms.
-The data used consider only mild changes in behavior, which limits human intervention.
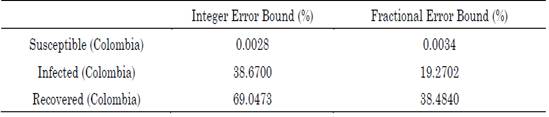
The Bound Optimization BY Quadratic Approximation (BOBYQA) gradient-free minimization algorithm was used to perform iterative minimization [30]-[32]. We implemented this algorithm because changes in the order of a derivative produce gaps in calculating the error, thus yielding discontinuity, and avoiding derivatives in all the intervals of interest. The maximum error for the Colombian model is presented in Table 1.
Table 1 Percentage of maximum absolute error associated with the integer and fractional SIR model approximations
Source: Authors’ own work.
2.1 Colombian population
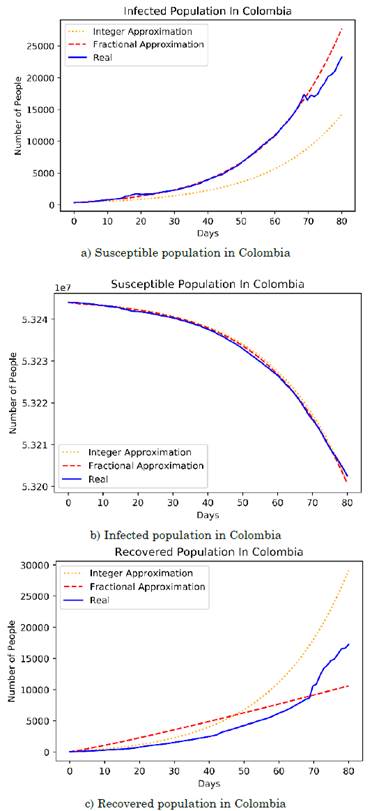
The optimal orders of the derivatives obtained by the algorithm for the fractional model are: 0.52 for the differential growth of the susceptible population in Colombia, 0.72 for that of the infected population, and 1.12 for that of the recovered population. Regarding the parameters, the number of people infected per day by a single infected person (i.e., parameter β) was 0.1424499 and the frequency of recovered (i.e., parameter γ) was 0.09640691 for the integer model. For the fractional model, β and γ were 0.35 and 0.23, respectively. The order of the fractional differential equation shows that the evolution of the susceptible and infected populations has a differential behavior that is much lower than that provided by the entire model. This implies that, although the virus propagation dynamics had no initial control, its propagation was limited by environmental conditions or factors exogenous to the current model. Moreover, the growth rate of the recovered population is higher than the integer, which indicates that the Colombian population experiences an accelerated recovery rate.
The behavior of the recovered population has accelerated the dynamics with respect to the value expected in the SIR model. This suggests that, although people are infected at a lower rate than expected, they recover much faster (in very short intervals of time). Figures 2a), 2b), and 2c) provide a better approximation of the fractional model with respect to the integer model.
2.2 French population
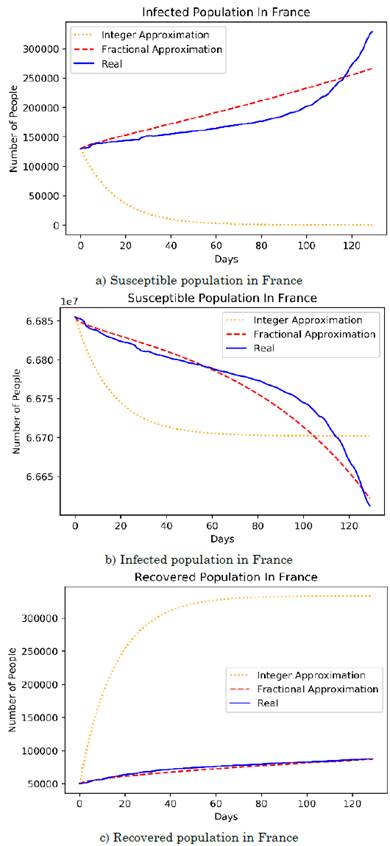
The optimal orders of the derivatives obtained by the algorithm for the fractional model are: 0.55 for the differential growth of the susceptible population in France, 0.76 for that of the infected population, and 0.62 for that of the recovered population. Regarding the parameters, the number of people infected per day by a single infected person (i.e., parameter β) was 0.1731863 and the frequency of recovered (i.e., parameter γ) was 0.06761948 for the integer model. For the fractional model, β and γ were 0.0267 and 0.0115, respectively.
The growth dynamics of the susceptible population presents significant changes because the differential order of the non-infected population was considerably below the order expected from the integer model (1). This means that the French health policies significantly impacted the spread of the disease, as the integer model provides an estimate of how the contagion might have evolved if there had been no initial restrictive measures to prevent the spreading of the disease.
The difference between the differential orders of the susceptible and infected populations is determined for two reasons: (1) due to the difference between the quantities handled by the populations, since the scale of susceptible individuals is much larger than that of infected individuals; hence, the system proportionally balances the quantities based on their differential growths, and (2) because exogenous factors (e.g., the environment and the population density in regions with high infection rates) endorsed a greater survival of the virus in potential inorganic entities that transmit the disease. Table 2 shows the error comparison between the integer and fractional models, on the other hand, the Figures 3a), 3b), and 3c) show the approximation of the fractional model and the integer model fitted to the French data.
Table 2 Percentage of maximum absolute error associated with the integer and fractional SIR model approximations
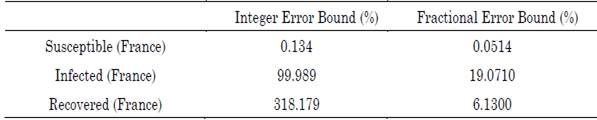
Source: Authors’ own work.
Source: Authors’ own work.
Figure 3 Integer and fractional SIR model approximations to the French population
The models of SAR-COV-2 propagation in Colombia and France reproduce the behavior of the disease and the distribution of the three population sets. The fitted parameters could be interpreted to improve the way the disease is handled.
Although the evolution of the susceptible population in Colombia (regulated by parameter α) indicates a lower expected growth rate, this does not mean that it is due to an adequate handling of the disease but rather to the fact that it is conditioned by the results of the infected and recovered populations. A slowing effect of the susceptible population triggers a slow evolution and progress of the infected group, who have more possibilities of contagion. This is contrasted by the considerably high growth rate of the infected population (1.2) with respect to the integer model (1). Indeed, under these conditions, the average number of individuals who are infected by just one person is expected to be around 0.35. This condition makes the susceptible group to remain approximately constant but the infected population to increase rapidly even during a strict lockdown.
Moreover, the evolution of the recovered population shows a favorable growing tendency that overshadows the differential growth of the other two populations (susceptible and infected individuals). This, in turn, suggests that infected people have a high resistance to the disease and that if there were eventually no infected individuals or external influences, the pandemic would end satisfactorily in a few weeks. This is contrasted by γ, which indicates that, under the growth distribution of the recovered population, each infected individual recovers in 4-10 days or, otherwise, dies after 4-10 days.
In the case of France, the growth of the recovered population, as well as parameters β and γ, imply a different context because the low recovery rate is attributed to the low infection rate. Therefore, although the growth of both populations is similar due to their fractional growth coefficients, the results indicate a smaller population, which is contrasted by the lower slope and curve of the French population with respect to that of Colombia.
3. CONCLUSIONS
The data used in this study show different behaviors of SARS-CoV-2 in its initial stages of evolution, thus demonstrating that the sociopolitical conditions in Colombia and France are quite different. However, despite these differences, the model was easily adapted because the evolution of the disease exhibited a growth that was expected for the fractional dynamics. Hence, the use of fractional differential equations to model dynamical systems is found to be a favorable alternative that improves the accuracy and proximity of the biological phenomena of disease spread provided by integer models. This can be observed in the results obtained here regarding SARS-CoV-2 propagation in Colombia and France, where the complexity of the models did not increase.
The fractional transformation method has proven to be a suitable choice for solving most linear and nonlinear fractional differential equations; it produces satisfactory results and is employed to develop extremely useful tools to solve fractional equations. For instance, the BOBYQA optimization algorithm fits very well in the minimization of orders in fractional equations, as well as in the metrics used to evaluate it. In addition, it can be easily adapted to other type of complex systems.
Although the fractional model provides a suitable fit to SARS-CoV-2 propagation in two different countries with very different health policies, the fractional-order SIR model, which can be applied to multiple contexts due to its flexibility, is only a baseline approximation that makes it possible to describe the evolutionary nature of the infection. It can be improved or adjusted to address a particular context by increasing the interaction between populations or by adding more populations, like to the sir model is a guiding basis for the structuring of more complex models. According to our results, the SIR model had some restrictions in the curve of the recovered population in Colombia due to a limitation in the model assumptions.

