


 Inglês (pdf)
 Artigo em XML
 Referências do artigo
 Enviar este artigo por email
 Citado por SciELO
  Citado por Google
  Similares em
SciELO
Similares em
SciELO  Similares em Google
 Permalink
1. INTRODUCTION
Cities account for between 60 % and 80 % of the energy consumption, thereby contributing significantly to global greenhouse gas emissions. Likewise, the growth of the population and the city's urbanization rate is expected increase world energy demand by approximately 30 % [1]-[4]. Moreover, buildings have the highest energy consumption, with approximately 40 % of energy end-use that contributes to approximately 30 % of CO2 emissions [5], [6].
The energy demand of a building depends primarily on the architectural design (e.g., materials, geometry, and percentage of glazed facades), and it can vary owing to external conditions (e.g., weather and the occurrence of disruptive events) and usage (e.g., usage patterns and modification of the spaces). In some cases, this variation may mean a greater increase in demand than projected, which may result in an inability to satisfy the building’s energy requirements for occupant comfort [5]-[7].
In recent years, construction practices that favor the adoption of sustainability criteria in buildings and improve the well-being of their occupants throughout their life cycle have gain recognition [8]-[10]. This is evidence by the development of building energy standards and certifications such as Leadership in Energy and Environmental Design (LEED), Building Research Establishment Environmental Assessment Method (BREEAM), American Society of Heating, Refrigeration and Air-Conditioning Engineers (ASHRAE) 189.1, EDGE and Green Star [11]-[15].
Buildings are structures designed for long term use with the ability to adapt to changing scenarios and adjust their operation according to the evolving needs of their occupants [16], [17]. Previous studies have shown that improving building adaptability contributes significantly to reducing energy consumption [18]-[20].
Green buildings are designed to efficiently use resources (e.g., energy) and improve their environmental performance (e.g., greenhouse gas reduction) [15], [21]. These buildings incorporate energy-saving strategies classified into passive (e.g., natural lighting, natural ventilation, materials, green roofs) or active (e.g., efficient technologies, on-site generation and automated systems) techniques, which allow them to adapt their operations to improve the comfort conditions of their occupants and reduce energy consumption [22].
Passive energy-saving strategies focus on the building’s architectural design to take advantage of the environmental conditions and, in this way, reduce the use of energy for lighting and air conditioning [22]. Unlike active strategies, these strategies do not require mechanical, electrical or manual systems [22]. Strategies such as green roofs and façades, building orientation, wall-to-window ratio, shadow elements on façades, in situ generation (photovoltaic (PV) and wind), and efficient lighting have been widely supported and developed in the literature [23]-[26].
Energy-saving strategies can be integrated into building design in several ways. These can be classified into (i) variation of parameters or parametric analysis and (ii) optimization approaches, often multi-objective [24], [27], [28]. The application of these methods is based on energy modeling tools, which allow the evaluation of the building´s energy performance (BEP) (including thermal) in detail and, in turn, the analysis of the incidence of characteristics such as occupation profiles and envelopes [29], [30]. Among the most widely used energy modeling tools in the literature are simulation engines such as EnergyPlus, DOE2 and TRNSYS, and graphical interface software such as eQuest, DesignBuilder, IES and ESP-r [27], [29], [31], [32].
EnergyPlus is an energy simulation tool widely used and validated by designers and researchers to analyze at building’s energy and thermal performance [23], [31]. Software such as DesignBuilder, which is based on this simulation engine, has a user-friendly graphical interface, allowing the elaboration of 3D models of more complex buildings and configuring their parameters in detail, making it a useful simulation tool [31], [33].
Different studies that address building energy analysis through energy simulation software focus on estimating operational energy, embedded energy, energy life cycle, energy-saving and thermal comfort indices [24], [34]-[36]. A number of building characterization parameters (metrics), such as energy intensities or uses, energy cost, sensible heat gains, and predicted percentage of dissatisfaction (PPD), are also objects of interest [31], [32], [37]-[42].
Buildings can be considered complex systems whose operation (energy-related) depends on the interaction of different components, whether they are static (e.g., location and construction materials) or dynamic (e.g., occupation) [43]. Some aspects, such as energy consumption (HVAC systems, lighting and end-use load), building function and thermal loads describe the building operation [44], [45]. For this reason, it is necessary to conceive a BEP as a multidimensional phenomenon.
Composite indicators (CIs) are valuable tool for describing multidimensional phenomena or concepts through the mathematical combination (aggregation) of a group of sub-indicators that evaluate their specific characteristics [46], [47]. This methodology is widely used in socioeconomics [48], [49], public policy evaluation [50], educational systems [51], [52], risk analysis [53], sustainability, and the environment [54], [55].
From an energy approach, the CIs most frequently mentioned in the literature are energy security (evaluated at a local or regional level) [56]-[60], energy sustainability [61], [62], energy resilience [63], [64], and energy development [65]. In addition, a few studies have focused on performance indicators such as energy use, renewable energy use, building energy balance, energy loss, energy efficiency, building comfort, thermal load, and storage capability to describe individual aspects of the building [66]-[68].
However, very few studies address BEP analysis from a multidimensional approach. Therefore, this study aims to construct a CI that facilitates the understanding of BEP while integrating some of the most relevant sub-indicators and metrics used in the literature to analyze the energy consumption and thermal behavior in buildings. This indicator represents a relatively easy-to-implement tool that allows stakeholders in the building sector to make appropriate decisions that contribute to the efficient integration of energy-saving strategies in buildings.
Therefore, this study proposes a CI that allows the estimation of a BEP while ensuring thermal comfort conditions. A working methodology of this study consisting of three stages is proposed as follows: (i) identification of possible sub-indicators and metrics and gathering information on the case study features, (ii) case study modeling and simulation, and (iii) construction of the composite indicator. This last stage consists of selecting sub-indicators and metrics, normalizing the data obtained from the simulations, weighting and aggregating the data, and validating the proposed indicator through a sensitivity analysis.
As a result, the resulting BEP indicator was obtained as a mathematical aggregation of the energy efficiency (EE) and thermal comfort (CO) sub-indicators. The Electrical Engineering building (EEB) of the Universidad Industrial de Santander (UIS) (Bucaramanga, Colombia) was selected as a case study. The energy models and case study simulations were developed using the DesignBuilder V6 software.
This paper outlines the general aspects of CIs construction, considerations of the proposed BEP indicator, case study description, and elaboration of its energy models (Section 2). The analysis of the simulations results of the energy models and the evaluation and validation of the proposed composite indicator are discussed (Section 3). Finally, the conclusions of this study are presented (Section 4).
2. MATERIALS AND METHODS
This section presents the general considerations for constructing a CI, the proposed CI for estimating the BEP, and some aspects of its application. Subsequently, the building selected as a case study is described in detail. Finally, the energy models and simulation scenarios considered in this study are presented. Figure 1 shows the general methodology used in this study.
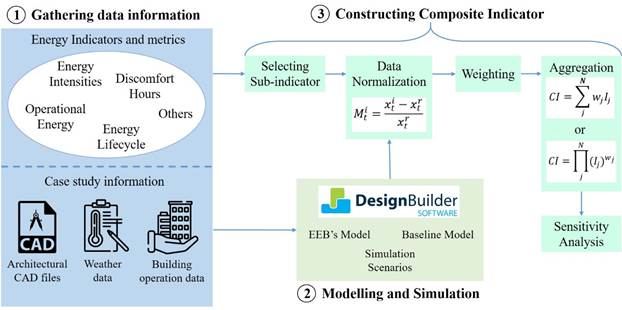
Source: created by the authors.
Figure. 1 Study methodology for construction of BEP composite indicator
2.1 Constructing CIs
CIs represent an alternative for analyzing complex phenomena because they integrate the measurement of metrics related to multidimensional concepts, simplify the evaluation procedure, and facilitate the dissemination [47], [64].
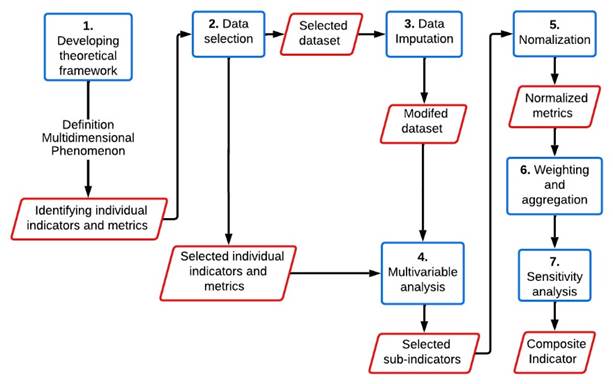
CIs are constructed in seven stages, as shown in Figure 2: (i) a theoretical framework is developed to understand and define the multidimensional concept to be measured, individual indicators and metrics are identified, and the selection criteria are stablished; (ii) the quality of available indicators and metrics are checked by data selection, and the dataset is selected; (iii) the sub-indicators (group of individual indicators) are established using multivariate analysis; (iv) data imputation is conducted, which allows the dataset to be adapted in case of missing information; (v) normalization is performed to transform the metrics and/or sub-indicators to a common scale; (vi) the weights of the sub-indicators and aggregation method are established to estimate the composite indicator; (vii) sensitivity analysis is conducted to evaluate the quality and robustness of the composite indicator [47], [69].
The selection of normalization, weighting and aggregation methods depends on the sub-indicator characteristics and is subject to the consideration of the analyst who builds the CI [47], [69]-[72]. The CIs validation consists of a sensitivity analysis to test different data normalization, weighting, and aggregation methodologies, as well as weight values with the proposed sub-indicators and metrics [47].
2.1.1 Normalization methods
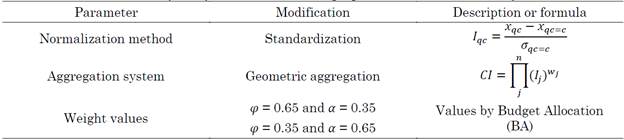
CI construction often involves handling data with different scales and dimensions; therefore, it is necessary to normalize the dataset to a common scale. There is evidence in the literature of several methods used for data normalization. Table 1 lists some of the most applied methods.
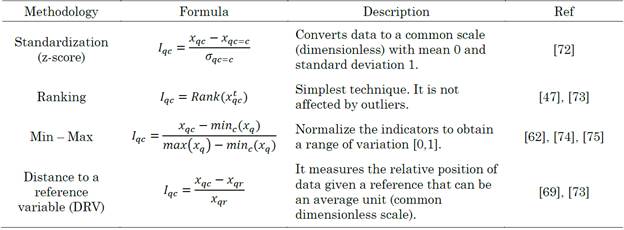
I qc is the indicator or metric for normalization, x qc is the non-normalized variable, and σqc is the standard deviation of the reference variable.
2.1.2 Weighting methods
Although there are many methods to weigh sub-indicators, their selection depends on the characteristics of the CI. The simplest weighting method assigns equal weights (EW) to each sub-indicator and is recommended for the initial phases of the CI construction [76]. In general, weighting methods can be classified into two categories: (i) those based on statistical models (Data Enveloping Analysis (DEA), Benefit of the Doubt (BoD) and Unobserved Components Models (UCM)) and (ii) those based on collaborative models (Budget Allocation (BA) and Analytical Hierarchy Processes (AHP)).
2.1.3 Aggregation strategies
Aggregation strategies can be grouped into compensatory (geometric and linear weighted aggregation) and non-compensatory (multi-criteria analysis) procedures. The geometric weighted and weighted linear aggregation methods are the most used compensatory aggregation procedures; the mathematical formulation of these techniques is given in (1) and (2), respectively.
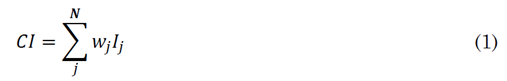
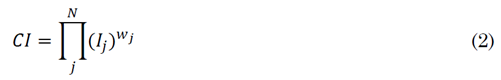
Where, CI is a composite indicator, I j is the normalized sub-indicator j, and w j is the weight assigned to sub-indicator j.
2.2 Building Energy Performance (BEP) indicator
A literature review identified recurring items related to the building performance, with a particular interest in green buildings. The most mentioned were energy efficiency, comfort, adaptability, reliability, and sustainability [34], [77]-[79].
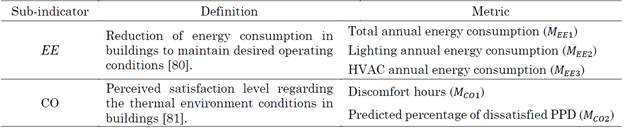
Although it is possible to assign sub-indicators and metrics to most of these concepts, only energy efficiency and comfort (from a thermal perspective) were considered as sub-indicators for CI construction in this study. Table 2 presents the selected metrics used to evaluate the sub-indicators.
In this study, DRV was selected to normalize the metrics. The mathematical formulation of this method is presented in (3).
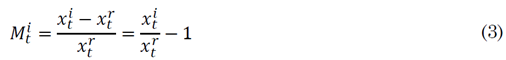
Where Mt i is the normalized value of metric i for time t; xt i and xt r are the non-normalized metric i and the reference value of the metric i (the result of the baseline model), respectively. A value of zero was assigned to the normalized metric when the non-normalized value was greater than or equal to the reference value.
The aggregation of sub-indicators was based on the weighted linear aggregation method, which was calculated by averaging the normalized values of the metrics assigned to them. In (4), (5), and (6) the formulation of the BEP composite is presented in detail.

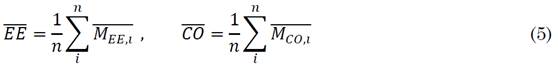

Where BEP is the composite energy performance indicator,  is the energy efficiency (normalized),
  is the thermal comfort (normalized), M ̅
EE,i
is the energy efficiency for metric i (normalized), and M ̅
CO,I
is the thermal comfort metric i (normalized). The EW method was chosen (φ = 0.50 and α = 0.50), and two other weight sets were proposed for analysis. Table 3 lists the parameters used in the sensitivity analysis.
is the thermal comfort (normalized), M ̅
EE,i
is the energy efficiency for metric i (normalized), and M ̅
CO,I
is the thermal comfort metric i (normalized). The EW method was chosen (φ = 0.50 and α = 0.50), and two other weight sets were proposed for analysis. Table 3 lists the parameters used in the sensitivity analysis.
2.3 Case study features
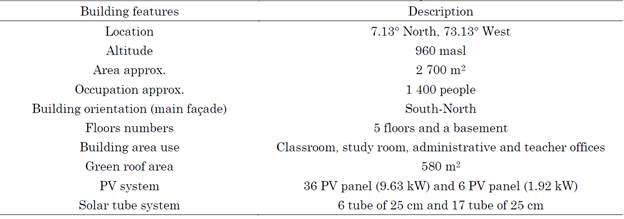
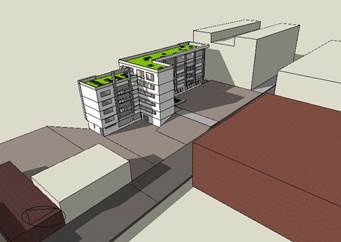
The Electrical Engineering building of the Universidad Industrial de Santander (UIS), located in Bucaramanga, Colombia (7.13° North, 73.13° West, 960 masl) was taken as the case study. This city has warm weather conditions with average daily and maximum temperatures of 24 °C and 31 °C, respectively, and an average annual rainfall of 1279 mm. The solar irradiation ranges from 2.0 kWh/m2 to 7.6 kWh/m2, with an average of 4.8 kWh/m2 [82]. The EEB has five floors where classrooms, administrative offices, and study rooms are distributed. It integrates active and passive energy-saving strategies such as shading elements (louvers and projections), green roofs, solar tubes, and PV system. Figure 3 presents the south façade of the EEB.
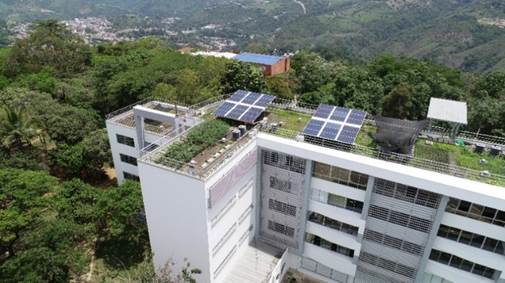
Green roofs and a solar tube system were installed on the roofs of fourth and fifth floors (140 and 440 m2, respectively). These systems reduce HVAC and lighting energy consumption in certain areas [82], [83]. The PV system comprises three units (SFV1, SFV2 and SFV3) located on the EEB roofs, SFV1 and SFV2 have 37 PV panels (255-270 W) with an installed power of 9.63 kW. SFV3 has six PV panels (320 W) with an installed power of 1.92 kW [82], [83]. Table 4 summarizes the features of the EEB.
2.4 EEB energy modeling process
The EEB was modeled using the DesignBuilder V6 simulation tool because it allows the user to elaborate on relatively complex building geometries, configure the building’s components as construction materials (walls, windows, and doors), occupation, electrical loads, and HVAC systems, as well define climatic variables and building orientation [84].
DesignBuilder incorporates four general solution algorithms for thermal exchange in the building’s construction elements: Conduction Transfer Function (CTF), Finite difference, Heat and Humidity by Finite Elements (HAMT), and Moisture Penetrating Conduction Transfer Function (EMPD).
In this study, CTF was selected as the general solution algorithm because it allows the calculation of sensible heat without considering the storage or diffusion of humidity in the building elements; it is also the algorithm used by default in the EnergyPlus calculation engine and DesignBuilder. Although, most building models can be adequately simulated with only one or two time steps per hour, it is recommended to configure six-time steps per hour in the calculation options because the EEB has HVAC systems [85].
EEB modeling begins with the geometric definition (perimeter of the blocks of each building level). Then, the internal divisions, openings (doors, windows, and voids), and the architectural elements (e.g., stairs and shading elements) were included using DesignBuilder drawing tools.
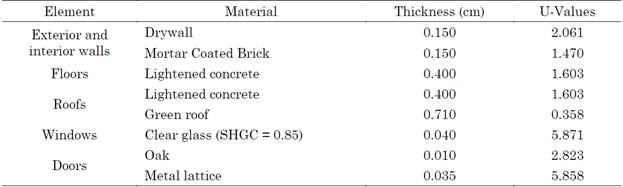
Subsequently, the characteristics of the opaque elements (e.g., walls, doors, roofs, and floors) and glazing were configured. Likewise, the occupation parameters (hours and number of people) of each building area, air-conditioning equipment, lighting, and miscellaneous loads for the current-conditions model were defined. Table 5 presents the data assigned to the current-conditions model.
Studies indicate that the urban context of a building can negatively impact its performance, primarily by increasing HVAC energy consumption [86]. Therefore, the buildings adjacent to the EEB were incorporated into the energy models as component blocks, simplifying their geometry, as shown in Figure 4.
Source: created by the authors.
Figure. 4 EEB current-conditions model developed in DesignBuilder V6
Moreover, it is necessary to establish a reference model (baseline model) without integrating the energy-saving strategies to evaluate the energy performance of the EEB.
However, no building construction parameters for educational purposes currently exist in Colombia that allow defining a baseline model necessary to evaluate BEP [87].
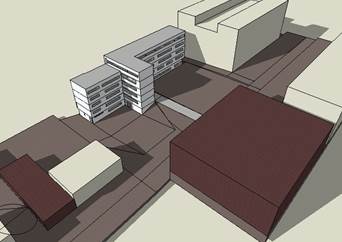
Therefore, the ASHRAE 90.1 Appendix G standard was adopted for the elemental characterization of the baseline model (HVAC systems, lighting, and equipment). This indicates that the baseline model can be elaborated from the proposed energy model considering the requirements specified in Sections 5 to 10 of the Appendix G [40], [88]. In this study, the PV generation system of the EEB was not considered. Figure 5 shows the EEB baseline model developed using DesignBuilder.
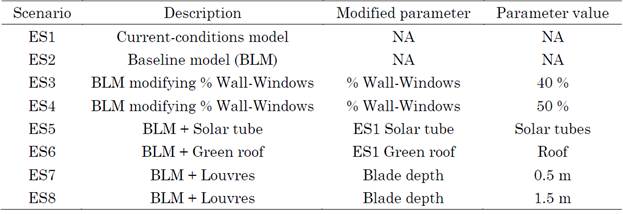
In addition, to evaluate the incidence of each EEB energy-saving strategy independently, at parametric analysis of the baseline model was considered. Eight simulation scenarios were proposed, including the EEB energy model (current conditions) and baseline model. The simulations were developed for one year and the meteorological data for a typical year in the city of Bucaramanga, Colombia, were considered. Table 6 presents the selected scenarios in detail.
3. RESULTS AND DISCUSSION
In this section the simulation results obtained in DesignBuilder V6, estimated values of the sub-indicators, and composite indicator of energy performance are analyzed.
3.1 Results of the energy models
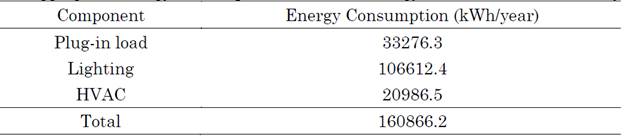
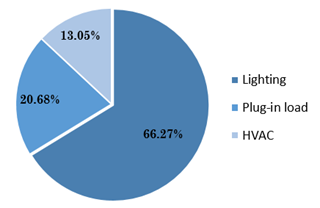
Table 7 and Figure 6 present the results of EEB energy consumption. The total building energy consumption was measured as 160866.2 kWh/year. The greatest contributor was the lighting system with 106612.4 kWh/year (66.27 %), followed by plug-in loads with 33267.3 kWh/year (20.68 %) and HVAC with 20986.5 kWh/year (13.05%).
Source: created by the authors.
Figure. 6 Disaggregated percentages of EEB’s annual energy consumption
The HVAC system energy consumption in the EEB was relatively low because of the use of natural ventilation in most areas and the integration of the automation system with air conditioning units in other areas.
3.2 Analysis of incidence energy-saving strategies
Table 8 presents the metrics for the proposed scenarios. The green roof and solar tube strategies (scenarios ES5 and ES6) had low impact on the EEB’s energy consumption because these strategies only interact with specific areas of the building.
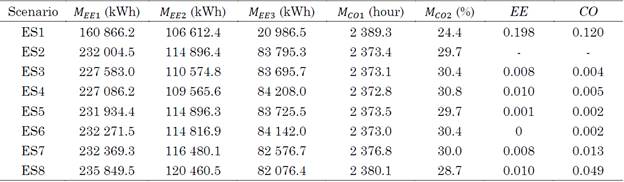
In addition, modifying the wall-to-window ratio (scenarios ES3 and ES4) reduced energy consumption due to lighting (3.76 % and 4.64 %, respectively) because natural lighting was used in larger window areas. However, increasing the wall-to-window ratio increased the solar gains on exterior windows, thereby the energy consumption of HVAC systems. Despite this, thermal comfort conditions did not present significant variations in the baseline model.
Using louvers on the external windows (ES7 and ES8) reduced the thermal gains in these elements, thereby reducing the energy required for cooling the building (1.45 % and 2.05 %, respectively). However, this affected the contribution of natural lighting, increasing lighting consumption by 1.38 % and 4.84 % for each simulated scenario.
The current-conditions model (ES1) showed a more significant reduction in the energy consumption metrics of approximately 7.21 % and 74.96 % for lightning and cooling, respectively, which reduced the building's total energy consumption by 30.66 %. In terms of thermal comfort, the hours of discomfort did not vary significantly between the different models (approximately 0.67 %). Despite this, the integration of the EEB’s energy-saving strategies (ES1) decreased the PPD by approximately 5 % with the baseline model (ES2), which represents an improvement in comfort conditions in the edification.
Finally, the proposed simulation scenarios identified the incidence of different energy-saving strategies when analyzing at BEP. Thus, they contributed to the assignment of weights for constructing the BEP composite indicator.
3.3 BEP indicator estimation
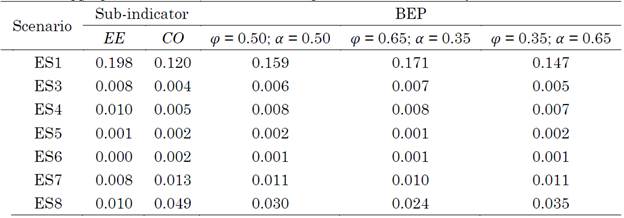
Tables 9 and 10 present the results of the BEP indicator calculated using the weighted linear and geometric aggregation methods for the proposed set of weights. The metrics were normalized using the DRV normalization method.
Table 9 Estimation of the BEP indicator using DRV normalization and weighted linear aggregation for a different set of weights
Source: created by the authors.
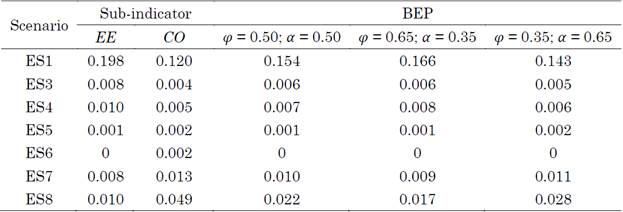
Table 10 Estimation of the BEP indicator using DRV normalization and geometric aggregation for a different set of weights
Source: created by the authors.
The assignment of weights consistently influenced the estimation of the BEP indicator, regardless of the selected aggregation method (weighted linear or geometric). The differences in the evaluated weights were relatively small and similar in both cases (between 0 and 0.012), with the ES1 scenario exhibiting the most significant variation (approximately 7.5 %).
Compared with BEP indicators using the geometric aggregation method which varied between 0 and 0.005, the weighted linear aggregation method yielded slightly higher values.
The EEB BEP (scenario ES1) was estimated to be 0.147 (min) and 0.171 (max) using the weighted linear aggregation method and 0.143 (min) and 0.166 (max) using geometric aggregation. Tables 11 and 12 present the normalized results of the BEP indicator calculated using the weighted linear and geometric aggregation methods for the proposed set of weights. The metrics were normalized using the z-score method.
Table 11 Estimation of the BEP indicator using z-score normalization and weighted linear aggregation for a different set of weights
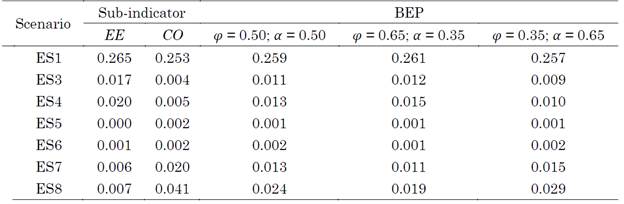
Source: created by the authors.
Table 12 Estimation of the BEP indicator using z-score normalization and geometric aggregation for a different set of weights
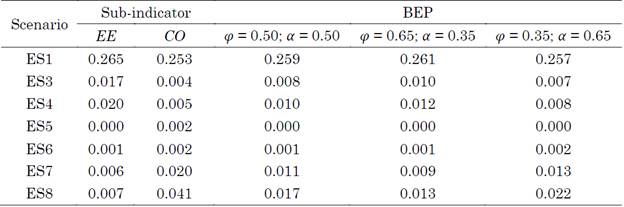
Source: created by the authors.
The estimated values of the BEP indicator show slight variations in the assigned weights (between 0 and 0.005) compared with those calculated using the DRV method. These differences were the same for both the aggregation methods (linear and geometric weighted).
Furthermore, the z-score normalized BEP indicator for EEB (scenario ES1) was equal for both aggregation methods (0.257 minimum, 0.259 average, and 0.261 maximum) with a percentage difference of 0.77 %.
Moreover, the geometric aggregation method tended to decrease the estimated value of the BEP indicator, especially for sub-indicators with values close to zero. Thus, it is not advisable to use this method because one sub-indicator can cancel out the impact of the others on the composite indicator.
The values estimated using the z-score method were approximately 66 % higher than those calculated using the DRV normalization method because the metrics present a dataset with high dispersion, which is consistent with the variables measured for the operation of the EEB. Therefore, the use of the DRV method for data normalization is recommended.
The BEP indicator values in each of the previous cases were consistent and did not present considerable percentage differences between the different sensitivity scenarios, thereby validating the suitability of the proposed composite indicator. In this sense, it can be stated that the integration of energy-saving strategies improves the BEP of the EEB by approximately 16 % (DRV method and weighted linear aggregation).
Although the integration of energy-saving strategies in the EEB represents an energy saving close to 30 %, it only estimates an individual indicator and does not consider the improvement in the thermal comfort of the building, as presented in previous sections.
Therefore, the BEP indicator is a suitable tool for analyzing the behavior of a building while ensuring comfortable conditions.
Finally, in general terms the BEP indicator makes it possible to estimate the impact of energy-saving strategies on building performance in a simplified manner. This indicator is expected to contribute to the construction industry stakeholders' better understanding of BEP, becoming a helpful tool for decision-making, and facilitating a greater integration of sustainability criteria in buildings.
It should be clarified that the sub-indicators proposed in the composite indicator are analyzed in stable operation; therefore, disruptive scenarios such as power outages or natural disasters cannot be evaluated using them.
4. CONCLUSIONS
This study proposes the construction of a composite indicator as a strategy to analyze the BEP using a simple approach that integrates multidimensional concepts related to its operation. The composite indicator is based on the mathematical aggregation (weighted linear) of two sub-indicators, energy efficiency and thermal comfort, which are estimated using metrics obtained from energy simulations in DesignBuilder V6.
The BEP indicator was evaluated for the proposed simulation scenarios and validated through a sensitivity analysis that considered different aggregation methods, data normalization, and weight values for the sub-indicators. As a result, it was concluded that the BEP indicator adequately reproduced the energy behavior of EEB. Likewise, it was possible to verify that the energy-saving strategies contributed to improving the BEP by approximately 16 %, taking as a reference the weighted linear aggregation method and assigning equal weights to the evaluated sub-indicators.
Although energy-saving strategies individually contribute to improving the BEP indicator, it is evident that the solar tubes and green roofs implemented in the EEB (scenarios ES5 and ES6) had a negligible impact on the composite indicator. Thus, it would be suitable to evaluate this indicator in areas where such strategies are implemented to evaluate their contribution to BEP.
Furthermore, the approach presented in this study allows for a global perspective of building operations under specific conditions. The relative simplicity to evaluating the BEP indicator enables its application to other building types (e.g., residential, commercial, or industrial), thereby contributing to the building’s energy characterization and energy-saving.
It is expected that the BEP indicator will become a helpful tool for decision-making in building design or refurbishing processes that favor the integration of sustainability criteria. However, one of the main disadvantages of the CI approach is the weighting of the sub-indicators, which depends on the consensus of the experts involved in the CI construction.
In the future, we plan to extend the composite indicator proposed in this study to include relevant BEP issues, such as adaptability, greenhouse gas (GHG) emissions, and economics. In addition, it would be beneficial to address the optimization approach for estimating the proposed sub-indicators; which would improve the quality of the composite indicator.

