


 Inglés (pdf)
 Articulo en XML
 Referencias del artículo
 Enviar articulo por email
 Citado por SciELO
  Citado por Google
  Similares en
SciELO
Similares en
SciELO  Similares en Google
 Permalink
1. INTRODUCTION
Lightning flashes are created habitually in the clouds during the Cumulonimbus formation, they are also generated by other natural phenomena such as volcanic eruptions. These electric discharges are related to a transference of positive or negative charge between cloud-to-cloud (CC), cloud-to-ground (CG), cloud-to-air, or cloud-to-ionosphere [1]. According to the direction in which the charges move and their polarity, the CG lightning flashes are divided into four types: negative downward (-CG), negative upward (-GC), positive downward (+CG) and positive upward (+GC) [2]. The lightning discharge process can be studied by the electric field change observation. These studies have shown that negative CG lightning flashes represent more than 90 % of global discharges, while 10 % or less are positives. However, the positive discharges are responsible for more damage than negative ones, causing death and injuries in humans and animals, forest fires, blackouts, contingencies in transmission power systems, etc. [3].
From research conducted in different regions of the world, scientists agree on the following six stages (or events) related with the formation of CG lightning flashes: train pulses of preliminary discharges, stepped leader (SL), attachment process (AP), first return stroke (FRS), dart leader (DL) and subsequent return stroke (SRS), although these last two can be repeated several times in the same flash. From the stages presented above the most studied, have been the return stroke discharges, while the least researched are the preliminary discharges [4], [5].
The electric field changes related with FRS and SRS in CG flashes have been analyzed and reported by many researchers in different regions [5], [6], including Colombia [7]-[9].
However, in several works it has been noticed that the FRS is sometimes preceded by a train of bipolar pulses lasting up to 1 ms [10], [11]. In addition, some researchers have observed preliminary breakdown pulses (PBP) grouped in a train whose duration can be greater than 30 ms [12]. These trains, called by other authors as initial breakdown pulses, may provide valuable information concerning the first event that led the electrical breakdown inside the clouds [13]. In fact, differences in the features of the PBP trains could indicate differences in the initial breakdown process inside the clouds. This condition justifies the development of new measurement seasons in different regions of the world.
After to study many electric field signatures produced by PBP, Clarence and Malan proposed the “BIL” model to characterize the waveform before the FRS [10]. This model includes a preliminary breakdown stage (B), an intermediate stage (I) and the stepped leader stage (L). These authors also suggested that the B stage is the result of the vertical discharge between the main negative charge center and the lower positive charge region inside the thundercloud. In their research, they found that the total duration of the preliminary breakdown process can be between 2 ms and 10 ms [10], [12].
In the last decade, several studies about the characteristics of PBP have been conducted in Europe, Asia, USA and Brazil [12], [13]-[17]. Most part of these works have been focused on the analysis of the pulse train duration (T PBP ), the number of the pulses in the train and the ratio of the electric field peak value of the largest pulse in the train and the corresponding first return stroke (PBP MAX /FRS M ). In addition, some comparisons between the statistics obtained in Malaysia and Sri Lanka and those obtained in Sweden, Florida and Finland, show that the strength of the ratio PBP MAX /FRS M is larger at high latitudes compared to that of the tropical regions [12], [14] - [16].
Although these results have expanded the knowledge of the initial breakdown process, the data available on PBP from tropical thunderclouds is scarce, and there is a need to gather more data from tropical thunderclouds [12]. In this context, this paper presents a statistical characterization of the PBP prior to the FRS observed in a set of lightning-generated electric field (LEF) signatures recorded in Bogota, Colombia (tropical region with altitude of 2550 meters). To the best of the knowledge, this is the first study in Colombia where the preliminary breakdown stage has been analyzed.
The paper continues as follows: section 2 describes the characteristics of system used in Bogota Savannah to measure the lightning-generated electric field signatures. It also summarizes the main features of the data set analyzed. A description of the experimental methodology is presented in section 3. Section 4 presents the results obtained from the characterization of several PBP signatures. To achieve this, the following parameters (temporal and magnitude) were used: pulse train duration (T PBP ), time interval between the largest peak of the PBP train and the FRS (PBP-FRS), ratio between the peak value of the PBP and its FRS (PBP MAX /FRS M ), interpulse time (IPT), number of individual pulses and individual pulse duration (T PULSE ). Finally, several conclusions and some future works are mentioned in Section 5.
2. METHODOLOGY
2.1 Instrumentation and data
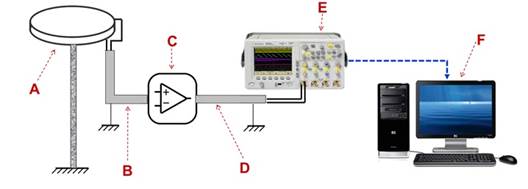
During more than three decades, the measuring systems used around the world to capture lightning-generated electric field signatures have been composed by the same stages and they have similar technical characteristics [12], [18]. Usually, the experimental configuration used to measure LEF is composed of an electric field antenna, an electronic circuit, several coaxial cables and a recording equipment. In this way, the measuring system used during the measuring campaign is shown in Figure 1.
Source: Created by the authors.
Figure 1 Configuration of the measuring system. (A) antenna; (B) short coaxial cable RG58U; (C) electronic circuit; (D) long coaxial cable RG58U; (E) digital oscilloscope (Agilent DSO6104A)
The measuring system presented in Figure 1 consists of a parallel-plate antenna, an electronic circuit based on the buffer BUF602 and a digital oscilloscope. The antenna is made up of two circular plates with a diameter of 0.45 m, a separation between plates of 0.03 m and it was installed using a 1.5 m steel mast. For the connection, two coaxial cables RG-58/U (surge impedance of 50 Ω) were used. A 0.5 m long simple shielding cable was connected between the antenna and the circuit, while a 12 m long cable was installed between the circuit and the oscilloscope. This cable had simple shielding plus a metal shell, and it was properly terminated to avoid reflections.
The oscilloscope has a bandwidth of 1 GHz and for the acquisition of signatures a desktop computer (4-core processor; 4 GB RAM memory and 320 GB Hard Drive) was connected through its LAN port.
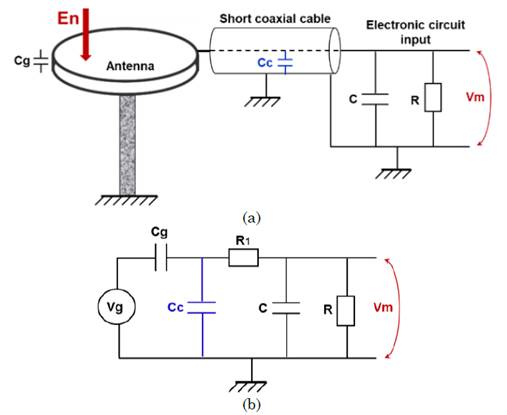
The diagrams of the parallel-plate antenna and its equivalent circuit are shown in Figure 2(a) and Figure 2(b), respectively. In these figures, En is the vertical component of the electric field, Vg is the voltage of the antenna, Cg is the capacitance of the antenna, Cc is the capacitance of the short coaxial cable, R 1 is the input resistance (coupling) between the cable and the electronic circuit,Cis the coupling capacitance of the electronic circuit,Ris the input resistance that controls the decay-time of the circuit (τ d =38 ms) andVmis the input measured voltage (before the buffer-amplifier). It is important to mention that the BUF602 (1000 MHz bandwidth and 8 kV/μs growth rate) was proposed as a new alternative for the typical buffe r LH0033 (100 MHz bandwidth and 1.5 kV/μs growth rate) because its production was suspended since 2008. A complete description of the electronic circuit and the measuring system can be reviewed in [19].
Source: Created by the authors
Figure 2 Parallel-plate antenna. (a) scheme including the electronic circuit; (b) equivalent circuit
For the acquisition process, the oscilloscope was set to operate at a sampling rate of 100 ns, using a total observation window of 500 ms. In addition, the vertical trigger was adjusted to capture transient signals with positive or negative polarity whose magnitude exceeded 6 V/m (or 150 mV) and the pre-trigger time was set to 250 ms. The parallel-plate antenna and the electronic circuit were located on the roof of five-story building of the Camilo Torres complex at the Bogota campus of the Universidad Nacional de Colombia (4.641° N, 74.091° W and 2550 meters above sea level). The approximate height between the ground plane and the roof of the building is 15 meters. The recording equipment was located in an office belonging to the EMC-UNC research group.
The electric field signatures generated by PBP were acquired from three thunderstorms during 2017 (15th and 16th November and 1st December). During the measuring campaign 363 negative CG flashes were registered. These events occurred in the central region of Colombia (Andean region) inside an area with a radius of 250 km from the measuring system. From this data set, the PBP trains were detected in 69 electric field signatures (19 %).
2.2 Characterization of PBP trains
The methodology applied to characterize the PBP trains it was chosen after an extensive bibliographic review (articles, case studies, books, etc.). The criteria selected for the characterization are similar to those used by [12], [13], [17], [18], [20], among others. In this way, the criteria employed for analyze the waveforms of the PBP trains are defined as follows:
-Only are characterized pulses whose peak-to-peak value exceeds twice the average noise level of the electric field.
-The pulses belong to the same PBP train if the separation between them is less than 2 ms.
-Only PBP trains with at least three pulses are characterized.
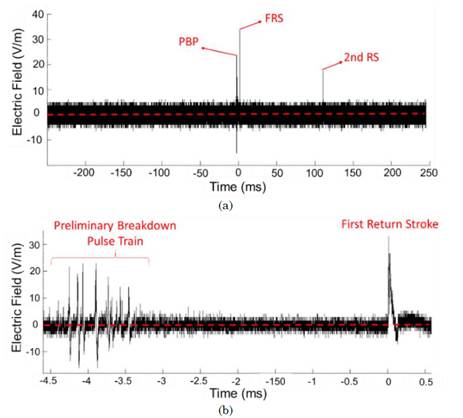
Figure 3(a) shows an electric field signature produced by a negative CG flash recorded in Colombia on November 16, 2017, at 18:01:57. In Figure 3(b) it is possible to identify the PBP train and the FRS. To describe each PBP train six parameters were selected: pulse train duration (T PBP ), time between the largest peak of the PBP train and the FRS (PBP-FRS), ratio between the peak value of the PBP and its FRS (PBP MAX /FRS M ), interpulse time (IPT), number of individual pulses and individual pulse duration (T PULSE ) [12], [17].
Source: Created by the authors.
Figure 3 Electric field signature produced by a negative CG flash. (a) Complete signature including PBP, FRS and second RS; (b) zoom on PBP train and the FRS
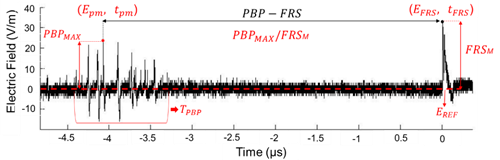
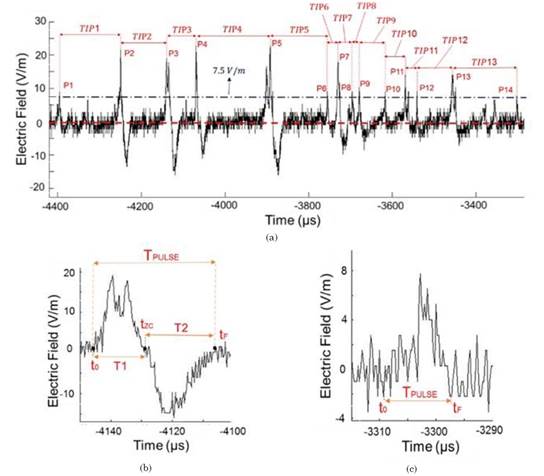
The graphical identification of the above-mentioned parameters (temporal and magnitude) is shown in Figure 4. The variables used to estimate several parameters of the train are: (a) the reference electric field (E REF ); (b) the electric field of the highest pulse in the train (E pm ); (c) the time in which the highest pulse is presented (t pm ); (d) the electric field peak value of the FRS (E FRS ) and; (e) the time in which theE FRS was occurred (t FRS ).
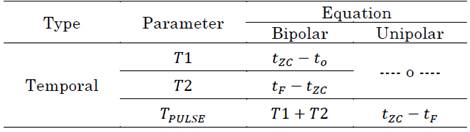
In addition, for the parameter T PULSE (seeFigure 5) the variables used for its estimation in each individual pulse are the initial time of the pulse (t 0 ), the zero-crossing time after the peak value (t ZC ) and the final time (t f ). It is important to mention thatt ZC is detectable only in bipolar pulses.
Source: Created by the authors.
Figure 4 Parameters identified in the pulse train (PBP-FRS, PBP MAX /FRS M and T PBP )
Source: Created by the authors.
Figure 5 Parameters identified in the PBP signature showed in Figure 3. (a) number of individual pulses per train and IPT; (b) T PULSE for bipolar pulse; (c) T PULSE for unipolar pulse
To extend the definitions used for the parameter estimation, and their relation with the variables mentioned in this section, Table 1 and Table 2 summarize the mathematical expressions applied to calculate the parameters of the PBP. In addition, these expressions are shown graphically in Figure 5.
Table 1 Mathematical expressions of parameters PBP MAX /FRS M and PBP-FRS
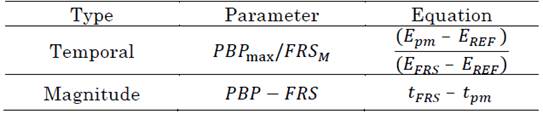
Source: Created by the authors
Analyzing the electric field waveform shown in Figure 4 the following points were identified: E pm = 22.6 V/m,E FRS =32.8 V/m,E REF = 0.26 V/m,t FRS = 0 msandt pm -4.1 ms.
The value E REF is the background electric field. This value is different for each signature due to the DC level presents in the electric field signals. Therefore, using the equations presented in Table 1, the parameters PBP MAX /FRS M andPBP-FRS(see Figure 4) were 0.7 ms and 4.1 ms, respectively. In addition, the complete PBP train duration is 1.1 ms.
On the other hand, Figure 5(a) shows that the PBP train has 14 pulses and 13 IPT. In addition, it can be seen the electric field level (blue dotted line) used to classify the pulses that will be characterized in each signature (7.5 V/m). This level corresponds to twice the average noise level in the characterized waveforms (criterion A). Figure 5(b) and Figure 5(c) show the method used to characterize the temporal parameter T PULSE in bipolar and unipolar pulses, respectively. In Figure 5(b), T PULSE is obtained from the addition of T1 and T2, while in Figure 5(c) this parameter is achieved from the difference between t 0 andt f .
3. RESULTS AND DISCUSSION
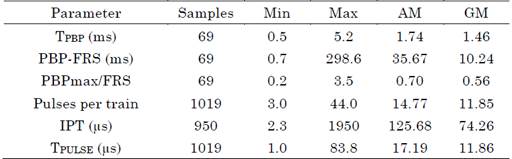
The PBP trains were characterized including the number of samples, the minimum (Min) and maximum (Max) values, the arithmetic mean (AM) and the geometric mean (GM) for each parameter. Table 3 presents the statistical results for the PBP signatures analyzed in this work. In this case, the column “Samples” has no units and it is related to the number of electric field signatures where each parameter was identified. Meanwhile, the Min, Max, AM and GM columns have the units indicated next to the parameter mentioned in the left column.
Regarding the statistical results, they are presented using histograms in Figure 6. In addition, comparison with several regions such as Sweden and Sri Lanka [14], Florida [12], [21], [22], [23], Finland [13] and Malaysia [12] are presented. In all cases, the number of samples analyzed in this study (69 PBP trains) is higher than that used in the previous works (35 in Florida-2008, 12 in Florida-2009 and 24 in Malaysia).
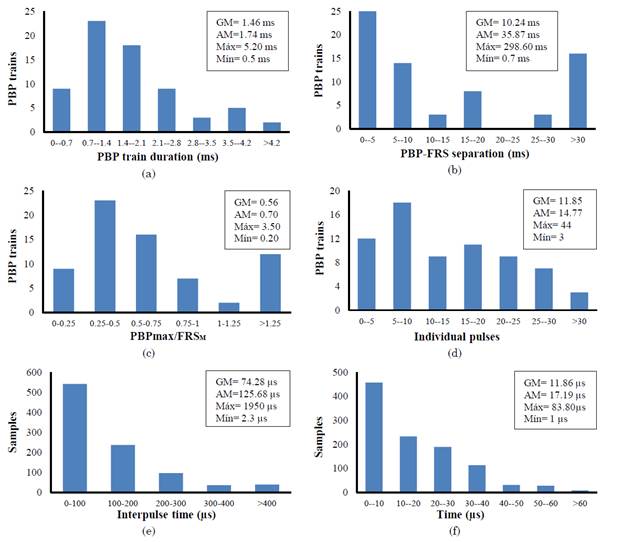
Figure 6(a) and Figure 6(b) show the behavior of the train pulse duration and the PBP-FRS time, respectively. The distribution presented in Figure 6(a) shows that 32 signatures of 69 signatures (46.4 %) have a PBP train duration less or equal to 1.4 ms, while the remaining waveforms (37) exhibited a duration between 1.4 and 5.2 ms. Although this range is similar to results obtained in Florida, 2008 (0.8 ms - 7.9 ms) and 2009 (0.8 ms - 7.9 ms), the AM and the GM in this study (1.74 ms and 1.46 ms) are lower than those reported in Florida-2008 (2.7 ms and 2.3 ms), Florida-2009 (3.4 ms and 3.2 ms) and Malaysia (12.3 ms and 10.1 ms). A possible reason for this difference may be due to the differing meteorological conditions, region, and latitude effect.
Source: Created by the authors
Figure 6 Statistical distribution for each parameter. (a) PBP train duration; (b) PBP-FRS separation; (c) PBP MAX /FRS M ratio; (d) individual pulses per train; (e) interpulse time (IPT); (f) individual pulse duration
On the other hand, in Figure 6(b) it can be seen that the parameter PBP-FRS presents individual values ranged from 0.7 ms up to 298.6 ms (min and max values). This range is similar to that reported by Baharudin et al. for Malaysia (8.3 ms - 227.3 ms). In Colombia, the AM was 35.87 ms. The corresponding value in Malaysia is greater by a factor of 1.6 (57.6 ms), while in Florida-2012, Sweden and Sri Lanka the means observed were 22 ms, 13.8 ms and 11.9 ms, respectively. Additionally, the histogram in Figure 6(b) shows that 39 flashes (56.5 %) present a PBP-FRS separation less than 10 ms, while 16 signatures (23.2 %) have durations greater than 30 ms. This behavior is similar to the distribution of PBP-FRS separation observed in Florida [12].
The distributions for the ratio PBP MAX /FRS M and the number of pulses per train are shown in Figure 6(c) and Figure 6(d), respectively. It can be seen in Table 3 that the minimum and maximum values for PBP MAX /FRS M are 0.2 and 3.5 respectively, with an AM of 0.7 and a GM of 0.56. Comparing with Malaysia (AM=0.28 and GM=0.15), Florida-2012 (AM=0.29 and GM=0.22) and Sri Lanka (AM=0.17 and GM=0.15) the means in Colombia are greater by a factor of 2.5 or above. However, regarding the AM similar results were observed in Florida-2009 (0.62) and Finland (0.61). The histogram in Figure 6(c) reveals that 55 signatures (79.7 %) have a PBP MAX /FRS M in a range less than 1.0, while 14 flashes (20.3 %) show magnitude ratios between 1.0 and 3.5. This is relevant due to Baharudin et al. reported in Florida and Malaysia that the PB pulses exceeds the FRS amplitude in less than 10 % of the cases. Nevertheless, in the three regions most part of PBP trains have pulses whose magnitude is equal to or less than that of the FRS.
According to Figure 6(d), it can be seen that the number of individual pulses per train has a GM and AM of 11.9 and 14.7, respectively. This value for the AM is higher than reported in Florida by Rakov et al. (10 pulses per train) [23]. For this study, the analysis of the signatures revealed preliminary breakdown stages with a minimum of 3 and a maximum of 44 pulses per train. The distribution shows that 39 (56.5 %) CG flashes have between 3 and 15 pulses. In addition, it can be seen that only 3 signatures (4.3 %) present more than 30 pulses.
The statistical distribution for IPT is depicted in Figure 6(e). It was found that 542 (57 %) intervals between pulses present a value less than 100 (s, while 39 intervals (4.1 %) have a duration great that 400 (s. Moreover, it can be seen that IPTs exhibited a GM and AM of 74.28 (s and 125.68 (s, respectively. Comparing with other studies, the AM is similar to those obtained in Florida-1996 (130 ms) [23] and Sri Lanka (144 ms). The range variation of this parameter was between 2.3 (s and 1950 (s (max and min values), which is slightly higher than reported in Florida-2009 (0.6 (s - 1585 (s) and similar to that observed in Malaysia (1 - 1908 (s). Finally, Figure 6(f) shows the statistical results for T PULSE . This parameter presents an AM of 17.19 µs and a GM of 11.86 µs. The minimum value of T PULSE was 1 µs, while the maximum was 83.8 µs. The histogram reveals that major part of pulses (690 % or 65.1 %) have a duration in a range between 1 and 20 µs, while 8 pulses (0.7 %) exhibited values greater than 60 µs.
4. CONCLUSIONS
In this study, the analysis and characterization of 69 electric field signatures produced by PBP trains preceding the FRS in negative CG lightning flashes occurred in Bogota Savannah (Colombia) was performed. Waveforms of 1019 pulses were analyzed, and the following characteristics were found: (a) bipolar pulses at the beginning and in the middle of the train; (b) unipolar pulses at the end of the signatures; (c) the PBP train starts with small pulses, continues with pulses of greater amplitude, and ends with pulses of lower magnitude; (d) the initial polarity in bipolar pulses is similar than that of the FRS.
The statistics results obtained from the data set show that the duration of the pulse trains has an AM of about 1.7 ms, with individual values from 0.5 ms up to 5.2 ms (maximum and minimum values). On the other hand, the temporal parameter PBP-FRS presents an AM of 35.87 ms, with maximum and minimum values of 0.7 ms and 298.6 ms, respectively. Other temporal parameters as the interpulse time and the individual pulse duration showed an AM of 125.68 µs and 17.19 µs, whit a geometric mean of 74.3 µs and 11.9 µs, respectively. The magnitude ratio PBP MAX /FRS M has a GM of 0.56 and individual values from 0.2 up to 3.5. Finally, the number of pulses per train presents an AM and GM of 14.7 and 11.8 respectively, with maximum and minimum values of 3 to 44 pulses per PBP train.
The results obtained from this study (Bogota Savannah, Colombia) and those obtained earlier in other regions (Sri Lanka, Malaysia, Sweden, Finland and Florida) show a shorter train pulse duration with an average of 14.7 pulses per train. In contrast, the parameter PBP-FRS in Colombia is greater than Florida-2012, Sweden and Sri Lanka. Finally, the ratio PBP MAX /FRS M was greater than tropical and subtropical regions by a factor of 2.5 or above. A possible reason for these differences may be due to the meteorological conditions the latitude and the altitude effect. This must be considered because the Bogotá savannah is located near to equator but at an altitude of 2550 meters above sea level. To verify this hypothesis, a further study with a larger data set must be conducted.

