


 English (pdf)
 Article in xml format
 Article references
 Send this article by e-mail
 Cited by SciELO
  Cited by Google
  Similars in
SciELO
Similars in
SciELO  Similars in Google
 Permalink
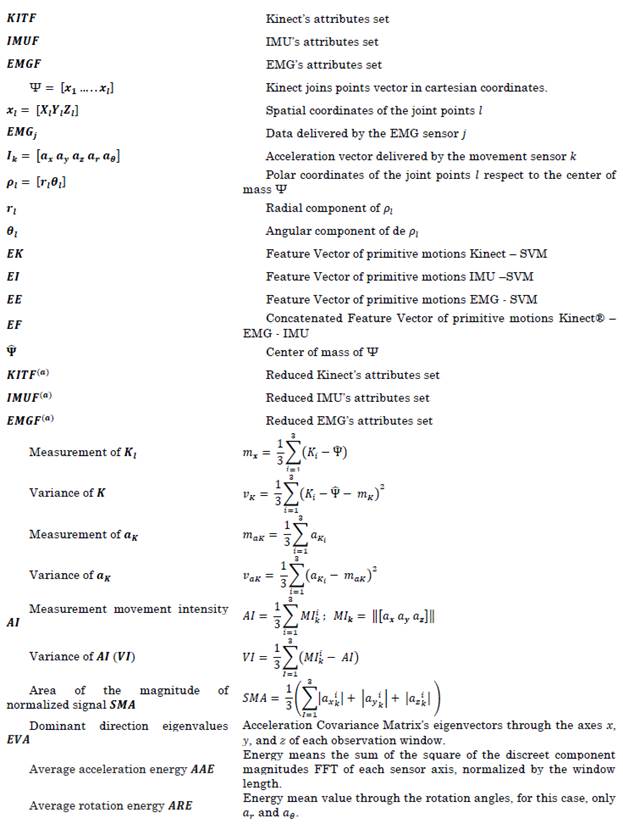
NOMENCLATURE
1. INTRODUCTION
Human physical recognition is a methodology that uses devices and computing algorithms to detect what action a person performs in a certain period. Therefore, rehabilitation, medical diagnostic, and intelligent surveillance systems, among others, have been implemented in sports [1]-[3]. Technological advance has allowed the creation of different devices for movement detection. These devices include depth cameras such as Kinect®, Inertial Measurement Units (IMU), and Electromyographic signal Sensors (EMG). Kinect® has a depth sensor, and an RGB camera inside that tracks the join points of the body; therefore, it is used along the classifiers to generate a codebook to identify human body stances and thus determine the performing of the physical action [4]([7]. Some works use the information of the stance given by the Kinect® and apply unsupervised algorithms (K-means or Spectral Clustering) to generate a codebook with key sub-movements. Later, they use a Hidden Markov Model (HMM) to recognize different combinations and thus to identify the activity; these methods are known as primitive motions. Although those works have reliable results, they present problems if there are lighting changes or some partial occlusions on the object or person [8]-[11].
The literature recommends opting for data fusion approaches, which use the information provided by two or more sensors to improve detection performance and increase robustness against partial occlusions and disconnections. Some methods show that combining IMU and EMG sensor (first case) or IMU and Kinect® (second case) improved activity estimation compared to the use of a single type of modality [11]([13]. In [12] EMG and IMU sensors to achieve great results, but its method shows issues with physical activity when considering external objects. On the other hand, [9] and [14] apply a fusion method with Kinect® and IMU sensors, achieving better system performance. However, detecting some activities presents the same problems when a single sensor measures them. Other works fuse more than two sensors and achieve reliable efficiencies greater than 90 % accuracy. An example is a work proposed by [1], which uses a multimodal system composed of Kinect®, IMU, and EMG sensors and applies a Support Vector Machine to label each activity's set of primitive movements. The biggest issue is being a supervised method. Therefore, it is not adaptable and requires all samples to be labeled. Also, this method needs a skilled person to distinguish two or more sub-movements, which carries classification problems. Another case shown in [15] uses K-means clustering to find the stances of each motion but needs SVM to validate it.
Also, K-means suffers from high dimensionality or when the database is too complex and could present partial occlusion problems or lighting changes by only using the Kinect® for activity classification. Other approaches use modern methods of machine learning as deep learning. Among the more common techniques, it has been highlighted the convulsed neural network, learning by reinforcement, etc. These methods have encompassed the identification of human physical activity and have achieved reliable results [16]([18]. However, an extensive database is required, which increases the costs of this type of application. Given the mentioned difficulties in human activity identification, this work shows a semi-supervised learning method that reduces the a priori labeling of the data. Besides, the process allows inferring the number of primitive motions needed to recognize human physical activity. The data is built by the information collected by a multimodal measurement system composed of three sensors (Kinect®, IMU, EMG), which apply dimensionality analysis techniques, evidencing the joint points of the Kinect® and the IMU and EMG sensors are relevant for measurement information. The main contributions and results of the research are.
Design, documentation, and validation of a human physical activity classification methodology under a semi-supervised learning paradigm.
An automatic method that allows inferring the number of sub-activities where the data should be clustered.
The proposed method suggests that the classifier recognizes 80 % of the labels, and we achieved reliable results according to what is written in the literature.
This work is organized as follows. Firstly, a methodological section describes the detail of each component and the validation process. Secondly, a section presents how the methodology's performance is evaluated and quantified. Lastly, a section describes the conclusion and further discussions of this research.
2. MATERIALS AND METHODS
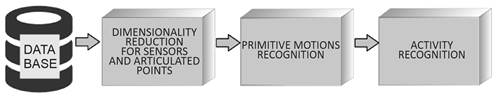
The methodology has three stages: search to extract the information from the sensors, descriptor calculation about the data, and relevant feature analysis of the compiled information. The second stage classifies the activity execution into micro-movements (primitive movements), and the last step codifies sequences for activity detection. Figure 1 shows the methodological process implemented in this work. The methods and instruments that conform to the methodology are described as follows.
2.1 Database
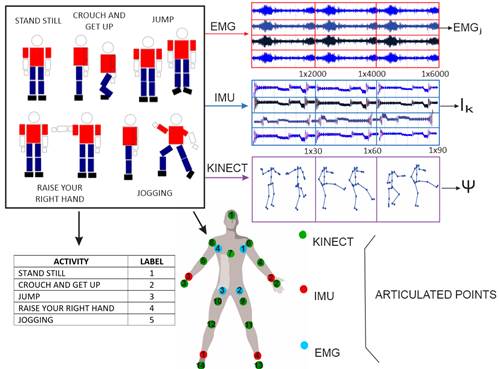
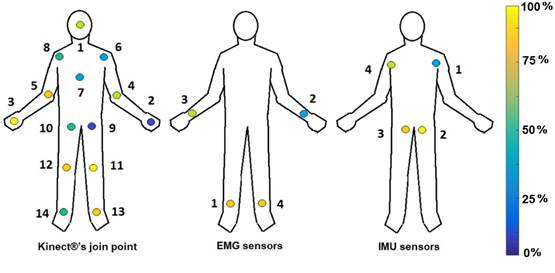
For this work, we used the database supplied by [1]. We selected this database because it provides a synchronized register of the three-movement measure devices mentioned before (Kinect®, EMG, IMU). Also, it allows a comparison with the methods proposed by [1]. This database recollects information from 8 users of the different physical and accommodates five physical activities where 15 articulated points measure the action (see Figure 2). While the Kinect activity is being recorded, samples from the IMU and EMG sensor networks are being acquired in parallel. Figure 2 shows the block diagram that resumes the building process of the database. The following link: https://sites.google.com/a/utp.edu.co/human-activity-recognition-database/human-activity-recognition-database-with-kinect-imus-and-emgs.
2.2 Dimensionality Analysis of the Sensors and Joint Points
In this section, we discuss the method to process the data through the statistic descriptors to parameterize the information given by each articulated point in a feature set that replaces the information recollected by the instruments. It is essential to clarify the new data space is redundant. Therefore, a dimensionality analysis is introduced to establish the minimum feature set, stabilizing the primitive movement classifier’s performance [19]([21].
2.3 Feature Extraction
For each sensor, the feature set is extracted inside an observation window proposed by[1], which has a time of 3 seconds. For the Kinect®, a collection of normalized articulated points Ψ is used (i.e. Ψ ̂), then, these are transformed in polar coordinates obtaining the vector Pi.
It was previously highlighted the data is normalized concerning the torso. Additionally, the average m and standard deviation v are calculated on each set of i, which allows for building the descriptor (1).

Where i corresponds to the i-th join point of the Kinect®, therefore, the set of 𝑖 ∈ {1,2 … 𝑖} computes the vector KITF as the link of all the 𝑲𝑰𝑻𝑖. Analogously, for each 𝐼𝑘, the physical parameter of the human movement and the statistic movements provided by [1] are computed. The computation delivers the vector (2).

Thus, for the set of 𝑘 ∈ {1,2 … 𝑘}, the concatenation provides, as a result, the descriptor 𝑰𝑴𝑼𝑘 (3).

For the EMG sensors, the physical activity of four human muscles is captured, delivering the EMG j , where j is the j-th sensor. EMG j is segmented to distinguish every primitive movement. For each primitive motion, we calculate the Wavelet transform, with a Daubechies configuration, with thirty-five orthogonal coefficients and six levels, generating the descriptor EMGF. We chose this descriptor because it is the same as the one used in [1], the state-of-the-art method we compare ourselves.
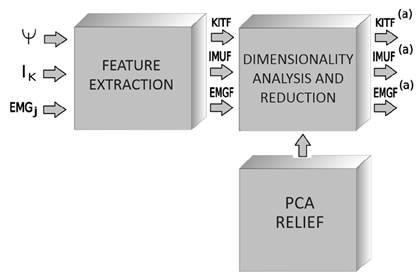
2.4 Dimensionality Reduction Analysis
In this stage, the most relevant features are determined to ease the clustering process of primitive motion identification. We use the Principal Component Analysis (PCA) and ReliefF methods to make this possible. The former reduces the feature space size by selecting the attributes with the most critical database information. We find crucial information by determining the direction with the highest variance of the sample space [20]. Meanwhile, ReliefF is applied to select the most relevant sample. This is done by detecting the conditional dependence between attributes. ReliefF is an extension of the Relief algorithm used in multiclass classification problems [22], [19].
These methods are selected by the sturdiness presented in multiclass problems and dealing with data at a substantial noise level. Figure 3 shows a block diagram that explains the dimension reduction process done by the data provided by the database where 𝐾𝐼𝑇𝐹(𝑎), 𝐼𝑀𝑈𝐹(𝑎), 𝐸𝑀𝐺𝐹(𝑎), correspond to the reduced space of features.
2.5 Primitive Motion Detection
Activity recognition can be divided into sub-activities or primitive movements. The goal is to divide each activity in a time window (establishing the primitive motions), generating a sequence that allows building a model for activity recognition. This will enable us to generate a unique code that provides a discriminating factor for the classification of the activity, as shown in Figure 4.
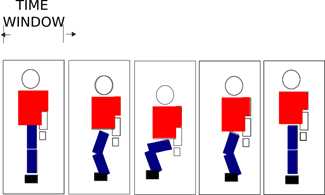
It is important to note that each window does not obey a posture but a submovement. In addition, for sensor modalities where it is impossible to determine the visuality of a body posture, as is the case for IMU and EMG sensors, we assign the label based on the information provided by the Kinect®’s sensor. This is possible because the sensors are synchronized in their capture (See Figure 5). The primitive movements chosen in this work are 1- Repose, 2- Half Crouches, 3- Fully crouching, 4- Suspended in mid-air (1/2), 4-Raise hand (1/4), 5- Raise hand (3/4), 6- Move right leg forward, and 7- Move left leg forward.
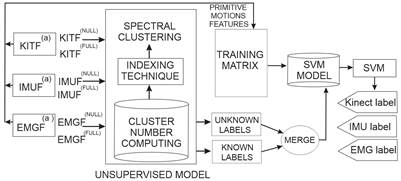
The micro-movement identification is achieved by combining an unsupervised learning technique (Spectral Clustering) with a supervised learning technique (SVM). The fusion of the former is done by estimating the labels of the unknown primitive motions, yet they are needed to train the supervised model. The latter emulates the codification of the activities.
It is important to clarify how the primitive movement classification includes an instrument that allows for correcting the issues in building the database. In this situation, a proportion of the reduced space {KITF (a) , IMUF (a) , EMGF (a) } does not have any associated label space {KITF (null) , IMUF (null) , EMGF (null) }, while the remainder are known {KITF (full) , IMUF (full) , EMGF (full) }, therefore, the features on the simplified plane {KITF (null) , IMUF (null) , EMGF (null) } are processed by an unsupervised model that searches to infer the unknown labels, so the Spectral Clustering technique is applied [23]. Notice how this paradigm does not require a priori assignation of the labels from the sub-movements.
Thus, the identification of data groups is performed by the similarity of the samples. When the method assigns the distinctive set from {KITF (null) , IMUF (null) , EMGF (null) }, they combine with other known groups, completing the training data set for the supervised model (SVM).
2.6 Compute of Clusters Number
In other words, the procedure is explained as follows, in the first place, the number of primitive motions (∁) is determined, the physical activities should be divided, and the previous process is done by spectral clustering (see Figure 5).
This process is performed by the data set of the joint points. The goal is to build a similar graphic based on the Ng-Jordan-Weiss algorithm for spectral clustering. The algorithm uses a Gaussian kernel given by (4) as a scale factor σ 2 to calculate an affinity matrix A ∈ R n×n where A ij = k(x i , x j ) with i ≠ j which A ii = 0. Then, from 𝐴 the affinity matrix 𝐿 is built, i.e., a place where the inputs are normalized, the data is similar to each other if they are at a maximum distance of [−1 1], i.e., the process establishes how similar x m is concerning x d evaluating k(x m , x d ), so if it is close to 1, the data is clustered to its assigned ∁ ; otherwise, set us a zero. Measurements 1 and -1 are dimensionless and therefore have no units.

Finally, these values are normalized by computing the matrix Ψ, and then, the matrix is represented in a graphic. Therefore, the number of primitive motions suggested for the data is visualized. Calculating σ 2 is inferred, as shown in [23]. It is important to clarify that giving a complete explanation of the Jordan-Weiss is too extensive for this article. Therefore, the reader could search in [24] and [23] for more details.
2.7 Activity Recognition
For activity recognition, shown in Figure 2, we put a data fusion module that centralizes the information supplied by primitive motion detection. A Hidden Markov Model (HMM) is applied as an activity classifier. This methodological instrument is shown in Figure 6.
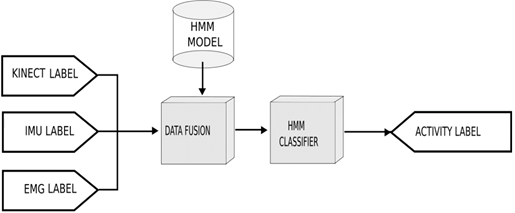
2.7.1 Data Fusion
In this stage, the labels that model the activity for each sensor modality are fused. It is important to note the information measured by the sensors is found in different frequencies. Hence, it is necessary for a module that gathers the data before applying the HMM.
To sum up, a feature vector EF is generated to linearly concatenate the set of labels delivered by the support vector machine during an observation window of 3 seconds, shown in the following structure (5).

2.7.2 Hidden Markov Model Classifier
The HMM training uses 24 states and 32 centroids to build the codebook, and this process chooses the best-performing model after achieving 100 iterations. To evaluate the performance of the trained model, we use a cross-validation strategy, which divides the database into 70 % for training and 30 % for evaluation in 100 iterations of Montecarlo experiments. The average, variance, confusion matrix, and index calculation compute the statistics acquired by the experiments. For every test, the success percentage average will be reported for each class defined by this paper.
2.8 Experiments
The experiments achieved in his work are approached from different parts. First, the joint points are analyzed by applying ReliefF and PCA, allowing the most relevant information of the sensor coordinates to be inferred (a color diagram is used as a representation scale graphic). This enables unlabeled samples to be grouped through similarity analysis and is represented graphically. We perform this procedure graphically by analyzing the values of the covariance function defined in (4), assuming the value σ 2 as an initial value of 0.3. When the number of appropriate sets for the data is identified, we evaluate the percentage of supervised labels required by primitive movement detection.
Then, we proceed with a cross-validation experiment to measure the SVM performance by changing the portion of a priori labels (from 10 % to 100 %), i.e., we change the participation of the known labels vs the unknown labels. Therefore, the model performance of the primitive movement classification is evaluated. It is essential to clarify the test seeks to establish the number of known stances by the SVM to divide the primitive motions properly. This process is done by calculating the average success concerning the number of samples classified a priori by the SVM, i.e., we establish the model capacity to recover the unknown labels by evaluating the accuracy for a different proportion of the unlabeled data.
These results will be displayed in bar charts and tables for different sensors used in this work. Also, we include the performance results by considering the different sensor modalities. These results are shown in confusion matrices using color diagrams. For physical activity In Recognition, the results are similarly displayed.
However, we compute the impact by fusing different modes for physical activity identification. The results are compared to those presented in [1]. To make the SVM training clear, we set a Gaussian kernel with a radio of (𝜏) 1 × 10 -4 and the model is trained by a Sequential Minimal Optimization (SMO) algorithm [25]. On the other hand, we clarify the value 𝜏 corresponds to an initial value [26], which is defined by a searching grid through a Montecarlo experiment.
3. RESULTS AND DISCUSSION
Figures 7 and 8 show the relevant distribution graphic for each joint point sampled by the Kinect®, IMU, and EMG sensors, according to the ReliefF and PCA techniques. The yellow points bring the most relevant information (100 %), while the blue points give the least relevant information (0 %). Figure 7 exposes that using the ReliefF technique, the main features are stored in the arms and hands, while the PCA technique (Figure 8) shows the relevant information presented in the legs. Finally, we establish ReliefF technique offers better results than PCA by bringing reliable information and using fewer joint points.
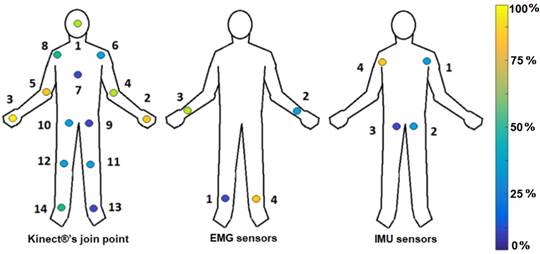
The results of the similarity analysis are shown in Figure 9 (a, b, c) for each kind of sensor (Kinect®, IMU, EMG). The Kinect®’s Graphic (Figure 9 (a)) presents the information clustered in different sets, where this could build 5, 6, or 7 clusters, but it is unknown which cluster gives the most reliable classification results.
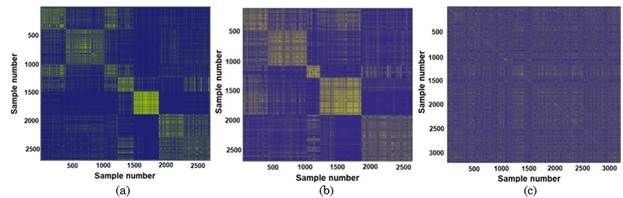
The same happens with the IMU sensor network (Figure 9 (b)). Finally, the sampled data by the EMG sensors (Figure 9 (c)) displays complete overlap, which generates a hypothesis that the data capture was inaccurate or required more EMG sensors to track the primitive motions correctly.
Given the last situation where the number of clusters is uncertain, cross-validation, the process with the SVM is performed by changing the number of sets and calculating the average performance for 200 iterations of Montecarlo. The results of this testing show that 7 clusters have the best performance (see Figure 10). The previous test is based on the low dispersion and more competitive average performance against the other settings. It is crucial to notice the goal is to compute the number of sets that enhance the performance of the primitive motions classifier because they suggest a searching restricted space automatically inferred and not being defined by a prior or by an expert.
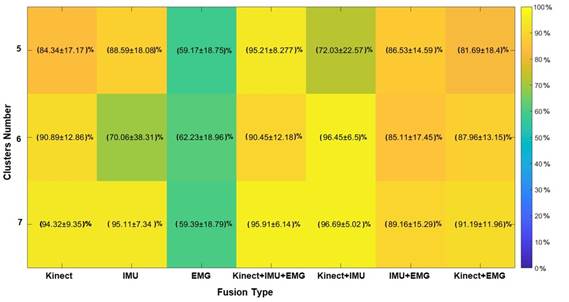
Source: Created by the authors.
Figure 10 SVM’s Classification performance with 5, 6, and 7 clusters
Figure 11 shows the results of the accuracy percentage calculation and standard deviation for a Montecarlo experiment by considering seven clusters. This proves by adding more supervised labels, the system is stabilized, and the dispersion is decreased (see Figures 11 (a) and (b)).
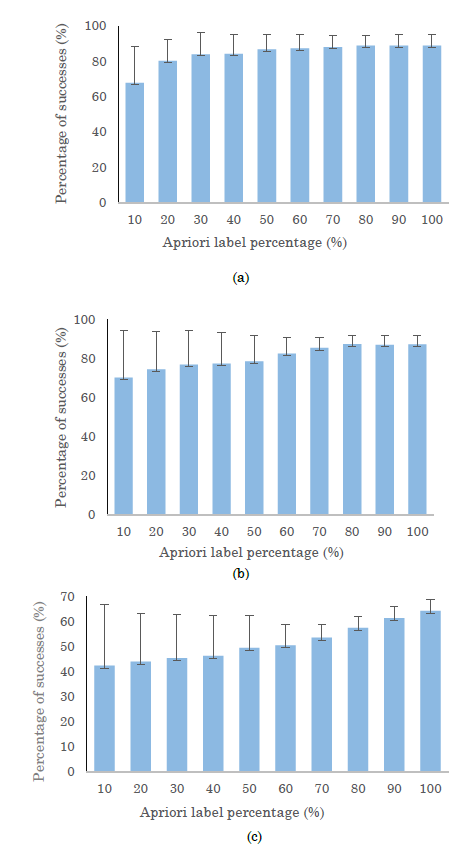
Source: Created by the authors.
Figure 11 (a) Kinect’s Performance, (b) IMU’s performance, and (c) EMG’s performance for percentage variation of samples a priori labeled by the SVM
The previous process allows us to infer a suitable percentage of labels happens when the standard deviation is stable, so the recognition process requires 80 percent of a priori samples for Kinect® and IMU modalities. Meanwhile, the EMG sensors require using 100 % of labels, i.e., they need a supervised method for this kind of modality (see Figure 11 (c)). Then, the primitive movement detection performance is verified.
Figure 12 shows the success percentage for seven primitive motions by choosing 80 % of the supervised labels. It shows a reliable performance for primitive motion detection, comparable with state-of-the-art methodologies. However, the EMG sensor only reaches an efficiency of 58.57 % ± 20.15 % despite having 100 % of the a priori labels. This behavior happens for the overlap of the samples in comparison with the other kind of sensor.
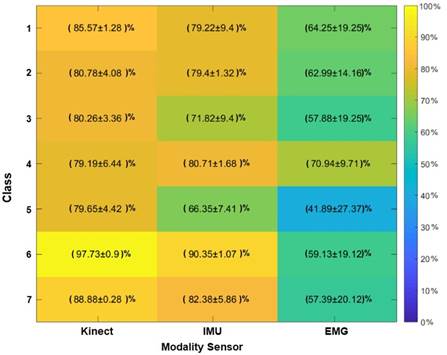
Since the performance of primitive movements is consistent, we perform physical activity recognition using the HMM. The set of labels 𝐸𝐹 are computed by the models that emulate the primitive movement codification (see Figures 10 and 12). Figure 13 presents the physical activity classifier’s performance along with the fusion sensors modality, Kinect®, IMU, and EMG, assuming seven primitive movements have better results than 6 (see Figure 10). Also, the Kinect® sensor has better average performance for classes 1, 3, and 4. IMU Sensor has high average efficiency for classes 2 and 5. Besides, it shows the best total performance average.
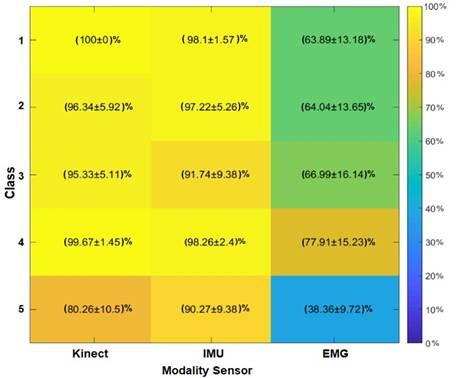
Figure 14 displays the activity classification results considering all fusion modalities: Kinect®+IMU, IMU+EMG, Kinect®+EMG, and Kinect®+IMU+EMG. In Figure 14, we show the sensor modality, Kinect®+IMU, delivers the best average performance for class 1 (along with the modality, Kinect®+IMU+EMG), 2, 3, and 5; also, it has the best total average. Meanwhile, IMU+EMG fusion only has the best average performance for class 4.
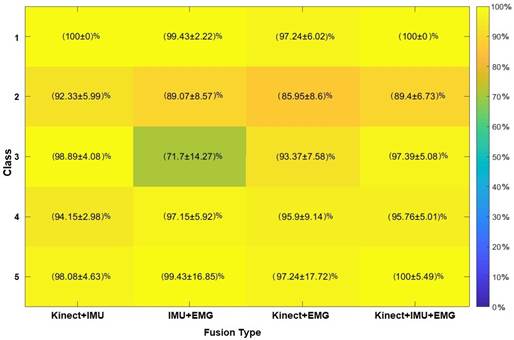
The results in Figure 14 suggest uncertainty levels greater than 5 %. This phenomenon occurs due to the variability induced by the EMG modality (see IMU+EMG and Kinect®+EMG). In both fusions, the classifier is confounded (see Figure 14). Although EMG reduces classifier performance, note how the fusion method improves the performance provided by electromyography. This implies that sensor fusion helps to strengthen the individual weakness of each modality and increases classification performance. The above indicates that the EMG modality should not be included since the variability of the fusions is less or similar for the Kinect® and the IMU (comparing the standard deviation of classes 1, 2, and 5).
On the other hand, the performance of the Kinect®+IMU and Kinect®+IMU+EMG fusions is interesting because it improves the stability in the classification, allowing all classes to present detection with greater than 89 % accuracy. Note that the fusion of the three types of sensors does not show the best hit performance due to the instability presented by the EMG modality. This implies that future research is required, in which other forms of description are explored, as well as the inclusion of an EMG sensor network with more sensing points. Although this research is required, the results demonstrate the fulfillment of our hypothesis. This focuses on the primitive motions classification without labels and the competitive performance of the method with other developments in the literature. Finally, we compare the results of this work with another state-of-the-art methodology, such as [1].
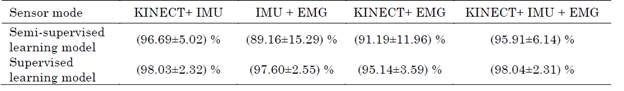
We chose this work because it uses a supervised classification strategy for primitive motion detection, which allows us to test the performance and hypothesis of this research.Table 1 shows that the supervised method performs similarly to the unsupervised method. However, the supervised system evidence is in lower deviation; this is observed in the mergers, IMU+EMG, Kinect®+EMG, and Kinect®+IMU+EMG. The above information suggests that the overlap between the EMG database samples hinders the performance of the semi-supervised learning methodology for labeling activities. Although our method has lower performance, its hit rate is competitive, which makes it attractive for this type of application.
Also, Table 1 evidence the difference in the standard deviations between both methods. Note that merging with EMG results in lower accuracy of the semi-supervised algorithm in labeling the activities. This is due to the uncertainty built in each Montecarlo experiment cycle to evaluate the performance of the unsupervised learning technique because it implies changing the selection of the 80 % of the labels in each test, developing fake classifications of micro-movement that impact the physical activity detector’s Performance (HMM). Although the result is lower, the Kinect + IMU and Kinect+IMU+EMG mergers present competitive results, demonstrating the usefulness of this method. The previous is an advantage for the field since fewer labels are required to classify the same activities, translating into less time to train the model and possible costs in labeling the database.
4. CONCLUSIONS
This work presents a methodology that classifies human physical activity through a semi-supervised learning approach; this process defines an automatic method that allows computing the number of micro-movements where the physical activity should be divided and looking at the results from Figure 10. This parameter affects the performance and stability of the SVM. On the other hand, the results in Figure 11 show the robustness of the SVM method for the primitive motions classification when the percentage of known labels is close to 80 %. The previous process is due to the average performance, and uncertainty is similar to a supervised learning approach, i.e., the performance is statistically overlapped.
The results in Table 1 suggest a supervised learning procedure is more stable concerning unsupervised learning due to the lower dispersion, and this behavior prevails for all the sensor modalities presented in this article. However, the results from the fusion of Kinect+IMU and Kinect+IMU+EMG show similar behavior for both strategies. This suggests that the semi-supervised approach is competitive for physical human activity classification against the unsupervised one under these modalities. These results are shown in Figure 14, where the fusion from some sensor modalities (Kinect+IMU) achieves high average performance and stabilizes the uncertainty values for action recognition.

