


 Inglés (pdf)
 Articulo en XML
 Referencias del artículo
 Enviar articulo por email
 Citado por SciELO
  Citado por Google
  Similares en
SciELO
Similares en
SciELO  Similares en Google
 Permalink
1. INTRODUCTION
Addressing the uncertainties associated with solar radiation becomes imperative with the increasing demand for sustainable and renewable energy sources. These uncertainties arise due to weather patterns, seasonal changes, and geographical diversity variations. Consequently, accurately predicting solar radiation becomes crucial for efficiently planning and optimizing electricity generation systems. Researchers have turned to advanced computational models and Machine-Learning techniques to tackle this issue. These models leverage historical and real-time data to develop predictive algorithms capable of estimating solar radiation levels with high accuracy. By considering factors such as geographical location, weather patterns, and historical solar radiation data, these models help optimize the planning and operation of solar power systems, thereby maximizing their efficiency and output. Thus, less uncertainty of the power produced by variable renewable sources can lead to optimal planning that directly impacts the end user [1].
In Colombia, the utilization of non-conventional renewable energy sources utilizing variable primary resources is still in its early development. While the majority of energy generation in the Colombian energy matrix comes from renewable sources, with hydroelectric generation contributing 70 % to the National Electric Interconnected System, the hydroelectric sector in Colombia exhibits vulnerabilities. The nation is confronted with the risk of electricity rationing due to factors like climate change and El Niño, as observed in past years, including 1992, 1995, 2005, and 2015 [2].
This situation highlights the need to diversify the energy matrix and strengthen the integration of other renewable energy sources, especially those that do not depend directly on climatic conditions. The lack of rain affects the availability of water resources for hydroelectric generation, emphasizing the importance of exploring and developing technologies that use more stable renewable energy sources, such as solar, wind, or biomass energy [3]. As shown by [4], [5], digitization can help integrate variable renewables by allowing networks to better adapt energy demand to times when the sun is shining, and the wind is blowing. Certainty of primary resource data immediately ensures that energy is consumed when and where it is needed, improving energy services' responsiveness [6].
Numerical models are employed in the first stages of predicting and estimating solar radiation. These models, characterized by a deterministic framework, establish relationships through coefficients linking extraterrestrial radiation to ground-level measurements [7]-[11]. The weaknesses of this type of model are that they do not capture the non-linearity of the resource and its relationship with other climate data, in addition to being highly geolocated, which translates into a model over-adjusted to a region. The second type of model is analytical-statistical. Statistical approximations are considered analytical since they treat radiation as a signal that can be decomposed and studied, which will be an input to generate a model like the historical one [12].
As an example, in [2], [13], predictive models can be bifurcated into two distinct groups. The initial group encompasses the utilization of components from classical statistics, while the second group involves the application of stochastic methodologies, specifically Artificial Intelligence (AI) and Machine Learning (ML). Stochastic models, particularly ML, are intricately defined within the realm of computer science and are formally classified as a subset of AI methodologies.
For Machine Learning (ML) applications in primary solar resource prediction, the number of stages changes. Due to climate variability and the dependence on climate data radiation, a classification stage is presented before clustering [14]-[16]. The objective of this stage is to classify the study data in different types of climates according to the condition. The choice of the technique or techniques for these stages first involves establishing criteria that allow evaluating strengths and weaknesses in data processing to find the ones that best suit the database to be used, the climate region under study, management of the non-linearity of the resource, and future horizon.
The article's structure is as follows: Section 2 shows the materials and methods used in the model's design, section 3 explains the ML model, section 4 shows the results and discussion of the model in its application to Colombian data, and Section 5 presents the conclusions.
2. MATERIALS AND METHODS
2.1 Criteria for the design of the model
In [2] show the prediction of the primary resource using Machine Learning, a three-stage process is employed. The initial stage involves the preprocessing and classification of data, followed by the input stage, and the final stage is dedicated to handling the discrepancy between estimated and measured data.
Furthermore, when utilizing a Machine Learning model, the following aspects are taken into consideration:
Addressing non-linearities.
Evaluating behavior with multiple inputs.
Considering the forecast horizon.
Analyzing the response of the model.
Assessing its flexibility.
Table 1 displays the most used simple predictors for predicting the primary solar resource. These predictors are compared based on their performance in handling highly nonlinear data, utilization of multiple inputs, lower uncertainty in outcomes, flexibility in input changes, and deviation exhibited compared to their counterparts. Additionally, the prediction horizon, defined as the future time for which the prediction will be made, is taken into consideration [17]-[20] This represents the new challenge in the stage where data processing is combined with AI and ML as an established element to make reliable real-time decisions that contribute to the unification of concepts. By integrating these advanced methods and techniques, higher accuracy and understanding in solar resource prediction are achieved, enabling more informed and efficient decision-making in renewable energy planning and management [21].
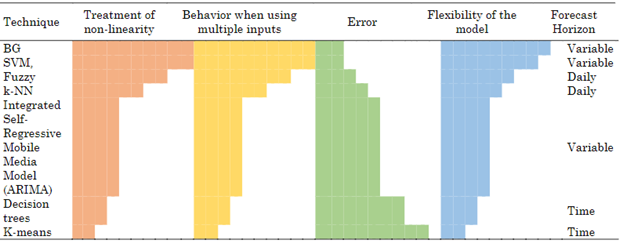
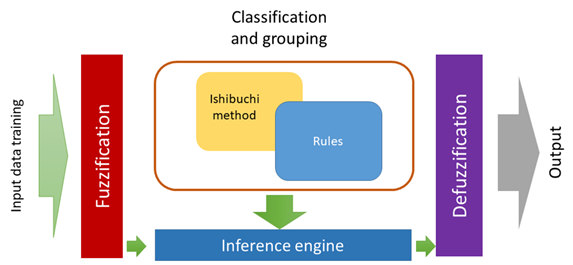
If the aim is to maximize the strengths of the techniques at different stages of the model, a hybrid-type topology is proposed to achieve higher efficiency and accuracy in solar resource prediction. This topology, depicted in Figure 1, is based on the combination of two or more simple predictors. By integrating multiple predictors, a more comprehensive and precise understanding of the variables involved in the prediction can be obtained, overcoming individual limitations of each predictor, and enhancing the quality of predictions.
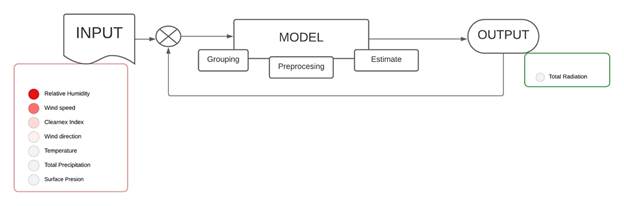
The hybrid topology leverages the strengths of each predictor, whether it be in handling nonlinear data, utilizing multiple inputs, reducing uncertainty in outcomes, or providing flexibility in input changes. By combining these strengths, a more robust and reliable approach for solar resource prediction is achieved. Furthermore, the hybrid topology considers the importance of the prediction horizon, which refers to the future time period for which the prediction will be made. This allows the model to be adapted to different needs and scenarios, offering the ability to make short, medium, and long-term predictions [22]-[25]. Within a hybrid topology, input data is viewed as signals and undergoes a series of three procedures: (1) pre-processing, which entails identifying data types and categories, and employing regular techniques to substitute missing data; (2) grouping, where climate profiles and classification trends are outlined within the climate data, whether on a daily or monthly scale; (3) estimation, involving the establishment of relationships between input and output to identify the most suitable connection defining a primary resource profile.
2.2 Database input in the development of the model
The above considerations are considered because each geographic location has a unique solar resource profile that varies continuously depending on the time, day, season, and year. In addition, radiation depends on other climatic parameters, which make it highly variable and with a high non-linearity profile [21]. As explained in the introduction, Colombia is in the process of entering photovoltaic solar systems into its energy matrix. However, the electrical power of these systems and their accuracy depends on a variable primary resource in a country with 5 thermal floors and temperatures from zero degrees to 40 ºC and the geolocation of the installation of Photovoltaic Solar Generation Units [6], [26].
In these Units, the variability of primary resources represents the greatest uncertainty in the assessment of future performance in a photovoltaic power plant. To try to minimize these effects, three aspects that relate solar resource data should be considered in the modeling and planning process of a solar project [27]:
Primary resource data with a 10-year history for site selection during feasibility studies.
Quantification of the power generated by the plant, value used in the design and subsequently in economic studies of the plant.
Real-time measurement and prediction of the operation of the isolated photovoltaic system and the grid.
A summary of the requirements that the database must meet according to the application scenario is shown in Table 2.
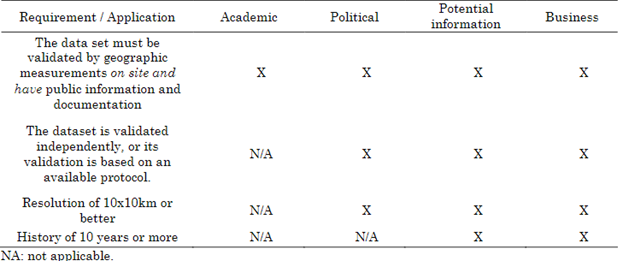
The chosen database is the PowerViewer database provided by the National Aeronautics and Space Administration (NASA). While its spatial resolution falls short of 10 x 10 km, the data undergo a validation process through soil measurements, and there is extensive documentation available detailing its development.
3. DEVELOPMENT OF THE MODEL
3.1 General in the development of the model
The proposed model is shown in Figure 2. Consists of three stages. In the first stage, a fuzzy algorithm is employed to group and classify the input variables based on the high variability of climate data in the Colombian climate. This algorithm allows for more precise classification by defining linguistic variables and conditional "if-then" rules. These linguistic variables, such as cloudy, rainy, and sunny, capture the different weather conditions. The conditional rules are used to establish relationships between the climate data and the clarity index, which serves as a precursor to incident solar radiation.
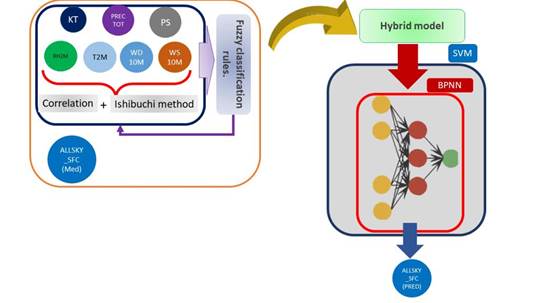
Preprocessing and grouping: Fuzzy Logic is opted for this phase due to its adeptness in uncovering patterns within data, handling multiple inputs efficiently, and classifying climate information and ground data across diverse weather conditions-sunny, cloudy, and rainy, along with their various combinations [30], [31]. These distinctive features position Fuzzy Logic as an ideal technique for categorizing the specific climatic variations observed in Colombia.
Estimation: For this stage, the predictive models considered are NN (Neural Network) and SVM (Support Vector Machine), employed in tandem. Both models exhibit the capability to capture the inherent high linearity of radiation while maintaining a low prognostic error. The flexibility inherent in the combined approach allows for the integration of geographical considerations, including latitude and longitude, into the model. In the case of NN, its ability to handle more than three variables in the input is essential; it identifies relationships between climate data and geographical location, subsequently injecting that profile into SVM, which serves as the primary resource predictor. The necessary membership functions are generated where the values will be classified as they enter the model, and the rules will be changed according to the new data entries. Figure 3 illustrates the Fuzzy classifier components used in the model [28].
The fuzzy approach is particularly suitable for the Colombian climate, which exhibits significant climate variations across different regions of the country. By incorporating fuzzy logic, the model can effectively handle the inherent uncertainty and imprecision in climate data, thus improving the accuracy of solar resource predictions. The utilization of the clarity index as a key predictor in the model is essential as it provides an indirect measure of incident solar radiation. The conditional rules enable the capture of complex relationships between the climate data and the clarity index, adapting to the specific climate patterns of Colombia.
The performance of this technique relies on an important parameter known as the kernel function, which serves as the core component of the SVM model. The kernel is a characteristic feature of SVMs that enables the mapping of variables from a lower-dimensional space to a higher-dimensional one. In the ongoing model development, the chosen kernel is the NN with a geographic component.
According to the theory, if a projection is used  . Where X is the input data vector and 𝐻 the Hyperplane of Separation. The Internal Product of points
  It can be represented by a kernel function k, as shown in (1).

This nonlinear kernel plays a crucial role in expanding the input dimensions of the predictor through matrix-based vector data, facilitating effective separation and accurate prediction of the primary resource. The objective of the NN is to incorporate additional geographic features, such as latitude and longitude, which exhibit significant correlations with the measured climatic data. Figure depicts this critical stage of the model where the SVM is effectively utilized. Figure 4 depicts the components of the primary predictor and the data inputs.
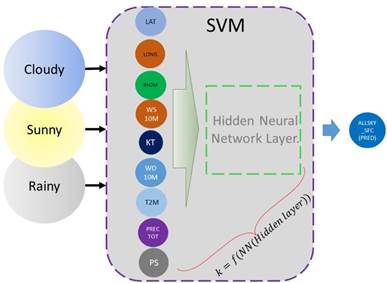
As shown in Figure 4, once the function type of the NN core has been established, it is possible to work in spaces of any dimension without redoing the characterization process. This is based on the ability of NNs to capture multiple inputs that could be applied directly to other data without the need for a feature extraction process. A powerful combination of techniques is employed for the prediction stage: Neural Networks (NN) and Support Vector Machines (SVM). Initially, SVM was used primarily as a classifier, but its current trend is to utilize it as a predictor due to its generalization capabilities. In this research work, the focus has been on developing this technique, leveraging its strong adaptability to the data. Furthermore, it is worth noting that its widespread usage as a predictor for primary resources has been extensively documented in the literature [29]-[31].
4. RESULTS AND DISCUSSION
4.1 Behavior of the model
Thanks to its privileged geographical position, Colombia stands out for its incredible climatic diversity and thermal floors, ranging from coastal areas to snow-capped peaks. This climatic variability poses a challenge for accurate solar resource prediction, as it requires a model capable of capturing the non-linearities and peculiarities of each region.
In this research work, selected five cities representing different climatic regions in Colombia will serve as scenarios to simulate and exemplify the performance of the proposed model. The PowerData climate database will be used with databases from six cities in mountainous regions, lush jungles, vast plains, and the stunning Pacific and Atlantic coasts. This combination of geographically diverse data sources ensures a robust representation of the country's climatic variability.
Table 3 complements this research by providing detailed geographical information about each of the selected regions. This information includes locations, altitudes, geographical features, and other relevant data essential for understanding each city's climatic context and its impact on solar resource prediction.
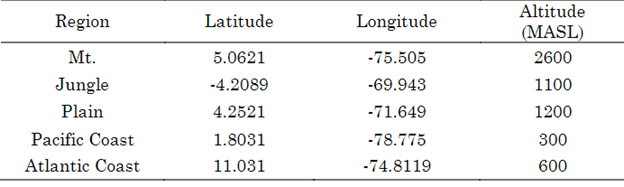
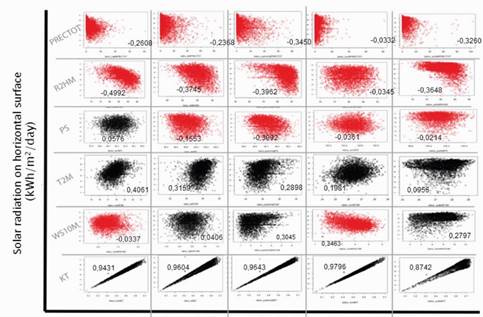
When changing the geographical location, weather data and daily profiles are altered. The model needs to capture this geographic-climatic variability and provide accurate predictions of the primary resource. In the mentioned regions, we have 3965 observations representing the daily average of climate data collected over a period of more than ten years, from 01/01/2009 to 31/07/2022. Approximately 70 % of these data (2700) are used for training the model, while the remaining 30 % (1265) is reserved for testing in all cities. Figure 5 shows that 40 % of the training data is allocated to train the fuzzy algorithm, and 60 % is allocated to the neural network (NN). On the x-axis, the time interval for each variable measurement is displayed, and on the y-axis, the normalized magnitude of each variable is shown. This combination of approaches allows us to leverage the strengths of both methods and better understand the variability of the solar resources in each region. The jungle region exhibits a lower average primary resource value than other cities. This is due to an extended rainy season lasting 5 to 6 months per year. Additionally, despite being coastal regions of the Pacific and Atlantic, there are significant differences due to the influence of the Humboldt current and the cold currents that traverse the Pacific coast [32].
Source: Own elaboration.
Figure 5 Daily radiation and climate data correlation graphs from 01/01/2008 to 07/31/2022
The climatic profiles of the jungle, plains, and the Atlantic coast reveal similarities in evaluating the correlation between humidity and incident radiation, which is notable in these regions. Specifically, a similar profile is observed for the humidity variable across all three types of geography. However, due to the variability of the profile in each city, it is not possible to draw definitive conclusions about the behavior of the other variables. This aspect is addressed by using fuzzy rules, which allow us to infer the type of day based on climatic data, rather than relying solely on the correlation coefficient associated with the city under study. It is worth noting that Figure 5 shows the presence of climatic variables with a positive correlation, such as the Clarity Index and the temperature at two meters, in all cities. A more pronounced correlation is observed for the Clarity Index compared to temperature.
In the mountain climate and on the Pacific coast, unlike other regions, there is an inverse relationship between wind speed and radiation. In the first city, this is due to the movement of cloud masses formed in the mountain range, which are carried by the wind and affect the incident radiation in the city. In the second city, this inverse relationship is due to the flow of sea currents coming from the south of the continent, leading to a higher air mass coefficient (AM) that disperses radiation across different wavelengths. For other variables, the coefficient varies, preventing adequate generalizations for the model and inferring the type of day.
4.2 Model simulation scenarios
A solar radiation prediction model based on ML is designed. It has the following attributes:
Hybrid predictive topology.
Implementation of classification-grouping (fuzzy logic) and estimation stages (SVM + NN).
The approximate logic is robust because it is not exclusive and can intersect the membership functions in the classification.
SVM has strengths in terms of input data handling, high non-linearity, and the possibility of geolocation of the estimate when handling the geographical component (NN core).
Inclusion of a dynamic kernel (NN) function that contributes to the prediction of primary resources depending on the geographical location.
The ML hybrid prediction model is successfully implemented in the mentioned 5 cities. This revolutionary model intelligently combines the power of the fuzzy classifier, neural network, and support vector machine. To ensure accuracy and avoid excessive adjustments, extensive work has been done on the dataset, preventing the generation of unwanted trends. In this crucial stage, incident radiation on a horizontal surface is excluded, and the focus is on classifying the day based on the clarity index. To achieve this, the acclaimed Ishibashi method (FRBCS. W) is implemented in the fuzzy stage of the model. This approach, based on spatial divisions, allows for exceptional results and a deep understanding of climatic patterns.
The dataset is carefully divided into training and testing stages, utilizing 85 % of the data for training and the remaining 15 % for testing. During the process, equal fuzzy regions are created for the input variables (training) and output (clarity index), enabling precise and reliable formation of the distinct regions of rain, cloudy, and sunny.
Furthermore, the nonlinear core of the model plays a crucial role in generating meaningful variables. This core is achieved by including a hyperplane that separates the input values and harnessing the power of the inner product between the support vectors. This advanced approach ensures higher prediction accuracy and a deeper understanding of the factors influencing the clarity index.
Table 4 shows the parameters of the SVM regression model. The error penalty tolerance value 𝜀 is displayed, which depends on the core function to pass or not a value with an error level. This value changes in all cities, but in the Pacific region it reaches its highest value because the model fails to fully capture the climate profile of the city. Therefore, a profile with higher error should be allowed. The support vector machine relates the day types to the other climate data. When considering a nonlinear hyperplane of data separation, it is possible that the model captures the geographical variations of the Colombian climate and gives a predictive response one day to the future as a prediction horizon.
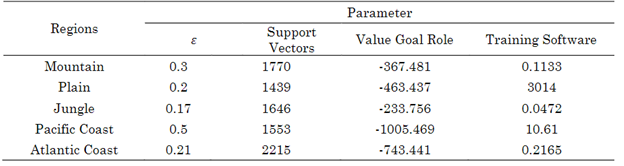
The values of the objective function are highly variable due to the divergences between the vectors that support the hyperplane in each city, determined by the geographical nucleus. It is particularly noteworthy that the Pacific coast region has the lowest value of this function, which is associated with a significant error in the predictions. This suggests that the model fails to capture the complex climate variations in this region adequately. It is important to note that while two model runs do not yield the same results, a consistent trend of values by region is observed. This variability is attributed to the nonlinear stage of the neural network and the calculation of the inner product in the SVM predictor, which introduce some uncertainty in the results.
The divergence in the values of the objective function between regions can be attributed to multiple factors, such as the specific geographic and climatic variability of each area. Atmospheric conditions, topography, and other geographical elements influence the measurements and the relationship between climatic variables. Therefore, it is essential to consider these differences when interpreting the results and applying the model in different geographic regions.
4.3 Discussion
The results presented in the previous section have two important interpretations. From a statistical perspective and data usage, the model is observed to be robust and exhibits good performance. There is no evidence of systematic errors in the data, and the selected predictors fulfill their objective. It is worth noting that the weaknesses of the model are attributed more to geographical factors than to issues with data processing or model stages. The use of diverse climatic data from heterogeneous regions is beneficial as it avoids biased approaches based on a single dataset. Furthermore, the hybridization of predictors, particularly the combination of neural networks (NN) and support vector machines (SVM), allows for handling larger datasets, achieving computational efficiency, and addressing the high non-linearity of the resource.
From the perspective of distributed generation planning, the model's results are promising. The model provides a satisfactory response by requiring low uncertainty in predicting and quantifying the primary resource for the installation of solar energy solutions. This enables the reliable projection of the amount of energy that can be installed in a distributed manner. These findings are encouraging for those involved in renewable energy generation planning, as having a reliable and accurate model is crucial for informed decision-making and maximizing the utilization of available solar resources.
The following section shows the validation of the model. This process is developed considering statistical metrics that evaluate the degree of cohesion between the data predicted by the model and the measured data.
5. MODEL VALIDATION
For this research, the following statistical type metrics are used in the validation of the model:
Pearson's coefficient (r)
The mean square error (MSE)
Bias measures how much the mean values differ from the simulated and measured data.
The variance measures the degree of agreement between the model estimate and the degree of variability in the measured value. The covariance measures the non-systematic error, that is, the error that remains after evaluating the deviations of the mean and the variance.
The root of the mean square error (RMSE) is more sensitive to abrupt variations in prediction results and is therefore suitable for applications where lower value errors are more tolerable and larger errors cause disproportionately high costs.
To validate the proposed model, the statistical metrics outlined previously, along with graphical tools, are utilized. As indicated by [33], these tools are considered valid for showcasing the model results. The graphical tool's strengths lie in illustrating the correlation between the measured and predicted data, uncovering biases and systematic deviations based on radiation conditions, and depicting the range of deviations associated with the predictors. The fact that being a hybrid model validates the total response of the model and not by individual stages [34] is highlighted.
Figure 6 demonstrates the model's impressive performance in capturing the non-linearity of the primary resource, effectively managing input variables, and exhibiting flexibility when evaluated across diverse geographic locations. The fuzzy stage operates successfully in all regions, effectively classifying and providing daily profiles to the model, which are then translated into radiation values based on the specific day. In mountainous and plain regions, the radiation values tend to represent rainy and sunny days, resulting in the intermediate radiation values, which directly correlate with average radiation profiles, not being fully represented. Conversely, the Atlantic coast exhibits high radiation values, allowing the model to accurately respond to the characteristic trend of both cloudy and sunny days in this region.
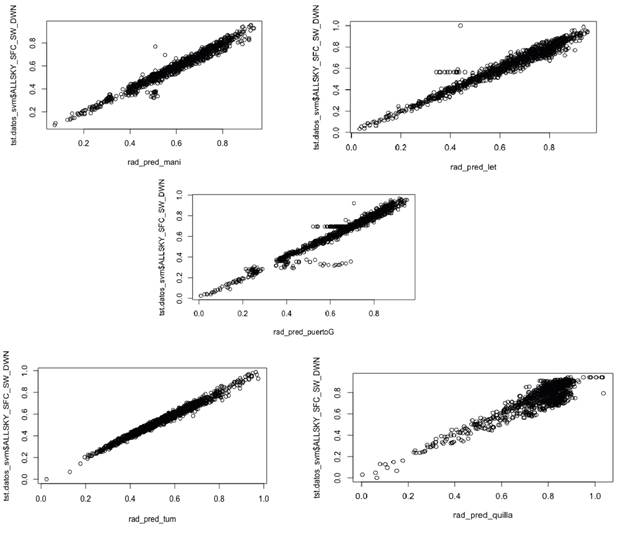
Table 5 shows statistical validation metrics for the cities evaluated. The behavior of the model in cities is shown considering the statistical metrics described above: Pearson coefficient, bias, variance, covariance, MSE and RMSE.
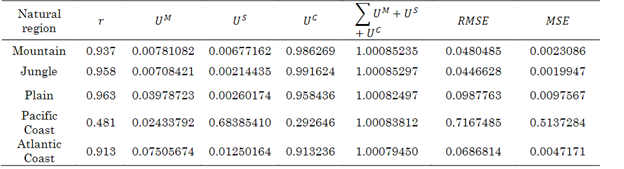
Analyzing the correlation, the model stands out for its robustness in predicting resources in the evaluated cities, as it shows a high correlation in most of them, approaching unity. However, lower performance is observed in the Pacific coast, as indicated by the metrics. This is due to the model's inability to capture the pronounced variability of the resource in this region, which is related to the warm air currents coming from the south. Consequently, a lower correlation is obtained compared to the other cities. Regarding bias, it is evident that the value is small in all cities. This indicates the absence of systematic errors between the model and the test data, which is positive. Furthermore, it demonstrates that the prediction parameter is correctly reflected in the model, without internal issues in terms of weight calculation and trends in the different stages of the model.
The model exhibits a strong correlation in most of the evaluated cities, demonstrating a good capacity for resource prediction. Although lower performance is observed in the Pacific coast due to resource variability, the overall bias is low in all cities, supporting the validity and accuracy of the model.
6. CONCLUSIONS
In summary, the model developed in this work provides a valuable tool for quantifying and predicting the primary solar resource in Colombia, considering the country's geographical conditions. This contributes to the development and visibility of computer techniques used to support decision-making processes in the growth of Distributed Generation with photovoltaic sources.
The data sets used in this model have various applications, ranging from opening the debate on strategic-level policies to conducting market assessments. In particular, the terms "Potential" and "Business Information" are key areas where accurate indicators are needed to support decision-making. The importance of these data lies in the fact that the former activity does not consider financial commitments, while the latter considers the costs and economic and electrical effects in project development on the power grid.
Short-term machine learning techniques, such as those used in this model, are highly useful for predicting demand in very short time intervals. This enables informed decisions regarding the feasibility of photovoltaic solar generation in isolated areas or the implementation of hybrid energy systems. Additionally, machine learning can serve as an effective tool for developing demand trends by regions, facilitating geographically distributed planning of photovoltaic systems and diversifying Colombia's energy matrix.
This model offers a solid and promising perspective for managing solar resources in Colombia, providing support for strategic decision-making, and opening new opportunities in the renewable energy sector. The use of machine learning techniques and data analysis provides a strong foundation for the planning and effective implementation of solar energy solutions in the country.

