


 text in
  English (pdf)
 Article in xml format
 Article references
 Send this article by e-mail
 Cited by SciELO
  Cited by Google
  Similars in
SciELO
Similars in
SciELO  Similars in Google
 Permalink
Introduction
Inequality is a historical and structural characteristic of different countries. Latin America is one of the continents with the greatest economic and social disparities (De la Torre, Messina & Silva, 2017). Research on the impact of inequality has showed that it is related to lower levels of economic and human development (Watkins, 2013), and to greater social and educational problems (Haveman & Smeeding, 2006). Inequality is often perceived as unfair and generates behaviors that perpetuate it (Kraus, Park, & Tan, 2017). Thus, resources are distributed unequally and according to individuals standing in a social hierarchy. Various authors have explored, through experimental games, the effect of social hierarchies on the allocation of monetary resources, showing that people with a lower social status demand less money, and that they are more altruistic than those with a higher social status (Hu et al., 2016; Piff, Kraus, Côté, Cheng, & Keltner 2010). However, other authors have observed that people resist to inequitable outcomes, that is, they would be prepared to lose some money in order to gain more equity (Fehr & Schmidt, 1999). This preference is known as inequity aversion, which occurs when a person dislikes outcomes that are perceived as inequitable. Consistent with the inequity-aversion model, Tricomi, Rangel, Camerer and O'Doherty (2010) found that rich players transfer less money to themselves and more money to other poor players. However, Starmans, Sheskin and Bloom (2017) noted that people prefer unequal societies. They argue that inequality is confounded with unfairness. That is, individuals prefer fair but not equal distribution. That highlights the need to continue researching the preferences on the distribution of resources. Hence, this study analyzes the effect of social status on the distribution of monetary resources in students aged 18 to 25 years from Córdoba (Argentina).
Social hierarchies exist in most species, and they are an organizing principle of social groups (Bshary, Gingins, & Vail, 2014). Hierarchy refers to the classification of individuals according to their social status, power and dominance (Zink et al., 2008). Multiple aspects determine the standing of each member in the hierarchy, such as power, dominance and social status. Social status (SS) is a strong predictor of well-being, morbidity and survival (Sapolsky, 2004). SS refers to an individual's standing in the hierarchy, it also alludes to honor, prestige and respect in a relevant dimension or field (Ball, Eckel, Grossman, & Zame, 2001; Henrich & Gil-White, 2001). Status can be inferred through physical attributes, interpersonal characteristics, non-perceptual keys (such as income or occupation), performance hierarchies, and social signals such as military symbols (e.g., Chiao et al., 2009; Koski, Xie & Olson, 2015). For instance, Zink et al. (2008) argued that military symbols and star systems reinforce the position in the hierarchy.
Researchers often use experimental studies to investigate SS in order to control and identify the role of specific factors such as sex or race (Karafin, Tranel, & Adolphs, 2004). In a recent review, Mola, Godoy and Reyna (2018) reported that different procedures are used to generate SS in experimental situations. For example, various researchers used inductions based on ability implementing tasks such as reaction time task, math questions, multiple choice questions (Ball & Eckel, 1996; Boksem, Kostermans, Milivojevice, & De Cremer, 2012; Blue, Hu, Wang, van Dijk, & Zhou, 2016). Boksem and collaborators used a reaction time task to generate SS. In this task the participants had to press a button for 1s after a blue circle had turned green. Responses were considered correct when they occurred within a certain time interval and the duration of the interval was based on the subject's performance. Thus, SS of the participants was based on the percentage of correct answers (see Boksem et al., 2012).
Other authors have used an induction based on a mixture of ability and chance implementing a task of multiple choice questions. Albrecht, von Essen, Fliessbach and Falk (2013) postulated that ability refers to capacity (e.g., knowing the correct answer) whereas chance alludes to coincidence (e.g., guessing the correct answer). In accordance with Albrecht et al.'s position (2013), the authors of the present research believe that ability and chance play an important role when a person acquires their SS, and it is relevant to model it experimentally. Along the same line, Mola et al. (2018) reported that there is no agreement around what induction to use and that the diversity of tasks has produced divergent results (e.g., Hu, Cao, Blue, & Zhou, 2014; Hu et al., 2016). Thus, they proposed an SS induction that considers strengths of other inductions and non-priority aspects of SS generation, such as the use of chance and ability. In that induction the authors used the reaction time task (Boksem et al., 2012; Hu et al., 2014; Zink et al., 2008). They implemented chance by using a modified version of the time interval proposed by Boksem et al. (2012). Ability was measured by comparing individual with group performance. Ability-based inductions are used extensively by researchers, but the authors of the present work believe that this procedure does not reflect how social status is obtained. Therefore, in Experiment 1 the effect of two SS inductions (Boksem et al., 2012 Mola et al., 2018) on cooperative decisions was compared.
SS provides information about the perception of other people's behavior to guide decisions affecting the distribution of resources among individuals (Ball et al., 2001). Several studies have shown that SS influence economic decisions and distributive justice. For example, individuals with a higher SS were less satisfied with an unfavorable payoff than individuals with an inferior SS (Albrecht et al., 2013). Also, it has been observed that when people are assigned to a high SS experimental condition they reject more unfair offers in the Ultimatum Game (UG) than when they are in a low SS condition (Hu et al., 2016). In addition, people's beliefs about their position on the social ladder, i.e., Subjective Social Status (SSS), have shown to affect pro-social behavior. For example, people with a lower SSS were more generous in the Dictator Game (DG) than people with a higher SSS (Piff et al., 2010).
In the field of Behavioral Economics and Social Neuroscience, UG and DG are two economic games widely used to measure social preferences in the distribution of economic resources (Camerer, 2003). In the classic UG, player 1 (proponent) proposes player 2 (respondent) the division of a sum of money. Player 2 may accept the offer, where both players gain the amount offered by the proponent, or he may reject it, and then both players receive nothing (Güth, Schmittberger, & Schwarz, 1982). In DG, player 1 (dictator) divides an amount of money between him and player 2 (recipient). In contrast to the UG, player 2 receives the offer from the dictator (Bolton, Katok, & Zwick, 1998). Some researchers suggest that decisions in these games are influenced by Social Value Orientation (SVO) (Van Lange, Joireman, Parks, & Van Dijk, 2013) and by emotions (Civai, Corradi-Dell' Acqua, Gamer, & Rumiati, 2010). With respect to SVO, or people's preferences for allocating resources to themselves and others, Reyna, Belaus, Mola, Acosta and Ortiz (2018) observed that pro-socials made fairer offers (in the DG) and offered a higher amount of money (in the UG) than pro-selves. However, evidence is controversial, because other authors did not find a significant relationship between SVO and decisions in the DG (Yamagishi et al., 2013) and the UG (Haesevoets, Folmer, & Van Hiel, 2015). This may be due to the fact that SVO was evaluated with different scales (e.g., TDO Measure and SVO-SM) or different versions of the games were used. Regarding emotions, previous studies have reported that emotional valence and negative emotions are related to the rejection of unfair offers in the UG. For example, Xiang, Lohrenz and Montague (2013) showed that the participants perceived unfair offers as more unpleasant than intermediate and fair offers. In addition, Hu et al. (2014) hypothesized that emotions could be a relevant factor in decision making because individuals with low status experience stronger negative emotions than individuals with high status. Thus, in Experiment 2, the role of the SS in decisions in the UG and the DG was analyzed, considering the SVO and SSS as covariates. In addition, the emotional valence and arousal generated by unfair and fair offers in the UG was evaluated.
The behavior in these games is sensitive to context properties, such as the framing effect (Levitt & List, 2007). In other words, people respond differently to distinct but equivalent descriptions of the same problem (Levin, Schneider & Gaeth, 1998). To analyze the framing effect, a modified version of the DG was used, called Taking (DGT). In this version, different from the classical one, the dictator, instead of offering money, decides how much money to take from the recipient. List (2007) observed that participants were more altruistic in the DGT than in the DG. However, these results are not conclusive because other authors did not find differences between the decisions in the DG and the DGT (e.g., Suvoy, 2003). Previous studies on hierarchy focusing on social class -also referred to as SSS- (Kraus, Piff, & Keltner, 2009), have shown that participants with a lower social class increased pro-social behavior compared to those with a higher social class in the DG (Piff et al., 2010). However, social class and SS are not the same. Social class refers to one's economic, professional, or educational standing while SS involves prestige and respect in a relevant dimension, as the profession (Henrich & Gil-White, 2001). Due to the lack of research on the role of SS in altruistic behavior comparing the DG and the DGT, Experiment 3 analyzed the effect of SS on decisions in the DG and the DGT, considering SVO and SSS as covariates.
Experiment 1
This experiment analyzed the effect of two inductions of SS on the decisions in the UG and DG: 1) Boksem et al. (2012) and 2) Mola et al. (2018). It was hypothesized that participants with high SS defined from induction 2 would have different percentage of offer rejection (UG) and amounts offered (DG) than participants in the other SS conditions.
Method
Design
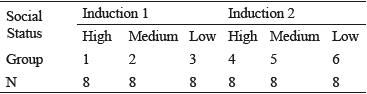
A 6 (type of SS induction) x 3 (offer fairness) between-participant factorial design was implemented (See Table 1). The dependent variables were the percentage of offers rejection in the UG and the amount of money offered in the DG. The experiment was carried out in two phases. In the first phase, the participants were exposed to one type of SS induction (Induction1 and 2) and in the second phase, they played the experimental games.
Participants
Participants were seventy-two students from Córdoba (Argentina) aged between 18 to 25 years (M = 21.54, SD = 2.12), 40 females and 32 males.
Twenty-four participants were excluded from the analyses due to the following reasons: they did not complete the DG (3), were not students at the National University of Córdoba (1), or failed to meet the criteria established in the Induction 2 or the SS manipulation check question1 (20). Hence, forty-eight students aged between 18 and 25 years (M = 21.38, SD = 2.15), 24 females and 24 males, were included in the following analyses.
Procedure
Phase 1.
The participants played the time estimation task (Boksem et al., 2012) during 30 trials (10 practice trials). This task consisted of the appearance of a blue circle that changed to green; participants had to press the space bar for 1 or 2 seconds after the green circle appeared. The response was correct if it occurred within a specified time interval. The duration of each interval depended on the performance of the participant and the experimental condition. Participants were informed that their SS depended on their performance compared to the performance of other participants. They were also told that they would obtain stars based on their performance. Three stars indicated a high SS, two stars a medium SS, and one star meant a low SS. At the end of this task, participants saw the number of correct responses, their SS (represented by stars) and a photograph of their face.
The SS was assigned by ability (Induction 1) or by a mix of chance and ability (Induction 2).
Induction 1 (based onBoksem et al., 2012).
Participants obtained a SS based on the experimental condition they were assigned to and received feedback after each response (a smiling face for correct responses and a sad face for incorrect responses). The time interval duration changed depending on the SS. In the high SS condition, for incorrect responses the interval increased by 30 ms, while for correct responses it decreased by 10 ms. In the medium SS condition, for correct and incorrect responses, the interval increased or decreased by 5 ms. In the low SS condition, the interval decreased or increased inversely to high SS (see Boksem et al., 2012).
Induction 2 (Mola et al., 2018).
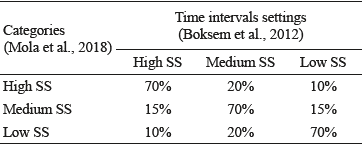
Initially, participants were assigned to a SS category. In each category, the adjustment of intervals for correct/ incorrect responses was implemented to a greater extent (70%) according to the corresponding category by Boksem et al. (2012), and to a lesser extent the adjustments of other categories (between 10% and 20%, see Table 2) were done. Thus, the last SS could be different from the originally assigned, as a product of ability. The last SS were defined by comparing the individual's performance with the performance of a group of similar characteristics obtained in a previous study (see instructions in Annex 1).
Phase 2.
Participants first played the UG and then the DG.
Ultimatum Game (UG).
Participants played a modified version of the UG (Hu et al., 2014) as respondents, during 310 trials (10 practice trials). They were informed that another person had made an offer on how to divide $10, and that they could accept or reject the offer. If they accepted the offer, everyone received the amount of money offered, while if they rejected the offer, no one would receive money. Also, they were told they would receive offers from different people, but they would not know who made these offers. As in Hu et al.'s study (2014), the offers were operationally defined as unfair (e.g., 1/9), intermediate (e.g., 3/7) and fair (e.g., 4.2/5.8); the number before the slash refers to the amount received by the respondent and the other number refers to the amount received by the proposer. The offers were predetermined and pseudorandomized with the restriction that the same type of offer could not be repeated in more than three consecutive trials.
Dictator Game (DG).
Participants played the dictator role during 105 trials (5 practice trials). They had to divide $10 between themselves and another person. Also, they were informed they could make offers to different people, but they would not know who would receive those offers.
At the end of the second phase, participants indicated on a 7-point Likert scale (1 = very low, 7 = very high) to what extent they felt inferior or superior to other people. They also responded to a questionnaire on socio-demographic data. Finally, participants were paid, debriefed and thanked for their participation. Participants took between 80 and 120 minutes to complete the experiment in one day. Each participant received AR$ 30 for their participation and an additional monetary reward based on their decisions in the games; on average, they earned AR$ 59.54 (SD = 8.62). The experiment was programmed using PsychoPy (Peirce, 2007).
Data analysis
In all the experiments, group comparison analyses were carried-out to evaluate the effect of SS on game decisions. Parametric tests (F, t) were conducted, but when the assumptions were not met by using Shapiro-Wilks and Levene Test, non-parametric tests (Kruskall-Wallis, Mann-Whitney's U, Friedman and Wilcoxon) were used. Analysis of the relationship (Pearson's r) between SVO, SSS and game decisions were performed when it was not possible to include them as covariates. For all analyses, a 5% significance level was used.
Results
Social status manipulation check
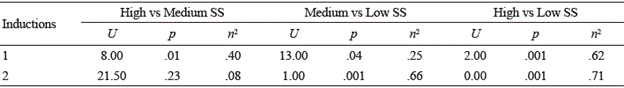
In order to corroborate the experimental manipulation, Kruskall-Wallis tests were performed first for each induction. The analyses indicated statistically significant differences between participants regarding to what extent they felt superior or inferior to the other people between conditions in Induction 1 [x2 (2) = 13.78; p = .001, n 2 = .56] and Induction 2 [x2 (2) = 16.27; p < .001, n 2 = .68]. Then, Mann-Whitney's U tests were performed to make pairwise comparisons. In Induction 1, pairwise comparisons were all significant (See Table 3). That is, participants with high SS perceived that they had higher SS (Mdn = 6, IQR = 2) than participants with medium (Mdn = 4, IQR = 2) and low SS (Mdn = 2.5, IQR = 2). In Induction 2, pairwise comparisons showed that there were no significant differences between high and medium SS (See Table 3). Participants with high SS perceived that they had higher social status (Mdn = 4.5, IQR = 3) than participants with medium SS (Mdn = 4, IQR = 1) and low SS (Mdn = 2, IQR = 2).
Decisions in the Ultimatum Game
To analyze the effect of the techniques on the decisions, an ANOVA of repeated measures was carried out with SS inductions as an inter-subject factor and the level of fairness of the offers as an intra-subject factor over the percentage of offer rejections. The results showed that the type of SS induction had no effect on the percentage of offer rejection [F (5,42) = 0.54, p = .74, n 2 p = .06], and there was no interaction between inductions and the level of offer fairness [F (8.21,69) = 0.87, p = .55, n 2 p = .09]. However, this analysis revealed a significant main effect of offer fairness, [F (1.64,69) = 110.38, p < .001, n 2 p = .72], with a higher rejection percentage towards unfair offers (M = 73.94, SE= 4.76, CI = [64.33, 83.55]) than towards intermediate (M= 29.52, SE = 4.14, CI = [21.16, 37.88]) and fair offers (M= 5.81, SE=2.40, CI = [.97, 10.66]). The differences between offer fairness were all significant (p < .001).
Decisions in the Dictator Game
Finally, a Kruskall-Wallis test was performed to analyze the effect of SS induction on the amounts offered in DG. This analysis revealed that there was no effect of the type of SS induction on DG decisions [x2 (5) = 2.27; p = .81, n 2 = .07].
Summary
In experiment 1, the SS experimental manipulation check was successful, that is, participants with high SS perceived that they had higher SS than participants with medium and low SS. However, contrary to what it had been hypothesized, no significant differences were found when comparing SS inductions (Boksem et al., 2012; Mola et al., 2018) in game decisions. In the UG it was observed that participants rejected more the unfair offers than the intermediate and fair ones.
Experiment 2
Taking into account previous results, in this experiment the induction of SS was modified using a more attractive task. The role of the SS in the same games including SVO and SSS as covariates was analyzed. The emotional valence and arousal generated by fair and unfair offers in the UG was assessed. It was expected that participants in the high SS condition would reject more the unfair offers (UG) and offer less money (DG) than in the medium and low SS conditions (Hu et al., 2016; Piff et al., 2010). Hypotheses for SVO and SSS were non-directional because previous research has not investigated the joint role of those variables in the UG and DG decisions. It was hypothesized that participants would evaluate unfair offers as more unpleasant and causing of emotional arousal than fair offers (Civai et al., 2010; Xiang et al., 2013).
Method
Design
A 3 (high, medium and low SS) x 2 (fair and unfair level of offer fairness) within-subject factorial design was employed. The dependent variables were the same as in Experiment 1. The experiment consisted of six blocks with each block including one trial of the Cube Task, 30 trials of UG and 20 trials of DG. The participant was assigned to each of the three critical levels of SS (high, medium and low) in two blocks. To reduce the fatigue effect, the sequence of SS used across participants was Latin Squares.
Participants
Participants were eighteen university students with ages between 18 and 25 years (M = 21.61, SD = 2.17), 10 females and 8 males.
Procedure
At the beginning of the experiment, participants indicated their SSS in Argentine society using the MacArthur Scale (Adler, Epel, Castellazzo, & Ickovics, 2000). Then, they completed the Cube Task (Wechsler, 2002) to create the SS. In this task, participants had 60 seconds to copy a figure using 4 or 9 cubes (see instructions in Annex 2). They were shown 7 different figures (one practice trial) and one for each block. As in the previous experiment, participants were informed that theirs SS depended on their performance. At the end of the test in each block, participants were shown a photograph of their face next to the stars.
As in Experiment 1, participants played the same version of the UG y DG, but the order of presentation was counterbalanced among the subjects. In UG, they played during 184 trials (4 practice trials) and not received intermediate fairness offers. In DG, they played during 124 trials (4 practice trials). The manipulation check questions were similar to the ones in Experiment 1.
Participants also reported their emotional valence and arousal (or emotional experience) for fair and unfair offers using the Self-Assessment Manikin (Bradley & Lang, 1994). Then they responded to a questionnaire on socio-demographic data, received payment, debriefing and were thanked for participating. Participants on average earned AR$ 61.11 (SD = 7.31). The experiment was implemented using PsychoPy, except for the Cube Task that was administered manually.
Days later (M = 2.29 days, SD = 2.55) participants completed an online version of the Social Values Orientation Scale Measure (SVO-SM; Murphy, Ackermann & Handgraaf, 2011; Reyna et al., 2018). They indicated the distributive option they preferred to share between them and another person. Decisions on this task were monetarily incentivized.
Results
Manipulation checks of social status
A repeated measures ANOVA test was performed to check the experimental manipulation. This analysis indicated statistically significant differences between conditions [F (1.44,24.43) = 14.19, p < .001, n 2 p = .46]. Participants perceived that they had higher social status in high2 (M = 4.75, SE = .28, CI = [4.17, 5.33]) than medium (M = 4.19, SE = .23, CI = [3.72, 4.67]) and low SS condition (M = 3.31, SE = .31, CI = [2.64, 3.97]). The differences between conditions were all significant (p < .05).
Decisions in the Ultimatum Game
Then, to analyze the effect of SS on the decisions, an ANOVA of repeated measures of 3 (SS conditions: high vs. medium vs. low) x 2 (level of fairness of the offers: unfair vs. fair) was carried out on the rejection of offers. No effect of SS on the rejection of offers [F (2,34) = 0.72, p = .49, n 2 p = .04] was found, and neither an interaction effect was observed between SS and the level of offer fairness [F (2,34) = 1.05, p = .36, n 2 p = .06]. The analysis indicated a significant main effect of offer fairness [F (1,17) = 31.50, p < .001, n 2 p = .65]; participants rejected more the unfair offers (M = 66.61, SE = 7.74, CI = [50.27, 82.94]) than the fair ones (M = 12.90, SE = 6.33, CI = [-0.44, 26.25]). Post hoc analysis showed that this difference was significant (p < .001).
With respect to SVO-SM of the total sample, fourteen participants responded to this scale. In general, participants were more pro-social (M = 29.69, SD = 16.20). Regarding the SSS, participants positioned themselves in the center of the scale (M = 5.17, SD = 1.20). In order to explore the role of SVO-SM and SSS, an ANOVA with fourteen participants including these as covariates was performed. In contrast to the previous analysis, the results showed that the main effect of the level of fairness of offer was no longer significant [F (1,11) = 0.05, p = .82, n 2 p = .005].
Decisions in the Dictator Game
In addition, a Friedman test to evaluate the effect of SS on the amount offered was carried out. No effect of SS on DG decisions [x2 (2) = 2.21; p = .33] was observed. As covariates cannot be included in a nonparametric analysis, SVO-SM and SSS with DG decisions by level of SS were correlated. These analyses revealed a positive and significant relationship between SVO and decisions in all conditions (high SS: r = .66, p = .01; medium SS: r = .66, p = .01 and low SS: r = .62, p = .02). In other words, prosocial participants offered more money in the three levels of SS. However, no relationship was found between SSS and decisions (high SS: r = .23, p = .36; medium SS: r = .14, p = .57 and low SS: r = .15, p = .56).
Emotional experience for UG offers
In order to evaluate the emotional valence and arousal generated by offers in the UG, paired sample t tests were performed. The analyses indicated statistically significant differences between fair and unfair offers for valence [t (17)=5.93, p < .001] but not for arousal [t (17) = 0.68, p = .51]. The participants felt unfair offers were more unpleasant (M = 3.10, SD = 1.56) than fair ones (M = 6.11, SD = 2.00).
Summary
In Experiment 2, no effect of the SS in game decisions was observed. However, in the UG, it was noted that the participants rejected more the unfair offers than the fair ones, and that by including SVO-SM and SSS as covariates, the effect of offer fairness was not significant. In the DG, it was observed that the more pro-social participants offered more money. There was also evidence that participants felt unfair offers were more unpleasant than fair ones but there was no difference in terms of emotional arousal.
Experiment 3
In Experiment 3, a new game was included. The role of SS in DGT and DG, including SVO and SSS as covariates, was analyzed. It was hypothesized that participants in the high SS condition would give (DG) and leave (DGT) less money than participants in medium and low SS conditions. It was also expected that there would be differences in the amounts offered or left to the recipient. Hypotheses for SVO and SSS were non-directional as in the previous experiment.
Method
Design
A within-subject design was used, with a three levels (SS) independent variable assigned according to a Latin square order. The dependent variables were the amount offered (DG) or left (DGT) to the recipient. The experiment consisted of 3 blocks (1 block for each level of SS) where each block included one trial Cube Task, 15 trials of DG and 15 trials of DGT (games presented in counterbalanced order).
Participants
Eighteen university students with ages between 19 and 24 years (M = 21.44, SD = 1.79), 9 females and 9 males, participated in the experiment.
Procedure
Participants responded SVO-SM a few days before attending the experimental session (M = 3.56, SD = 2.04) in order to avoid the effect of the games on SVO-SM decisions.
At the beginning of each block, participants completed the Cube Task to obtain their SS. Then, they played DG and DGT. Participants played the DG during 49 trials (4 were practice trials). They played a modified version of the DGT (List, 2007) in the dictator role during 49 trials (4 were practice trials). They were informed that another person had $10 and that they had to decide how much of that sum they would take for themselves and how much they would leave for the other person.
The manipulation check questions were similar to the ones in Experiment 2. Finally, participants reported their SSS, responded to a questionnaire on socio-demographic data and received their payment. On average, participants earned AR$ 62.94 (SD = 11.18). The experiment was also implemented using PsychoPy, except for the Cube Task that was administered manually.
Results
Manipulation checks of social status
A Friedman test to corroborate the experimental manipulation was performed. The analysis indicated statistically significant differences between conditions [x2 (2) = 18.90; p < .001]. Wilcoxon tests to pairwise comparisons were then conducted. Results evidenced that pairwise comparisons were all significant (See Table 4). In other words, participants perceived that they had higher social status in the high (Mdn = 5, IQR = 2) than in the medium (Mdn = 4, IQR = 0) and low SS condition (Mdn = 3, IQR = 2).
Decisions in the Dictator Game Giving and Taking
Firstly, Friedman tests were carried out to analyze the role of SS in DG and DGT. These analyses revealed that there was no effect of SS on game decisions (DG: x2 (2) = 4.32; p = .12; DGT: x2 (2) = 0.64; p = .73). Secondly, a Friedman test was conducted to compare game decisions in the DG and DGT. This analysis indicated statistically significant differences between the games [x2 (5) = 15.10; p = .01]. Thirdly, Wilcoxon tests were performed to pairwise comparisons, whose results showed differences only in the medium SS condition (See Table 5); participants offered more money to the recipient in the DGT (Mdn = 4.95, IQR = 2.58) than in the DG (Mdn = 4.41, IQR = 1.90).
Table 5 Values of pairwise comparisons between games by SS conditions.
| SS condictions | Games | Z | p | n2 |
| High | DG vs DGT | -1.78 | .07 | 0.18 |
| Medium | DG vs DGT | -2.61 | .009 | 0.38 |
| Low | DG vs DGT | -1.48 | .14 | 0.12 |
Note. SS: social status.
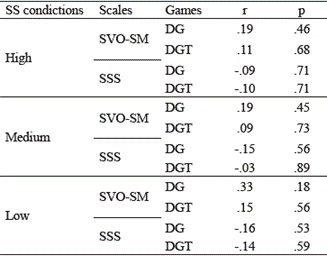
With respect to SVO-SM, participants showed a greater tendency toward pro-sociability (M = 26.45 SD = 13.52). For SSS, on average, participants positioned themselves in the center of the scale (M = 5.67, SD = 1.09). Correlations between SVO-SM and SSS with DG and DGT decisions by level of SS were conducted. No significant relationships were observed between SVO-SM, SSS and game decisions (See Table 6).
Summary
In Experiment 3, no effect of SS on game decisions was found. As it was expected, when comparing the amounts offered to the recipient in both games (DG and DGT) the results showed significant differences; participants offered more money in the DGT than in the DG. However, pairwise comparisons evidenced differences only in the medium SS condition. Finally, no significant relationship was observed between SSS, SVO and game decisions.
General Discussion
In this study, the role of Social Status (SS) in the distribution of monetary resources in students from Córdoba (Argentina) was examined. In Experiment 1, the effect of two SS inductions on the decisions of the Ultimatum Game (UG) and the Dictator Game (DG) were compared. In Experiment 2, the role of SS in the same games, including Social Value Orientation (SVO) and Subjective Social Status (SSS) as covariates was analyzed. Finally, in Experiment 3, the role of SS, SVO and SSS during DG and Dictator Game Taking (DGT) was assessed. This section discusses the results obtained, points out the limitations of this research and proposes future lines of study.
In Experiment 1, it was proven that participants rejected more the unfair than the intermediate and fair offers during the UG, as previously demonstrated (Polezzi et al., 2008). However, no differences were observed when SS was generated by ability (Induction 1) or by a mixture of chance and ability (Induction 2). It is important to mention some differences between the original studies and this study. In the induction by Boksem et al. (2012), participants obtained their SS after playing 320 trials of the time estimation task, while in the present experiment participants obtained their SS after 20 trials. In addition, Albrecht et al. (2013) used a different task (trivia quiz) to generate SS. As indicated by Mola et al. (2018), these procedural differences in the generation of SS may have affected the results observed. In addition, Boksem et al. and Albrecht et al. did not analyze the effect of SS on behavioral responses, making it difficult to compare results.
The SS inductions used in this study involved ability and a mixture of chance and ability, but probably participants did not perceive this. Just as in previous studies that used a combination of chance and ability to create SS (e.g., Albrecht et al., 2013), in the present experiment participants were informed that their SS depended on their performance. In other words, in both inductions, the dimension of ability was mentioned, an aspect that could affect the perception of SS acquisition and game decisions. Future studies should compare both SS inductions emphasizing both dimensions (chance and ability) in task instructions.
In Experiment 2, it was found that participants rejected more the unfair offers than the fair ones in the UG, replicating the results of Experiment 1. Several authors reported that the rejection of unfair offers is related to emotional experience (Civai et al, 2010; Xiang et al, 2013). In line with them, it was found that participants felt the unfair offers were more unpleasant than the fair ones. However, no significant differences were observed in emotional arousal. Probably, the use of a self-reporting measure to assess arousal prevented to observe changes because that kind of measures provide only conscious information (Grygolec, Coricelli, & Rustichini, 2009). It is suggested for future research to measure emotional reaction during game decisions (Xiang et al., 2013) and use other ways of measuring emotional responses, such as electrodermal activity.
In this experiment, the SS generation procedure was modified. However, unlike previous studies, no significant effects on game decisions (e.g., Blue et al., 2016) were found. It is important to note that the effects of SS on behavioral responses during the UG are not robust. Hu et al. (2016) observed a marginally significant interaction effect (p = .07) between SS and offer fairness, while Hu et al. (2014) did not observe significant effects. In addition, it would be important to know whether the amount of trials used in UG could affect the relationship between SS and the game decisions. Is it the same to decide 90 or 100 times in the UG? Camerer (2003) pointed out that UG results are highly robust to a variety of experimental designs (e.g., repetition and offer size), but is the same for the effect of SS? In neuro-imaging studies, such as the ones by Hu et al. (2014; 2016), it is necessary (for technical reasons) to use repeated- rounds games. However, there is no evidence of how many trials are needed to obtain a more reliable picture about the effect of social status on neuronal responses. In the local context, there are no studies that analyze such effect. Thus, future studies could evaluate SS neurophysiological responses (through EEG).
With respect to SVO and SSS, it was found that they do not contribute to explaining the decisions in the UG; but the effect of offer fairness was not significant when including them as covariates. It is hypothesized that these results may be related to sample size (N = 14). In other words, including these covariates in an estimated model with a small sample, significant variables lose explanatory capacity. In the DG, the results indicated that the more pro-social participants offered more money, as was observed in other studies (e.g., Reyna et al, 2018). The present research did not observe a relationship between SSS and decisions in the DG, such as reported by Hu et al. (2016). Those authors used the same scale as this study did to measure SSS. However, it is important to note that they implemented UG instead of DG, hence these findings are not comparable.
In Experiment 3, a new dependent variable (DGT) to explore the role of SS in resource distribution was included. However, as in Experiment 1 and 2, no SS effects on decisions were found. Regarding the framing effect, significant differences were observed in altruistic decisions in line with previous studies (e.g., List, 2007). That is, participants offered more money in the DGT than in the DG. However, pairwise comparisons indicated differences only in the medium SS condition. Previous studies did not compare SS in DG and DGT decisions. Other authors who researched the effect of social hierarchy on altruistic decisions used DG and other indicators of hierarchy, such as social class (Piff et al., 2010). Hence, replicating this experiment in a different social context would allow to examine if differences between decisions are evident in all status or only in the medium SS. In the local context, the position in a hierarchy could be investigated using other indicators (e.g., social class) to provide new evidence of their effect on altruistic decisions.
A relationship between SVO, SSS and decisions in the DG and DGT was not observed. With respect to SVO, these results are different from Experiment 2. Probably, these differences are due to distinct forms of administration of the scale. In Experiment 2 the scale was administered after games, while in Experiment 3 it was administered before. With regard to SSS, results observed in Experiment 2 were replicated in this experiment.
This study is one of the first works that generates new empirical evidence on social status and distribution of monetary resources in Argentina. It is important to note that Argentina and all of the Latin American countries are deeply affected by inequality and poverty (De la Torre et al., 2017). This study expects to highlight the role of social status as one of many factors that affect altruistic decisions and fair distributions in the Latin American region, as well as to promote more experimental approaches to examine this relationship.


