


 English (pdf)
 Article in xml format
 Article references
 Send this article by e-mail
 Cited by SciELO
  Cited by Google
  Similars in
SciELO
Similars in
SciELO  Similars in Google
 Permalink
INTRODUCTION
Styrene (C6H5CH=CH2; phenyl ethylene, vinyl benzene) is the common name given to the simplest and most important member of the unsaturated aromatic monomers family. It is a very important chemical and is mostly used to obtain daily-use plastic materials and items such as toys, jars, bottles, serving dishes, cups, corks, etc., as well as a foam precursor for insulation and cushioning operations.
Styrene is obtained at commercial scale through several production processes, and the most important are the following (Speight, 2002):
Catalytic dehydrogenation of ethyl-benzene at high temperature (630 °C) using various metal oxides as catalysts, such as zinc, chromium or magnesium oxides coated on activated carbon, alumina or bauxite.
Ethyl-benzene oxidation to obtain the hydro-peroxide, which then reacts with propylene to give phenyl-methyl-carbinol (or methyl benzyl alcohol) and propylene oxide. The alcohol obtained is then dehydrated to styrene at relatively low temperatures (180 to 400 °C) by using an acidic silica gel (SiO2) or titanium dioxide (TiO2) catalyst.
Furthermore, simulation is becoming a requirement for all major process designs. By means of simulation, process engineers can identify potential problems ahead of time and take corrective actions (Towler & Sinnott, 2008). Common uses for process simulation are process mapping, design, and assessment, as well as cost analysis (Dimian & Bildea, 2008).
Process simulation and modeling is the application of a range of software tools to analyze individual unit operations (or process stages) and their relationships within the overall process (Boyadjiev, 2010). Process simulation is defined as the utilization of computer software resources to develop mathematical models for the construction of an accurate, representative model of a process (a chemical process, in this case), in order to understand its actual behavior during regular plant operations (Diwekar, 2005). These tools can be used at all stages of process development, from conceptual design, through process operation and further optimization. A particular example of the aforementioned constitutes the multi-physics modeling and computational simulation of mass and momentum transfer phenomena in a process of osmotic evaporation by applying Comsol® and Matlab® software (Forero, Pulido & Cabrera, 2016).
Among the most important process simulators used today in chemical process industries can be mentioned Aspen HYSYS®, SuperPro Designer®, CADSIM Plus®, Gensim®, and CHEMCAD®.
CHEMCAD® simulator is primarily designed for the simulation of hydrocarbon treatment and polymer synthesis processes (CHEMSTATIONS, 2002). In that case, refining and chemical processing operations are broadly covered by the unit operations contained in the general program, which also involves using several useful tools such as process sensitivity analysis, equipment design and optimization procedures, project costing, and others (Auli, Sakinah, Bakri, Kamarudin, & Norazian, 2013).
CHEMCAD® simulator has been used in recent years to model and simulate a wide range of processes, such as: the simulation of an olive pits fed rotary kiln pyrolysis plant installed in Southern Italy (Benanti, Freda, Lorefice, Braccio, & Sharma, 2011); the conceptual design of an acetaldehyde manufacturing plant (Eliasson, 2010); the simulation of the biodiesel production process by transesterification of vegetable oils (Chilev & Simeonov, 2014), the simulation of a gasification plant equipped with a fluidized bed gasifier (Moneti, Delfanti, Marucci, & Bedini, 2015); the use of stochastic optimization algorithms for the systematic process retrofit of complex chemical processes (Otte, Lorenz, & Repke, 2016); the simulation of the formaldehyde production process via Formox technology, and comparison between the obtained and the acquired results using SuperPro Designer process simulator (Johansen, Johnsen, & Christiansen, 2013); and the conceptual design of a small-scale plant to obtain several components from turpentine oil (Sarwar, 2012).
In this study, the conceptual design and simulation of the styrene production process via catalytic dehydrogenation of ethyl-benzene is carried out using process simulator CHEMCAD® version 5.2.0 (CHEMSTATIONS, 2002). This research intends to know the mass composition of the different streams involved in the production process, so it is possible to determine the main design parameters of process equipment; to calculate the flow rate of the different auxiliary consumed services (steam, cooling water, etc.); and to graphically evaluate the heat transfer processes carried out at the heat exchangers. To develop this research, there were two sensitivity studies accomplished in order to know which values must be applied to the key operating variables of two processes equipment (LLV Separator and Distillation Column No. 1). This evaluation of variables had as objective to maximize the amount of final product (styrene). The results obtained in this simulation study will help to characterize the production process from the technical point of view; and can be used to take the necessary measures to increase process profitability, yield and productivity; as well as to establish the required fundamentals for future optimization studies.
METHODOLOGY
Production process description
The styrene production process using catalytic dehydrogenation of ethyl-benzene was selected for simulation since it constitutes the most employed production process applied at commercial scale to obtain styrene (Speight, 2002). It is composed by four stages:
Ethyl-benzene pre-heating, mixing and vaporization,
Dehydrogenation,
Cooling, and
Separation/Purification.
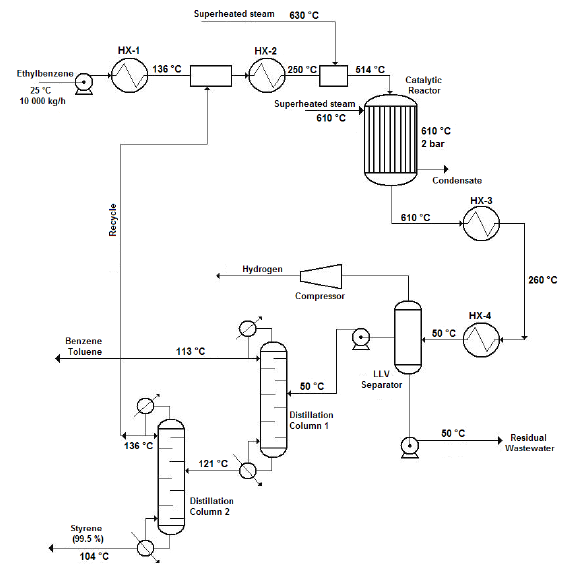
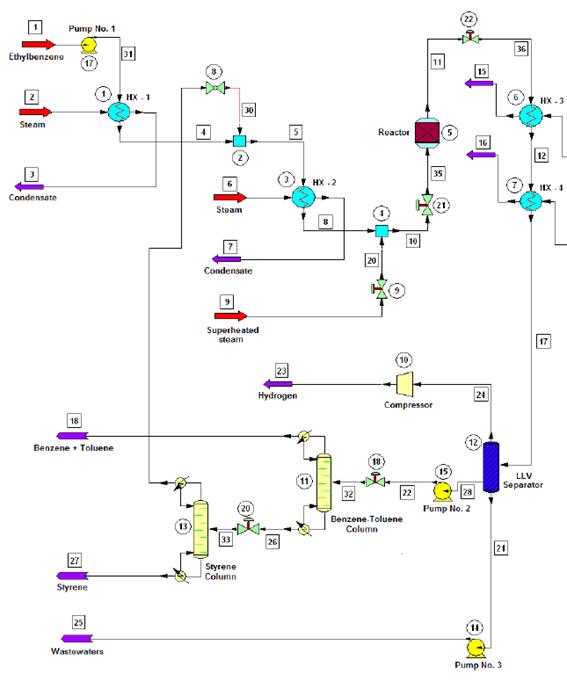
Figure 1 shows the flow diagram of the production process.
Source: own work
Figure 1 Flow diagram of the styrene production process via catalytic dehydrogenation of ethyl-benzene
Ethyl-benzene pre-heating, mixing and vaporization
The production process starts when 10 000 kg/h of liquid ethyl-benzene stream is pre-heated from ambient temperature (25 °C) to a temperature of about 136 °C using a shell and tube heat exchanger. The pre-heated stream obtained is then mixed with a recycle stream containing mostly ethyl-benzene and water, and some traces of styrene and toluene, coming from the top of the Distillation Column No. 2 (Styrene Column) in a cylindrical, pressurized vessel (Streams Mixer), operating under isobaric conditions. The exit stream leaving the Stream Mixer is completely vaporized in another shell and tube heat exchanger, until it reaches a temperature of about 250 °C. The vapors obtained are then sent to another pressurized vessel operating also under isobaric conditions (Steam Mixer), at which superheated steam is injected in order to increase the temperature of the vapor mixture to that of the reaction condition (600 °C). The amount of superheated steam to consume in the Steam Mixer should be enough to obtain a gaseous stream with a final water/ethyl-benzene molar ratio of approximately 14:1, prior to being fed to the Conversion Reactor (WVU, 2010).
Catalytic dehydrogenation reaction
The ethyl-benzene catalytic dehydrogenation takes place in a vertical cylindrical shell and tube reactor (Catalytic Reactor), which operates isothermally. The reacting gaseous mixture flows inside the tubes over the catalyst bed, while superheated steam is injected in the reactor’s shell to maintain the reaction temperature in the requested range (580 - 610 °C). The reaction temperature must not be increased to a value higher than 610 °C since thermal decomposition of both ethyl-benzene and styrene would occur. At the reactor’s exit a hot gaseous mixture is obtained, which has a styrene mass composition of about 93 % (on dry basis).
Cooling
The hot gaseous mixture coming from the Catalytic Reactor, which presents a temperature near 600 °C and a pressure of 3.5 bar, is pressurized to 6.0 bar using pressure regulating valves. Then, the mixture is cooled to 50 °C via two shell and tube heat exchangers (Coolers), which use cooling water as the heat exchanging agent. A two-phase (vapor-liquid) stream with approximately 50ºC temperature is obtained at the exit of the second cooler, which is then sent to the Separation/Purification area.
Separation/Purification
The styrene present at the exit stream of the Conversion Reactor must be separated and purified from the rest of the other chemicals contained on it (water, toluene, etc.). To accomplish this, the two-phase stream obtained at the exit of the coolers is sent to a three-phase separator (Liquid-Liquid-Vapor Separator or LLV Separator), which operates at 5 bar and 50 °C. A gaseous mixture primarily composed by hydrogen, methane and ethylene (as well as minor amounts of water and styrene) is obtained at the top of the LLV Separator (light gaseous stream), while a liquid stream containing water and certain traces of styrene, benzene and ethylene is obtained at the bottom of this equipment (wastewater stream). The middle stream (useful stream) contains mainly styrene, as well as minor amounts of the other chemicals, and is sent to the Distillation Column No. 1 (Benzene-Toluene Column), in order to recover both the benzene and toluene contained on it, and also for styrene concentration.
Both the benzene and toluene are obtained at the top of the Distillation Column No. 1 while a styrene-rich stream is obtained at the column’s bottom, which is sent to the Distillation Column No. 2 (Styrene Column) to carry out the final purification step. At the Styrene Column, the styrene is obtained at the bottom stream with a purity of about 99.5 % while the stream obtained at the top of this column (composed mostly by ethylbenzene, benzene and toluene) is recycled back to the process (Recycle Stream) and mixed with the pure ethyl-benzene stream which had previously been pre-heated at the first shell and tube heat exchanger.
Since pure styrene could polymerize spontaneously in presence of high temperature and high pressure (typically over 6 bar and 125 °C), it is necessary to carry out the distillation process at the lowest possible pressure. This should also be done to avoid the polymerization of the vinyl aromatic chemicals created during the reaction step, considering that the Benzene-Toluene Column operates at a pressure of 1.5 bars while the secondary distillation operation accomplished at the Styrene Column is carried out at 1.0 bar (atmospheric distillation).
Catalyst
Currently, several metallic oxides are used as catalysts to obtain styrene from ethyl-benzene. In this process, iron oxide (III) supported on alumina would be used as the main catalyst (Snyder & Subramaniam, 1994); it presents a density of 1 282 kg/m3 and a void fraction of 0.4.
Thermodynamic model selection
PSRK (Peng-Soave-Redlich-Kwong) vapor-phase associated thermodynamic model was selected to carry out simulation calculations in CHEMCAD® simulator (CHEMSTATIONS, 2002). This model fits better the temperature and pressure ranges handled throughout the production process, and it’s also capable of predicting satisfactorily the most important thermodynamic variables of all the chemicals used according to the different existing phases. Using this model and the SRK model (Soave-Redlich-Kwong) allows determining the values of the equilibrium constant K and other important thermodynamic parameters. Additionally, it is taken into account some useful recommendations provided by the simulator itself (CHEMSTATIONS, 2002).
Sensitivity studies
Once the simulation approach was accomplished, two sensitivity studies were carried out using the tool “Sensitivity Study” contained within the process simulator. The first consists of evaluating how both the operating temperature and pressure applied to the LLV Separator affect the amount of styrene and ethyl-benzene obtained at the middle stream. The temperature varied from 30 to 80 °C, while the pressure was modified from 5 to 10 bar.
The second sensitivity study determines if the operating pressure applied at the Benzene-Toluene Column influences the amount of styrene and ethyl-benzene obtained in the column’s bottom stream. In addition, the study establishes if the operating pressure also affects the number of stages (plates) required to accomplish the expected separation. In this case, the operating pressure varied from 1 to 6 bars.
Description of the chemical reactions involved
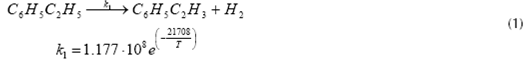
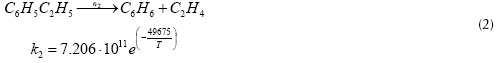
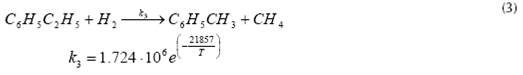
Equations (1) (2) and (3) represent the main reactions that take place inside the Catalytic Reactor, which are the catalytic dehydrogenation of ethyl-benzene to obtain styrene and hydrogen (equation 1); benzene and toluene formation from ethyl-benzene (equation 2); and the reaction of ethyl-benzene with hydrogen to obtain toluene and methane (equation 3). The application of high temperatures during reaction step permits the catalytic dehydrogenation of ethyl-benzene to be the predominant reaction, with a selectivity of about 95% (Snyder & Subramaniam, 1994) while the rest of the reactions involved totalize about 4%. The most important reactions occurring inside the reactor, as well as its reaction kinetics, are shown below (Snyder & Subramaniam, 1994) (WVU, 2010).
Styrene formation
Benzene and toluene formation
Toluene and methane formation
Where T is in K
Process simulation
Figure 2 shows the flow diagram obtained during process simulation in CHEMCAD® simulator.
RESULTS
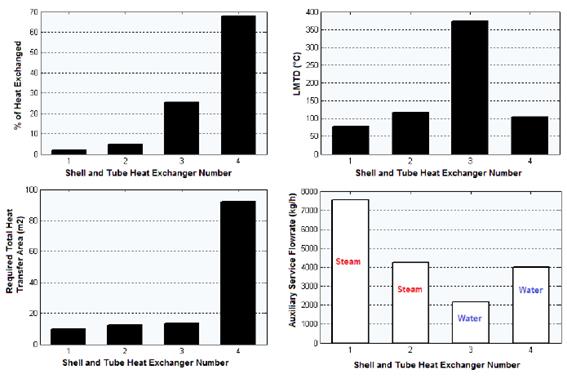
The results obtained regarding composition of the intermediate and exit streams, equipment design variables, heat curves, and the two sensitivity studies carried out, are shown in the following sections. Figure 3 presents the results obtained for the shell and tube heat exchangers regarding % of heat exchanged, LMDT, heat transfer area and auxiliary service flow-rate.
Equipment
Shell and tube heat exchangers
According to the results shown in figure 3, the heat exchanger number 4 was the one that transferred the highest amount of heat (68.34% of the total). This is because this equipment presents the condensation of the components in the reacting gaseous mixture from 260 °C to approximately 50 °C. The heat exchanger number 3 had the highest value of the Logarithmic Mean Temperature Difference (LMTD), with 372.841 °C, since this heat exchanger presents the highest temperature difference between the hot fluid inlet temperature (T1 = 611.2 ºC) and the cold fluid exit temperature (t2 = 45 ºC), which is 566.2 ºC (Cao, 2010).
On the other hand, the heat exchanger number 4 had the highest value of calculated heat transfer area (92.23 m2). This is because this heat exchanger presents the highest heat transfer duty combined with a low value of the LMTD parameter (Cao, 2010). The CHEMCAD® simulator determines this parameter according to equation (4).
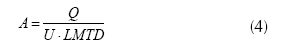
Where Q is the exchanged heat [kcal/h] and U is the overall heat transfer coefficient [kcal/h.m2.ºC]. According to this expression, the greater the value of the numerator (Q), the greater the result of the heat transfer area (A) (Cao, 2010).
The heat exchanger number 1 requested the highest amount of steam (7 559.9 kg/h). This is because this equipment accomplishes the pre-heating process of the liquid ethyl-benzene stream (10 000 kg/h) from ambient temperature (25 ºC) to a temperature near the evaporation point (136 ºC), which involves the demand of great amounts of this auxiliary service to meet this significant temperature increment (111 ºC).
Finally, the heat exchanger number 4 needed the highest flow of cooling water (4 008.8 kg/h) because that is the place where phase change (condensation) of the hot reacting mixture occurs from a temperature of 260 ºC to approximately 50 ºC (temperature difference of 210 ºC); this process releases great amounts of heat that must be compensated with an elevated flow of the cooling agent.
Table 1 displays the total heat values of the reaction determined by the CHEMCAD® simulator for the conversion reactor, while tables 2, 3 and 4 show the results obtained for the two distillation columns, the centrifugal pumps and the adiabatic compressor, respectively.
Table 1 Total reaction heat for the catalytic reactor determined by CHEMCAD® simulator

Source: own work
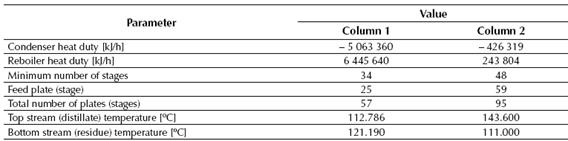
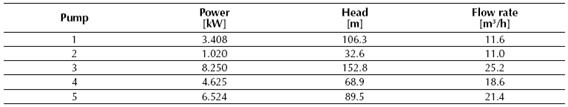
Table 4 Results obtained for the adiabatic reciprocating compressor by CHEMCAD® simulator
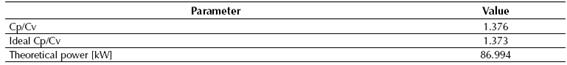
Source: own work
The second distillation column needs the highest number of stages since it is the place where occurs the final separation of the styrene from the rest of the chemical components contained in the feed stream (including the ethyl-benzene, which presents a boiling point value near to the styrene’s). This final separation allows obtaining styrene with a final purity of about 99.5%, which is the purity requested for the styrene, and the similarity of the styrene’s boiling point to the ethyl-benzene implicates that a high number of stages will be needed at this column to obtain this separation request.
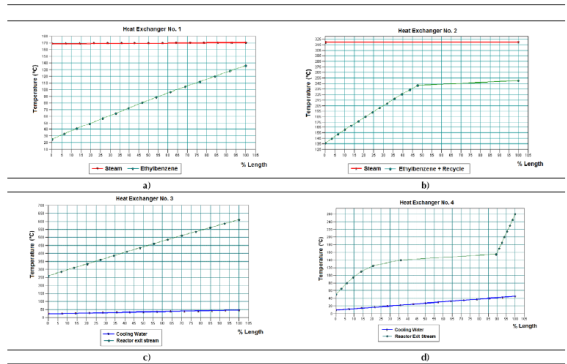
Heat curves
Several heat curves were obtained for each shell and tube heat exchanger used in the process employing the tool “Plot Heat Curve” contained within the CHEMCAD® simulator. These curves show the existing relationship between temperatures of both fluids versus heat exchanger length (%), thus obtaining a spatial temperature profile describing the thermal behavior of the heat exchange process with regards to the equipment length. In this case, since every heat exchanger works at true countercurrent flow, in each one of these graphs the inlet point of one fluid will be the exit point of the other fluid.
Figures 4a to 4d display the heat curves obtained for each heat exchanger. It can be observed that the heat curve obtained for the ethyl-benzene stream at the heat exchanger No. 1 presents an ascending lineal behavior without deviation points while the cooling curve obtained for the gaseous stream in the heat exchanger No. 3 (Figure 4c) presents this constant lineal pattern, but in descending mode. This means that none of these cases present a phase change for the process stream handled in the heat exchanger, which is correct since at the heat exchanger No. 1 the ethyl-benzene stream is pre-heated without undergoing evaporation, and the gaseous stream obtained at the reactor’s exit is cooled in the heat exchanger No. 3 without condensation.
Both heat curves obtained for the heat exchangers number 2 (Figure 4b) and 4 (Figure 4d) present nonlinear thermal patterns with turning points, which indicate that there are phase change processes occurring on them (i.e. vaporization in the heat exchanger number 2 and condensation in the number 4). This can be confirmed by assessing the thermal behavior of each process stream on the heat curves obtained. According to the heat curve obtained for the heat exchanger number 2 (Figure 4b), the process stream follows a lineal heating pattern (sensible heat) until reaching a point near 50% of the heat exchanger length, at which phase change occurs (vaporization). Once vaporized, the gaseous mixture will follow the same lineal heating pattern, but with reduced temperature increments, until achieving the desired final temperature (250 ºC).
Finally, considering the heat curve obtained for the heat exchanger No. 4 (Figure 4d), the previously cooled gaseous mixture follows a lineal cooling pattern until reaching 90% of the heat exchanger length; this is the moment when phase change (condensation) occurs. From this point the liquid mixture is cooled, showing a nonlinear behavior in a form of a decreasing curve, until it reaches the desired temperature (50 ºC).
Inlet and outlet streams
Tables 5, 6 and 7 show the mass flow rate values of both inlet and outlet streams for each process equipment, obtained with CHEMCAD® simulator.
Table 5 Calculated mass flow rates of both inlet and outlet streams for the conversion reactor
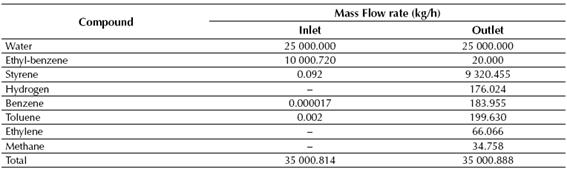
Source: own work
Table 6 Calculated mass flow rates of both inlet and outlet streams for the LLV Separator
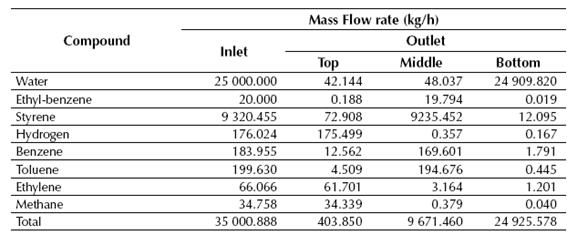
Source: own work
Table 7 Calculated mass flow rates of the inlet and outlet (top and bottom) streams for the distillation columns
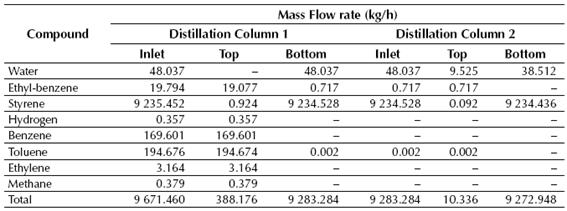
Source: own work
According to the results showed in Tables 7 and 8, near 99% of the styrene fed to the LLV Separator is recovered on its middle stream, while about 100% of the benzene and toluene fed to the Distillation Column No. 1 is recovered in the top stream of this column. Finally, styrene is obtained at the Distillation Column No. 2 with a purity of about 99.6%, while near 0.72 kg/h of ethyl-benzene are recycled back to the production process.
Results of the sensitivity studies
Sensitivity study No. 1
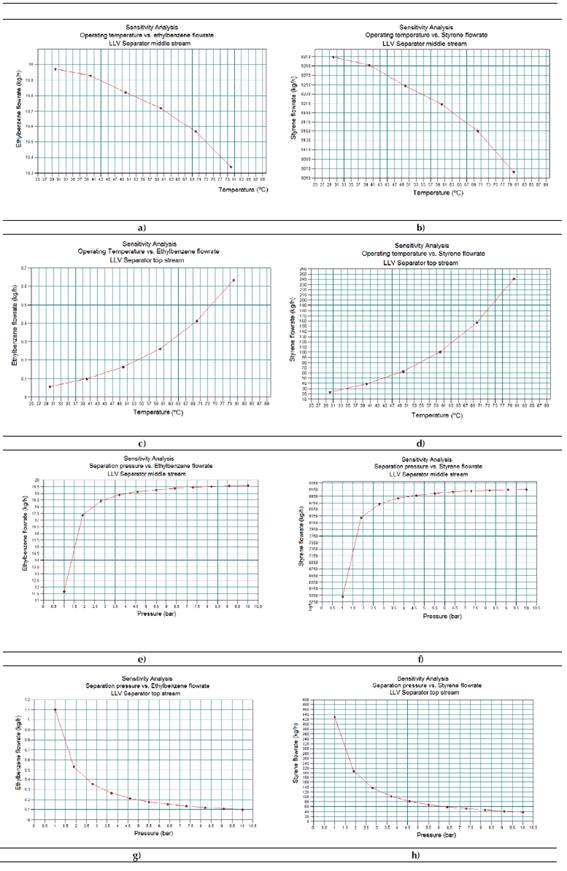
Figure 5 shows the results obtained for sensitivity study No. 1. In this case, the Figure 5a represents the existing relationship between the ethyl-benzene flow rates at the middle stream of the LLV separator versus the operating temperature. Figure 5b indicates the existing relationship between the styrene flow rates at the middle stream of the LLV separator versus the operating temperature. Figure 5c shows the existing relationship between the ethyl-benzene flow rates at the top stream of the LLV separator versus the operating temperature. Figure 5d presents the existing relationship between the styrene flow rates at the top stream of the LLV separator versus the operating temperature. Figure 5e presents the existing relationship between the ethyl-benzene flow rates at the middle stream of the LLV separator versus the operating pressure. Figure 5f displays the existing relationship between the styrene flow rates at the middle stream of the LLV separator versus the operating pressure. Figure 5g shows the existing relationship between the ethyl-benzene flow rates at the top stream of the LLV separator versus the operating pressure. Finally, Figure 5h displays the existing relationship between the styrene flow rates at the top stream of the LLV separator versus the operating pressure.
From the results, it can be concluded that both an increment of the working temperature and a reduction of the internal pressure in the LLV Separator will lead to an increment of the obtained amounts of ethyl-benzene and styrene at the top stream of this equipment. That means an evaporation increment of both components, which is undesirable and could be considered as loss.
Therefore, a temperature increment of 20 °C will lead to approximately 15kg/h of styrene losses, while nearly 0.041 kg/h of ethyl-benzene will not be recycled back to the process. With the objective of increasing the amount of obtained chemicals (ethyl-benzene and styrene) in the middle stream of the LLV Separator, this equipment must be operated at 5 ºC, and a pressure near 10 bar, that is, under cooling and pressurized conditions.
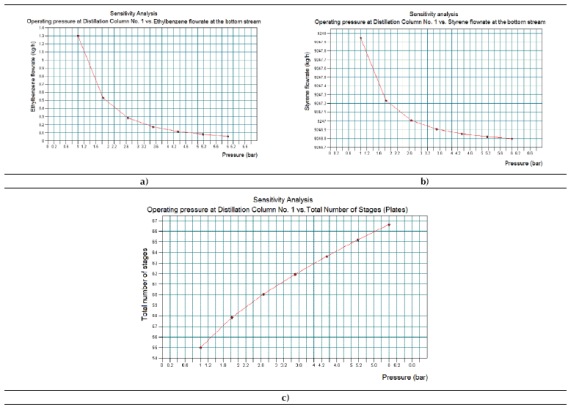
Sensitivity study No. 2
The results obtained for the Sensitivity study No. 2 can be observed in Figure 6. Figure 6a represents the existing relationship between the ethyl-benzene flow rates the bottom stream of Distillation Column No. 1 versus the operating pressure. Figure 6b shows the existing relationship between the styrene flow rates the bottom stream of Distillation Column No. 1 versus the operating pressure. Figure 5c presents the existing relationship between the stages of the Distillation Column No. 1 versus the operating pressure.
Taking into account the results showed in Figures 6a - 6c, it can be concluded that an increment of the working pressure at the Distillation Column No. 2 would reduce the amounts of both styrene and ethyl-benzene at the bottom stream of this equipment, while the total number of plates (separation stages) would increase in order to achieve the desired separation request. Both results are not acceptable from styrene yield and equipment cost points of view, since it will generate undesirable losses of the main product and increase also the geometrical dimensions (size) of the column, thus increasing its purchasing cost.
In this case, an increment of the column’s operating pressure will also increase the internal operating temperature of the column and the number of plates (stages) required to carry out the desired separation duty. The amounts for both styrene and ethyl-benzene to obtain at the top stream of the column will increase as well, due to an increment of the evaporation of both components. Considering the aforementioned, the distillation column must operate at the minimum required operating pressure in order to obtain an economical column in terms of required separation stages, from which the highest amounts of both styrene and ethyl-benzene could be obtained at the bottom stream.
Source: CHEMCAD®
Figure 5 Results obtained in the Sensitivity Study No. 1 by means of CHEMCAD® simulator
CONCLUSIONS
The use of CHEMCAD® simulator allowed simulating successfully the production process of styrene via catalytic dehydrogenation of ethyl-benzene.
Styrene is obtained at the bottom stream of the Distillation Column No. 2 with a purity of about 99.6%, and the water is the main impurity on it (~ 0.35 %).
The heat exchanger that requires the highest amount of steam is the No. 1, with 7559.9 kg/h.
The heat exchanger that requests the highest amount of cooling water is the No. 4, with 4008.8 kg/h.
The heat curves obtained for all the heat exchangers permit to analyze and evaluate the temperature profiles followed by each stream related to the equipment length.
Distillation Column No. 1 requires 57 stages (plates) to carry out the desired separation duty, while the Distillation Column No. 2 will need about 97 stages.
The LLV Separator must operate at 5 °C of temperature, and at a pressure of 10 bar, in order to reduce losses of styrene and ethyl-benzene at the top stream of this equipment.
The Distillation Column No. 1 must operate at atmospheric temperature or under vacuum conditions in order to obtain greater amounts of styrene and ethyl-benzene at the top stream of this equipment, and also to reduce column geometry and, thus costs.

