


 Inglês (pdf)
 Artigo em XML
 Referências do artigo
 Enviar este artigo por email
 Citado por SciELO
  Citado por Google
  Similares em
SciELO
Similares em
SciELO  Similares em Google
 Permalink
INTRODUCTION
Solar radiation data have become important due to the increase in the use of solar energy. In general, solar radiation data are obtained from long-term monitoring stations, and they are used for photovoltaic applications or thermal heating, cooling, or drying systems.
To design an accurate photovoltaic system according to a specific zone, it is necessary to perform an irradiance study using radiation sensors such as pyranometers, pyrheliometers, or sunphotometers. However, this kind of sensors are usually expensive, especially in cases where a large number of them is necessary.
The literature has several models and studies used to detect radiation at lower costs (Cruz-Colón et al., 2012). Chacón et al. (2008) and Ortiz et al. (2005) developed a low cost irradiance sensor that describes the electric behavior of a photovoltaic module using an exponential model applied to a solar cell. The maximum error between the estimated and measured irradiance was 1,11%. Abe et al. (2020) proposed a sensor based on a phototransistor. They used the arithmetic mean for the ungrouping data method (Viljoen & Merwe, 2000). The results of the simulation showed a determination coefficient (R2) of 0,99099 with respect to the pyranometer. Mancilla-David et al. (2014) introduced a solar irradiance sensor using a photovoltaic cell, a temperature detector, and a low-cost microcontroller programmed with an artificial neural network to determine the irradiance. Under ordinary operating conditions, simulation and experimental results showed that these methods can obtain an accurate estimation. However, it is difficult to collect complete data to train these soft sensors. In addition, as time passes, a solar cell will change its electrical characteristics.
Sayago et al. (2011), Ruiz-Cárdenas et al. (2016), and Moreno et al. (2012) used neural network models capable of estimating solar radiation through meteorological variables such as temperature, relative humidity, wind speed, and rainfall. The results show determination coefficients between 0,80 and 0,86 and root mean square errors values (RMSE) between 25 and 48%. Khan et al. (2013), Capizzi et al. (2012), and Aliberti et al. (2021) explored models to estimate global solar radiation based on artificial neural networks (ANN), e.g. second-generation Wavelets with ANN, Long Short-Term Memory (LSTM), Feed-Forward Neural Networks (FFNN). The results show that the best models reached a correlation coefficient of 0,98 for Wavelet and ANN. The model based on LSTM obtained an RMSE equal to 113 wh/m2 and a determination coefficient of 0,9744. Hernández-Mora et al. (2013) developed a statistical methodology to determine solar irradiance and the ambient temperature from real measurement data, collected every hour from six in the morning to six in the afternoon. The Anderson-Darling test (Anderson & Darling, 1952; Torres, 2002) was applied to these data, thus achieving a correlation coefficient higher than 0,96 for each hour. Despite being a reliable model, it is necessary to have a database of at least five years. Obando et al. (2019) presented a literature review of ANN models for solar radiation estimation. It analyses different ANN structures under several performance criteria, providing a decision methodology to evaluate ANN models for solar radiation prediction.
Korachagaon et al. (2015) proposed several polynomial models to estimate global solar radiation using variables such as, ratio of duration of sunshine to maximum sunshine hours, mean temperature, and mean relative humidity. The models allow estimating radiation at any location of the earth’s surface. Some results showed that the least RMSE is within 0,185, and a correlation coefficient of the measured and estimated global solar radiation was found to be 0,52494. Likewise, Eraso-Checa et al. (2018) proposed a polynomial to estimate global radiation from the UV index, which is valid for Pasto, Colombia. The results showed a correlation factor of 0,9642, and the RMSE is 30,90, which is acceptable for mid-range and low-end measurement devices.
The main contribution of this paper is that it explores the relationship between the UV index and solar radiation. The responses of these variables have a similar behavior, and the spectral response curves denote similar characteristics. This work uses an ANN trained with radiation and UV index data, and it determines the radiation based on UV index measurement and time. This estimation model becomes relevant because UV sensors are cheaper than radiation sensors, and generally they occupy less space.
This paper is organized as follows: first, it presents the theoretical aspects related to the UV index and irradiance; second, the methodology is presented and described; third, all recurrent neural networks based on NNARX models are presented; and finally, the results and conclusions are presented.
METHODOLOGY
Solar radiation
The Sun is the Earth’s main energy source. This star emits electromagnetic radiation of different frequency and wavelength in the electromagnetic spectrum. Solar radiation in the atmosphere has a wavelength between 150 nm and 4.000 nm, where 7% corresponds to ultraviolet radiation, 47% to visible radiation, and 46% to infrared radiation (Eraso-Checa et al., 2017; Würfel, 2009). However, the wavelength that reaches the Earth’s surface is attenuated to a range between 380 and 780 nm (Narváez & Hernández, 2013) due to absorption, reflection, and scattering phenomena. This also means that the global radiation on the surface is composed of beam, diffuse, and reflected radiation (Jäguer et al., 2006). Another parameter that attenuates solar radiation is the optical air mass, which is the path length that sunlight follows through the atmosphere (Jäguer et al., 2014).
Figure 1 shows the power received per unit surface exposed to radiation for each wavelength at the outer side of the Earth’s atmosphere. It shows that the visible part of the spectrum has the large area between 400 nm and 700 nm, with a spectral irradiance peak around 2.000 W/m2.nm. Ultraviolet (UV) light occupies the high energetic part of the spectrum.
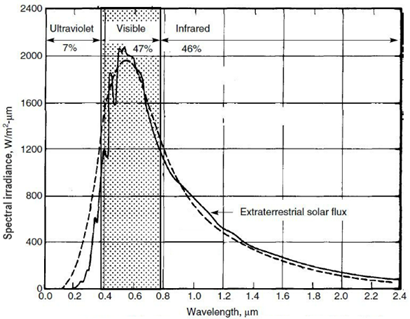
The integration of spectral irradiance over wavelength corresponds to the irradiance, which is a power per unit area (W/m2 or joules/m2sec). This is a magnitude scale that includes the complete wavelength information. Radiation measuring equipment gives the solar radiation response as irradiance (W/m2).
UV index
UV radiation is just a part of the solar spectrum at high frequencies (>1016 Hz). This means that it is very energetic and can ionize atoms by electrically charging them (Casal, 2010). Photon energy ranges from 3,2 eV up to 1,2x10³ eV (Bohorquez-Ballén & Pérez-Mogollón, 2007). UV radiation allows human beings to assimilate vitamin D and, in plants, it makes photosynthesis possible. However, it also has negative effects if there is prolonged exposure, especially in human health (it breaks biological molecules, damages the eyes and skin, it causes cancer, etc.) (Bohorquez-Ballén & Pérez-Mogollón, 2007).
UV radiation is divided into three regions (Ryer, 1988):
UV-A: (315-400 nm): It is the least harmful to human beings, and its intensity reaches the terrestrial surface.
UV-B (280-315 nm): It is toxic to life and can destroy it. Ozone absorbs this energy (approximately 90%) and prevents it from reaching the Earth (Casal, 2010).
UV-C (100-280 nm): Its collision with oxygen atoms causes ozone generation, and it does not reach the Earth. This radiation would destroy life.
According to Lucas et al. (2006), ambient UV radiation can be measured using a representation of the wavelength variation in the production of skin erythema. The UV index is an instance of this representation (the other are SED and MED). It is defined as the time-weighted average effective UV irradiance multiplied by 40, and it is expressed as power per unit area (W/m2).
Figure 2 shows the behavior of both spectral irradiance and the erythemal action spectrum in the UV region.
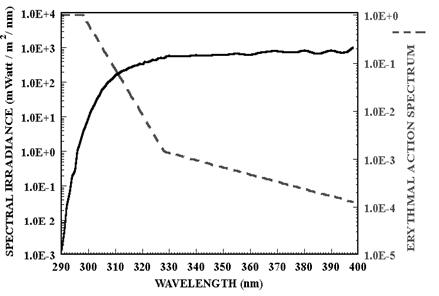
Source: National Services Centre (n.d.)
Figure 2 UV spectral irradiance and erythemal action spectrum
The UV index is categorized as shown in Table 1, and the values range from 0 on. The higher the index value, the greater potential damage to the skin in the less time.
Table 1 UV index categorization
| UV Index | Danger Category |
|---|---|
| 0-2 | Low |
| 3-5 | Moderate |
| 6-7 | High |
| 8-10 | Very High |
| 11+ | Extreme |
Source: based on National Services Centre (n.d.)
Methodological process
To develop and validate the estimation model, a methodological process was carried out, which was adapted from Eraso-Checa et al. (2018). In this case, the methodology used is composed of a typical process that increases estimation reliability. In Figure 3, the methodological process is shown.
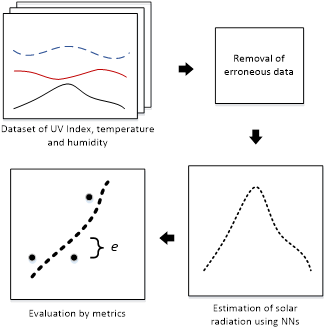
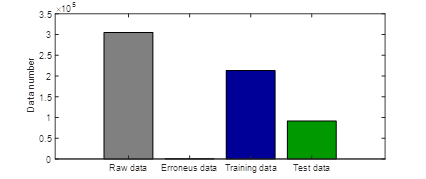
A set of climatic variables (UV index, temperature, humidity, and solar radiation) was extracted from the Davis Vantage PRO station. In this case, the dataset is made up of approximately 305.000 data for each variable from 2013 to 2018. Since the first data are raw, it was necessary to remove spurious and erroneous data using an inspection algorithm. This process removes not-a-number data, data equal to infinity, and unusual data such as out-of-range values that are physically impossible to reach. Finally, a training dataset of 213.019 data and a validation dataset of 91.696 were obtained.
After that, solar radiation was estimated with following steps: first, the estimation model based on neural networks (NN) was defined, considering estimation structures and inputs; secondly, the structure was trained using the dataset; then, there was an evaluation process using the validation dataset, which calculated some predefined metrics such as mean absolute error (MAE), root mean square error (RMSE), and the coefficient of determination (R2).
Estimation models based on ANNs
Different nonlinear models based on ANNs were used to estimate solar radiation. Mainly, two different ANN structures were used to model the estimators: Neural Network Finite Impulse Response (NNFIR) structure and Neural Network Autoregressive with Exogenous Input (NNARX).
NNFIR is a simple model estimator fed with external excitations to make a prediction. Figure 4 shows, on the left side, a NNFIR that does not have feedback. NNARX is a recurrent neural network. On the right side of Figure 4, the network uses external excitations and past instants to make a prediction.
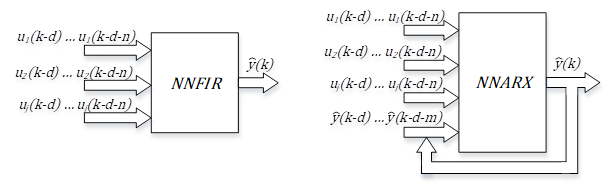
As shown in Figure 4, the NNFIR and NNARX models are fed with past instants of one or more inputs (u1(⋅), … , uj(⋅)),, and past instants of the estimated output (ŷ(⋅)) in case of the NNARX structure. For more details on NNARX and NNFIR structures, see their description in the referenced literature (Norgaard et al. 2000).
In addition, this paper proposes to use the temperature as part of the estimator, aiming to compensate the lack of information of the reduced band in the UV index sensor. In that way, it is possible to quantify the contribution of the temperature in the estimation of solar radiation. To differentiate the models, models that use UV index and/or estimated radiation are denoted with a at the end, and the estimation models that use temperature in addition to the UV index and/or estimated radiation are denoted with 𝑏 at the end. The definitions of these models are shown below, and they are summarized in Table 2.
Table 2 Mathematical definition of the NNFIR and NNARX models
| Model | Mathematical definition |
|---|---|
| NNFIRa | 𝑅(𝑘) = 𝑓(𝑈𝑉(𝑘)) |
| NNFIRb | 𝑅(𝑘)= 𝑓(𝑈𝑉(𝑘), 𝑇(𝑘)) |
| NNARX111a | 𝑅(𝑘)= 𝑓(𝑅(𝑘−1),𝑈𝑉(𝑘), 𝑈𝑉(𝑘−1)) |
| NNARX111b | 𝑅(𝑘)= 𝑓(𝑅(𝑘−1), 𝑈𝑉(𝑘), 𝑈𝑉(𝑘−1),𝑇(𝑘), 𝑇(𝑘−1)) |
| NNARX211a | 𝑅(𝑘)= 𝑓(𝑅(𝑘−1), 𝑅(𝑘−2), 𝑈𝑉(𝑘), 𝑈𝑉(𝑘−1)) |
| NNARX211b | 𝑅(𝑘)= 𝑓(𝑅(𝑘−1), 𝑅(𝑘−2), 𝑈𝑉(𝑘), 𝑈𝑉(𝑘−1), 𝑇(𝑘), 𝑇(𝑘−1)) |
| NNARX221a | 𝑅(𝑘)= 𝑓(𝑅(𝑘−1), 𝑅(𝑘−2), 𝑈𝑉(𝑘), 𝑈𝑉(𝑘−1), 𝑈𝑉(𝑘−2)) |
| NNARX221b | 𝑅(𝑘)= 𝑓(𝑅(𝑘−1), 𝑅(𝑘−2), 𝑈𝑉(𝑘), 𝑈𝑉(𝑘−1), 𝑈𝑉(𝑘−2), 𝑇(𝑘), ??(𝑘−1), 𝑇(𝑘−2)) |
Source: Authors
𝑅(⋅) is the global solar radiation, 𝑈𝑉(⋅) is the UV index, 𝑇(⋅) is the ambient temperature, and k is the time instant. NNFIR and NNARX structures are configured as follows: one hidden layer with 20 neurons, sigmoidal activation function, and Bayesian Regularization as the training algorithm.
RESULTS
In this section, the first part describes the station that collected the raw data. The second one describes the training and validation processes, and then the estimation results are presented by figures and tables with the evaluation metrics.
Meteorological station and data set
Solar radiation, the UV index, temperature, and humidity data were collected from November 2013 to December 2018 using the DAVIS Vantage Pro 2.0 meteorological station. This equipment uses the 6450 solar radiation sensor (Davis Instruments, 2014a) and the 6490 UV sensor that measures the global solar UV index (Davis Instruments, 2014b).
After applying the methodological process to 305.172 data, a training dataset of 213.019 elements and a validation set of 91.696 data for each variable (30% of total data) were obtained. There were 457 spurious and erroneous data, as shown in Figure 5.
Numerical results
The NN MATLAB toolbox was used to train the eight proposed estimation models. Each model was trained using its corresponding dataset (inputs, outputs, and validation dataset).
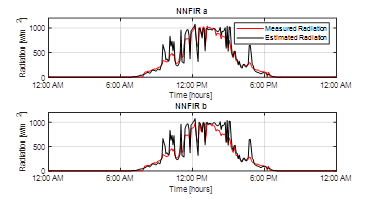
The following Figures show the solar radiation estimation results using a random day from the validation data set.
As shown in Figure 6, the radiation estimation with the NNFIRa and NNFIRb structures was able to follow the general behavior of the measured radiation. However, the error increases due to instant radiation changes. These models have an estimation error of
 and
and
 , respectively.
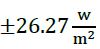
The NNARX111a and NNARX111b structures improve the estimation of solar radiation reducing the error to
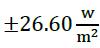 and
and
 , respectively (Figure 7). This optimization occurs because these structures make a prediction using past and present data. Therefore, they have a measurement radiation rate that is used to predict the next radiation value.
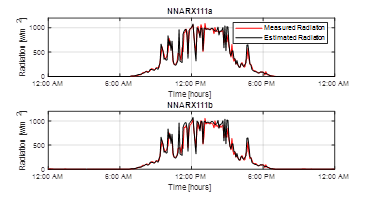
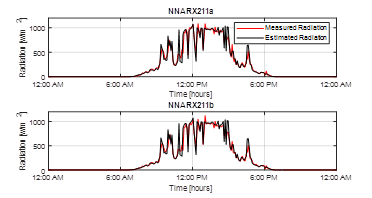
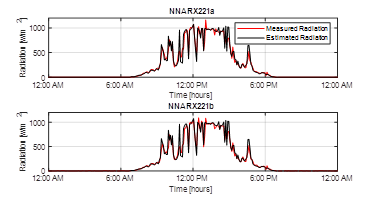
Figures 8 and 9 show the NNARX211a, NNARX211b, NNARX221a, and NNARX221b structures. These kind of structures reduce the error between
 and
and
 . This is posssible because the network makes a prediction from two past instants. In the same way, predictions with structures that include more than two past instants were developed. Nevertheless, the error does not reduce its value significantly.
From Figures 7-9, it can be noticed that the differences between type a and b models are not significant. Despite this, type b models use other variables (temperature, humidity) to complement the estimation in contrast with type a models, which only use the input variable and the past instants. These additional variables do not significantly reduce the error. In contrast, the error increases in some cases.
According to the numerical results presented in Table 3, considering the validation data set (91.696 elements), type α models have a similar behavior to type b ones. Type b models have a smaller RMSE and a bigger R2 coeficient in comparison with type α models. In contrast, type α models have a smaller MAE than type b models. However, the differences between models α and b are not significant.
Table 3 Numerical results of estimation models for the validation dataset
| Structure/Metric | RMSE | MAE | R2 |
|---|---|---|---|
| NNFIRa | 87,855 | 42,526 | 0,92294 |
| NNFIRb | 86,863 | 41,301 | 0,92489 |
| NNARX111a | 55,835 | 18,624 | 0,96805 |
| NNARX111b | 55,532 | 18,643 | 0,96838 |
| NNARX211a | 55,066 | 18,314 | 0,96895 |
| NNARX211b | 54,809 | 18,347 | 0,96925 |
| NNARX221a | 54,710 | 17,905 | 0,96927 |
| NNARX221b | 54,321 | 18,069 | 0,96971 |
Source: Authors
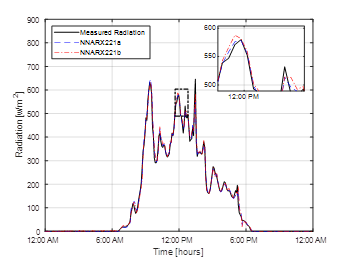
Also, NNARX221a and NNARX221b have the best performance in terms of RMSE, MAE, and R2 compared to other estimation models.
As seen in the Figure 10 and Table 3, the differences between estimation structures NNARX221a and NNARX221b are not significant. Hence, the contribution of the auxiliary variables (temperature and humidity) in the estimation of solar radiation is not relevant. In this sense, the NNARX221a model has the best performance (based on R2) only using past and present instants of solar radiation and the UV index.
CONCLUSIONS
This similarity in graphical patterns between the UV index information recorded with the 6490 Davis sensor and the solar radiation data recorded with the 6450 Davis sensor allow estimating solar radiation based on UV index. For this process, there were two NNFIR and eight NNARX-trained structures. The best performance corresponds to a NNARX221 structure that makes a prediction using two past instants that include the UV index and its own outputs. It shows a determination coefficient (R2) of 0,9697, a RMSE equal to 54,32, and a MAE of 18,06 w/m2. Because of that, the use of this structure allows the determination of solar radiation in an accurate way using the UV index.
The numerical results show that the contribution of the auxiliary variables (temperature and humidity) in the estimation of solar radiation is not relevant. The best estimations are made only using past and present instants of solar radiation and the UV index. This is particularly important since UV index measurement equipment usually has a lower cost than global radiation ones.
For future work, it could be interesting to test other prediction techniques based on artificial intelligence, such as random forests, decision trees, and short-term memories, among others. This methodology and models can be generalized to be used with other variables or time series.

