


 English (pdf)
 Article in xml format
 Article references
 Send this article by e-mail
 Cited by SciELO
  Cited by Google
  Similars in
SciELO
Similars in
SciELO  Similars in Google
 Permalink
INTRODUCTION
As a consequence of increasing population concentration, both the proximity of the town of Madrid (Cundinamarca) to the city of Bogotá and the growing metropolitan area around the latter (Aponte, 2011) have a significant influence on the increased urbanization and the change in land use of the town. This can be observed in the latest census data on population, construction, and dwelling, which was conducted by the National Planning Department (DNP, 2020). In addition, Madrid is perceived as a town with land that is still available for business and enterprise uses (CCB, 2016), and it contributes significantly to the gross income of the whole department of Cundinamarca in industrial sectors such as food production, plastics, and rubber products manufacturing, among others (Gobernación de Cundinamarca, 2015). It also has a useful location and road accessibility to the center and eastern regions of the country, and it is an extraction site for construction materials such as dressing, sand, and gravel (Contraloría de Cundinamarca, 2018). There is an additional benefit to the industrial use of the town: the presence of Colombian Air Force facilities, as well as the possible future development of a small airport, which is currently in design and diagnostic stages by the National Infrastructure Agency (ANI, 2017). In light of the above, analyzing variations in vegetation cover, land use, and urban growth is relevant to the planning and management of the town’s resources.
In this research, Geographic Information Systems (GIS) were used to analyze, process, store, generate, and visualize geographically referenced data. This allowed integrating images and descriptive and spatial data from applied mathematical models (Sarria, 2006) in order to analyze the changes in land use and vegetation cover between 1977 and 2020 in the municipality of Madrid, Cundinamarca, Colombia.
Moreover, vegetation and buildings normalized differential indices were used to complement the analysis by estimating artificial or in-development areas.
This type of analysis is a contribution to the municipality’s planning, management, and development because it provides insight into the behavior of population, economic, and natural land protection aspects.
METHODOLOGY
This is a qualitative research on the influence that urban expansion has had on vegetation cover and land use over time in the municipality of Madrid, Cundinamarca. It is supported by a multitemporal analysis with satellite images from 1977, 1985, 1997, 2007, 2018, and 2020. These specific dates almost coincide with those of official population and dwelling census conducted by the National Statistics Administration Department (DANE) (Alcaldía de Bogotá, 2018).
Table 1 shows the data obtained from the United States Geological Service (USGS) via sensors Landsat 5 and Landsat 8 (Alonso, 2006).
Table 1 List of satellite images of Madrid, Cundinamarca
| Sensor | Register date (Acquisition) | ID | Path/Row |
|---|---|---|---|
| Landsat 5 | January 07, 1977 | LM02_L1GS_008057_19770107_20180421_01_T2. | 8/57 |
| Landsat 5 | March 22, 1985 | LM05_L1TP_008057_19850322_20180406_01_T2. | 8/57 |
| Landsat 5 | August 30, 1997 | LT05_L1TP_008057_19970830_20161230_01_T1. | 8/57 |
| Landsat 5 | September 27, 2007 | LT05_L1TP_008057_20070927_20161111_01_T1.tar | 8/57 |
| Landsat 8 | December 30, 2018 | LC08_L1TP_008057_20181230_20190130_01_T1.tar | 8/57 |
| Landsat 8 | March 22, 2020 | LC08_L1TP_008057_20200322_20200326_01_T1.tar | 8/57 |
Source: Alonso (2006)
Figure shows the processing and treatment of satellite images using the Arc Gis (ESRI) tool in order to obtain input data for the multitemporal analysis.
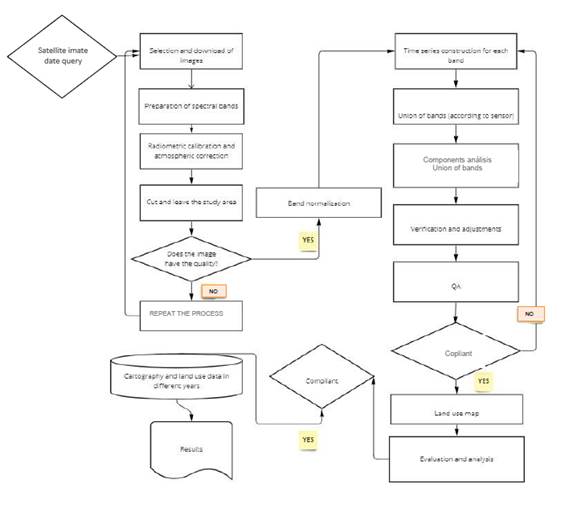
In the image selection stage, the main criterion was a maximum cloudiness of 20% in the area. This, to ensure that it could be used to observe and quantify the vegetation in the land (Ávila & Molina, 2018). Afterwards, an image quality enhancement by radiometric calibration and atmospheric correction was performed in order to prepare the images for band combination (Santana et al., 2010), as well as to ensure that the subsequent supervised classification process would be optimal (Tibaquirá, 2016).
Supervised classification was carried out through the Corine Land Cover methodology, which was adapted for the Colombian context (IDEAM, 2010). The assigned categories were agricultural territories, artificial territories, clouds, water bodies, forests, and seminatural areas (Lamprea, 2017).
Finally, via spectral band combination of red and near infrared, the Normalized Difference Vegetation Index (NDVI) and Normalized Difference Building Index (NDBI) were mapped (Ariza et al., 2018) for each year under study, in order to verify (a) the quantity and particularity of the vegetation, (b) the modified areas and their changes over time, (c) anthropogenic modifications due to land use and cover, and (d) how the former’s increase over time has been throughout the time interval used for the multitemporal analysis (Cruz et al., 2020).
RESULTS
Once the base data had been collected and the treatment and classification of satellite images had been performed, the following quantification of areas of interest was obtained (Table 2). The final selected images had a cloudiness of less than 3%.
Table 2 Multitemporal analysis of cover and land use in Madrid, Cundinamarca
| Year | 1977 | 1985 | 1997 | 2007 | 2018 | 2020 | ||||||
|---|---|---|---|---|---|---|---|---|---|---|---|---|
| Cover | % | km2 | % | km2 | % | km2 | % | km2 | % | km2 | % | km2 |
| Forests and seminatural area | 34,7 | 41,5 | 21,8 | 26,1 | 13,2 | 15,8 | 13,2 | 15,8 | 12,9 | 15,4 | 4,8 | 5,7 |
| Clouds | 0,2 | 0,2 | 0,2 | 0,2 | 0,0 | 0,0 | 0,0 | 0,1 | 0,8 | 1,0 | 2,4 | 2,9 |
| Water bodies | 0,0 | 0,0 | 0,0 | 0,0 | 0,0 | 0,1 | 0,0 | 0,0 | 0,0 | 0,0 | 0,2 | 0,2 |
| Agricultural territories | 60,3 | 72,1 | 71,9 | 86,0 | 73,5 | 87,7 | 73,5 | 87,7 | 64,4 | 77,0 | 58,3 | 69,7 |
| Artificial territories | 4,8 | 5,8 | 6,1 | 7,3 | 13,3 | 16,0 | 13,3 | 16,0 | 21,8 | 26,2 | 34,3 | 41,1 |
| Total | 100 | 119,6 | 100 | 119,6 | 100 | 119,6 | 100 | 119,6 | 100 | 119,6 | 100 | 119,6 |
Source: Authors
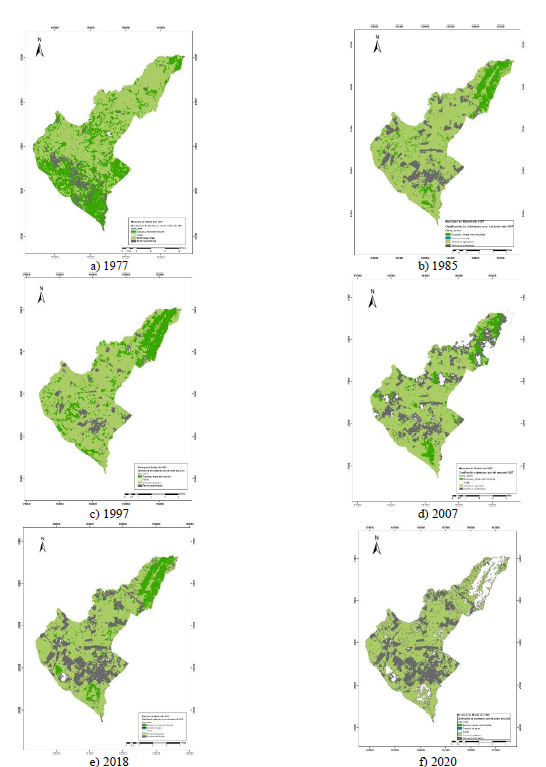
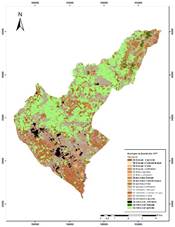
Figure shows the mapping of the area categories obtained during the image classification process.
Source: Authors
Figure 2 Mapping of the multitemporal analysis of land use in the municipality of Madrid, Cundinamarca, from 1977 to 2020
Next, the most significant changes in cover and land use in Madrid for the time frame under study are presented.
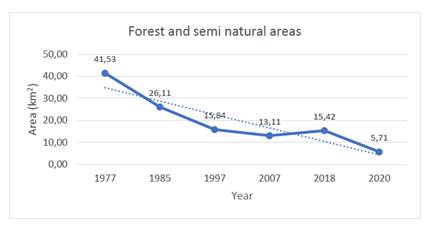
Forests and seminatural areas
This type of cover showed a continuously decreasing behavior in the observed time frame. The area lost to the other types of covers from the first year of the observed interval to the last is 86%. This, despite the 2012 modification to the municipality’s Basic Land Use Plan, in which the conformation of protected areas around native forests was encouraged (Concejo Municipal de Cundinamarca, 2012). The decreasing tendency of total forests and seminatural areas is shown in Figure 3. The total area for this type of cover in 2020 was only 5,71 km2.
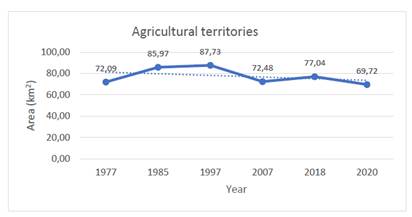
Agricultural territories
This type of cover represents the predominant economic land use in the municipality (CCB, 2016). In the observed years, it maintained an average of 70% of the town’s total area, as can be seen in Figure 4. There is a slight 10% decrease in the last time interval (between 2018 and 2020), but it is still the most significant land use in the town.
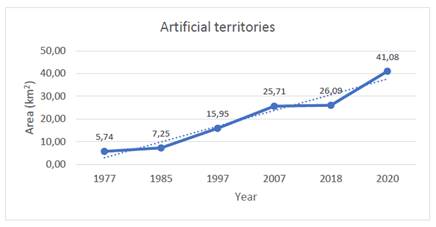
Artificial territories
As it is shown in Figure 5., the total artificial cover area increased in the town. This type of cover results from the urban and industrial use of land, including mining and extraction, debris dump yards, and artificial non-agricultural greenery. This increase was steady during the observed time frame. For 2020, the total area covered by artificial territory was 41,08 km2, which evidences an urban expansion in the municipality.
The expansion of artificial territories coincides with the observed loss of land of other types of cover, especially forests and seminatural areas, as can be seen in Figure 2. This is validated by comparing the cover and land use overlap between the first and the last year of the studied time frame.
Additionally, according to projections by the Madrid Town Hall (Alcaldía de Madrid, 2019), the need to supply the dwelling and infrastructure demand will cause the artificial cover to increase even more in the near future.
Next, the behaviors of the area count for the three types of cover and land use from 1977 to 2020 are presented side by side as evidence for the previous observations.
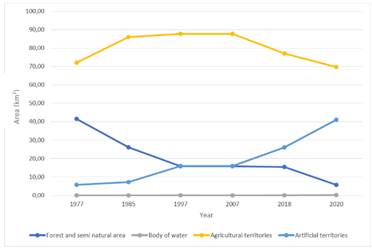
Source: Authors
Figure 6 Behavior of types of cover and land uses in Madrid across the observed time frame
The change in cover and land use is analyzed according to the maps obtained by means of a transition matrix (Table ) (Humacata & Buzai, 2018).
Table 3 Transition matrix for Madrid (1977 and 2020)
Source: Authors
The agricultural territory was found to have an unchanged area of 43,13 km2, which is 36,1% of the total area of the town, followed by artificial territory, with 3,12 km2 (2,6% of the total area).
It is evident that the most frequent changes in land use were (a) from forest and seminatural areas to agricultural territory, and (b) from the agricultural to artificial territory. This could have been triggered by the population increase evidenced in the census data (an increase of approximately 112.307 inhabitants) (Oltrá et al., 2010).
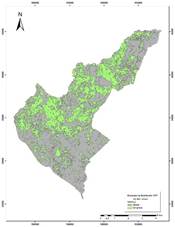
There was a noticeable reduction in the forest area (39,68 km2 of the total area lost), a clear increase in artificial territory, and a location exchange between the latter and agricultural territories. This can be observed in Figure and Figure.
Next, by overlapping the maps obtained for 1977 and 2020, it was observed that a total area of 72,16 km2 in the town changed cover and land use, i.e., 60% of the total area of the municipality (Figure 8). Significant changes, as mentioned above, were seen in forest and agricultural cover, followed by more urban use.
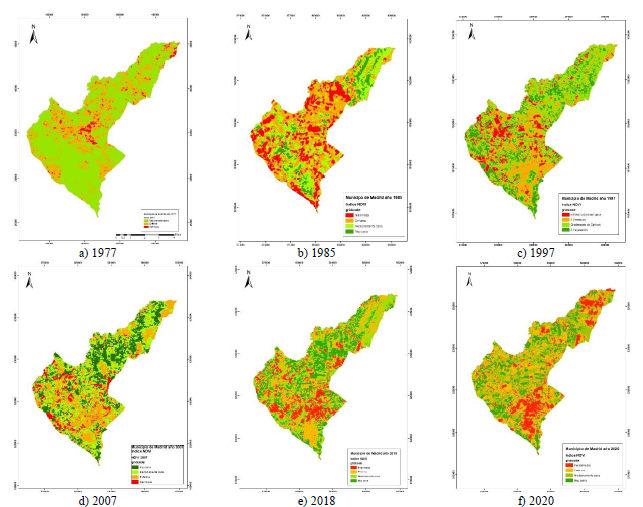
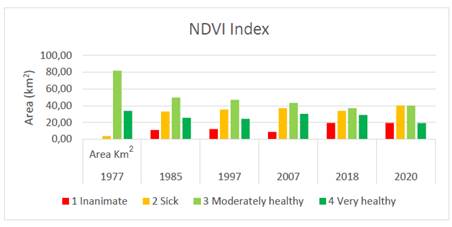
NDVI index
This index represents the quantity, quality, and development of vegetation (Meneses, 2011). The following classification and intervals were used: inanimate (-1 to 0), sick (0 to 0,33), moderately healthy (0,34 to 0,66), and very healthy (0,66 to 1) (Muñoz, 2013).
The areas shown in Table were calculated.
Table 4 Multitemporal NVDI index for Madrid, Cundinamarca
| Year/ Classification | 1977 | 1985 | 1997 | 2007 | 2018 | 2020 | |
|---|---|---|---|---|---|---|---|
| Area (km2) | |||||||
| 1 | Inanimate | 0,20 | 11,0 | 12,30 | 8,83 | 19,58 | 19,70 |
| 2 | Sick | 3,71 | 33,1 | 35,66 | 37,04 | 34,00 | 40,27 |
| 3 | Moderately healthy | 81,81 | 49,7 | 47,22 | 43,43 | 37,00 | 40,20 |
| 4 | Very healthy | 33,86 | 25,7 | 24,39 | 30,27 | 29,00 | 19,41 |
| Total | 119,58 | 119,58 | 119,58 | 119,58 | 119,58 | 119,58 | |
Source: Authors
Figure shows the vegetation type variation for the observed time frame. There is an evident increase in the area occupied by -1 to 0,33 vegetation, which may be a consequence of the increased urban use of land.
There is a noticeable agricultural land use for flower cultivation and cattle raising in the municipality.
Figure 10 shows the annual behavior of the municipality’s NDVI Index for the observed time frame.
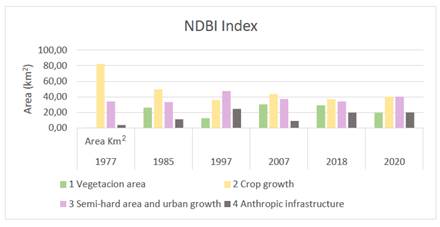
NDBI Index
This index allows discriminating between areas with building surfaces, in-development areas, and areas naturalized with vegetation (Totolhua, 2018). The following classification and intervals were used: vegetation zone (-1 to 0), crop growing (0 to 0,33), semihard zone or urban development zone (0,34 to 0,66), and anthropic infrastructure (0,66 to 1).
Table shows the calculated areas.
Table 5 Multitemporal NDBI Index for Madrid, Cundinamarca
Source: Authors
As shown in Figure , anthropogenic infrastructure and semihard zones increased in the observed years, which is in line with the analysis of cover and land use change.
Areas belonging to the crop growing category remained stable within the time frame, averaging 40 km2, which could be also concluded by means of the NDVI index analysis.
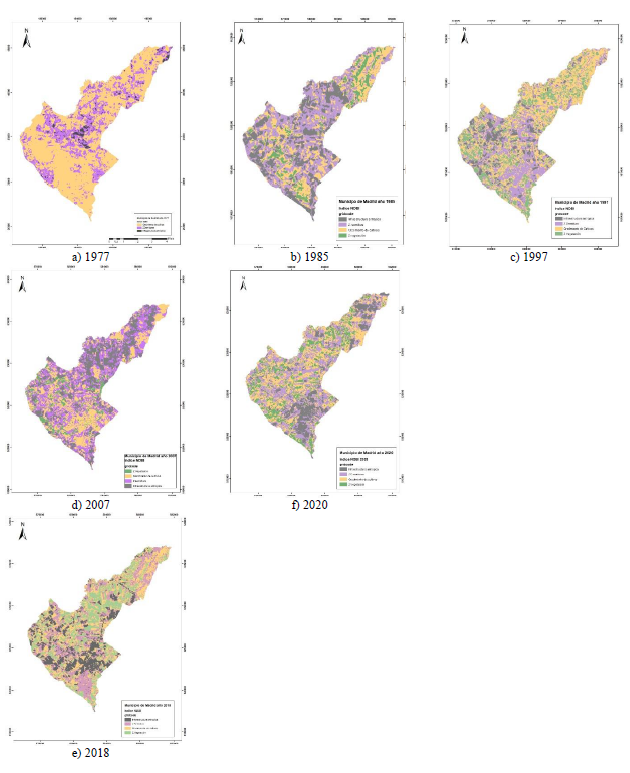
Next, the annual behavior of the NDBI index for the municipality is presented.
CONCLUSIONS
A significant decrease in forests and seminatural cover areas in the municipality of Madrid within the evaluated time frame was evidenced. Simultaneously, an increase in artificial territory was observed. Both observations coincide with a population increase, which was recorded during the census conducted by DANE. Urban expansion can also be located predominantly in the center and the southeast of the town due to their ease of access to the Sabana Road System.
Agricultural territory maintained an average of 66, 95% of the town’s total area, which makes it the most widespread land use in Madrid. This evidences its economic importance to the town. Moreover, as shown in the NDVI analysis, crop growing remained steady in the observed time frame. However, based on the conducted multitemporal analysis, it was evident that, although the percentage of land used for agriculture remained steady, it moved from its initial location; artificial territory appeared in former agricultural areas, and agricultural territory appeared in former forests and seminatural areas.
Multitemporal analysis is a useful application of public-access satellite images, and it may assist local governments in conscious urban development planning and in the protection of natural areas.
The analysis of NDVI and NDBI indexes easily quantifies cover and land use behavior over time and is a key supplement to the supervised classification method. Additionally, a close relation is observed between the results obtained from both applied methods. The analysis of change in cover and land use by supervised classification and the band overlap in satellite images used to obtain the NDVI and NDBI indices were both evidence of the noticeable reduction in forests and seminatural cover areas in the town, as well as of the increase in urban land use.
The implementation of more effective protection measures is recommended to preserve forests and seminatural cover areas, as they have lost an 86% of their area between 1977 and 2020. Additionally, there is a need for strategies that appropriately regulate urban growth and ensure the protection of natural areas without compromising the town’s economic development.

