


 English (pdf)
 Article in xml format
 Article references
 Send this article by e-mail
 Cited by SciELO
  Cited by Google
  Similars in
SciELO
Similars in
SciELO  Similars in Google
 Permalink
INTRODUCTION
Colorectal cancer is the third most aggressive cancer worldwide, reporting more than 1,5 million new cases and more than 800.000 associated deaths in 2018. In more specific studies, a drastic number of colon cancer incidences shows that, in America, a 60% increase is projected by 2030, with a total of 396.000 new cases per year (Ferlay et al., 2019). Different studies have demonstrated that patient survival probability (SP) depends on early detection, treatment, and follow-up. In particular, if detection occurs during the first stage, the patient has a survival probability (SP) of 93%. However, in the fourth stage, this SP decreases to 8% (Pérez, 2012; Basave, 2018). Therefore, an early diagnosis is essential for the effective and successful treatment of the disease.
Colonoscopy is currently considered to be the most effective resource for characterizing and detecting colorectal cancer, especially in the early stages of the disease (Dávila et al., 2006). Colonoscopy allows for the inspection of the intestinal tract and the visualization of abnormal intestinal fold regions in order to evaluate, characterize, and even remove neoplasms. During colonoscopy, the most significant evaluation is polyp detection, which are abnormal protuberances and the main biomarkers of colorectal cancer (Cohan & Varma, 2018). Polyp detection along the intestinal tract is a challenging task that requires exhaustive and expert observations, which mainly take around 20-30 minutes during the clinical routine (Kuperij et al., 2011). Nevertheless, various papers report that 4-12% of polyps are missed during a typical colonoscopy procedure (Tajbakhsh et al., 2016; Wang et al., 2013). These missing polyps are primarily associated with the physician's experience, the patient's condition during the exam, and the disease stage. Even more critically, recent clinical studies have evidenced that the polyp overlooking rate is up to 25-26%, a dramatic factor associated mainly with small polyps of around 5-9 mm (Angermann et al., 2016; Bressler et al., 2007; van Rijn et al., 2006). These tiny polyps are present in the early stages of the disease, so identifying them constitutes a significant opportunity to achieve treatment efficacy, a fact related to the higher probability of patient survival (Bernal et al., 2017; van Rijn et al., 2006). In contrast, new evidence suggests that some patients may develop colorectal cancer within 3-5 years after colonoscopy (le Clercq et al., 2014; Rabeneck & Paszat, 2010).
Hence, computational systems to support colonoscopy procedures have emerged as fundamental support tools to detect, segment, classify, and generally characterize polyps (Tajbakhsh et al., 2015; Fan et al., 2020). In polyp modeling, representing such masses is challenging due to their wide variability in shape, color, and texture patterns. Besides, polyps are difficult to detect due to their close similarity to the intestinal tract in neighboring regions, even for gastroenterologists (Pérez, 2012). Additionally, the resolution of colonoscopy cameras, sudden movements during exploration, and high variation from one image to another make automatic polyp recognition a challenging task.
Regarding semi-automated polyp detection, one classification of the models is based on polyp features such as shape, texture, and color (Bernal et al., 2017). For instance, Tarik et al. (2016) propose a model to represent the shape of polyps using various methods such as the Hough transform. In this case, it is assumed that polyps are similar to cycloids. Figueiredo et al. (2019) use local binary patterns (LBP) to represent polyp morphology. These methods, however, generate a high number of false-positives due to the limitations in modeling polyp variability and their close similarity with respect to the surrounding regions, changes in lighting, and sudden camera movements. Some approaches include polyp geometry and color description, but they remain limited to dealing with shape (Tajbakhsh et al., 2016). Recent works have incorporated deep learning representation in order to deal with polyp characterization (Du et al., 2019). For instance, the Faster R-CNN architecture, which includes two architectures to characterize and localize objects, has been adapted to polyp characterization (Mo et al., 2018). In addition, Zheng et al. (2019) adapted the UNet with optical flow in order to obtain temporal information and achieve adequate polyp detections. Zhang et al. (2018) implemented the RYCO net, an extension of the YOLO (You Only Look Once), which adapted a discriminatory correlation filter in order to obtain temporal information and refine detection. These approaches have proven to be effective for polyp variation modeling based on non-linear and convolutional visual representation. However, these architectures require large datasets to properly model high polyp variability, which constitutes a major limitation in the clinical domain. Additional works have taken advantage of transfer learning schemes to tune deep networks to specific polyp characterization, starting from natural image domain representation. Nevertheless, in most cases, these learning schemes are overtrained on datasets, losing generality to deal with variability in clinical scenarios. Hence, the problem regarding the automatic quantification, identification, and characterization of malign polyp masses in real-time video colonoscopies with high polyp variations remains open.
This work introduces a computational strategy that generates attention maps with the most probable polyp locations in order to support detection tasks during colonoscopy. To this effect, colonoscopy frames are encoded using deep features obtained from the first layer of a convolutional neural network (CNN). Each deep map encodes polyp-specific features, thus allowing for a nonlinear visual representation. A Dense Hough Transform (DHT) is built from deep features initialized from first frame delineation. This encoding allows a non-parametric shape representation of the polyps. For each frame, visual attention maps with the most probable polyp locations are generated and obtained by recursively searching the DHT representation that encodes data on polyp location. The proposed method incorporates two methods to locate potential regions with polyp masses in the attention maps: cosine distance and corner detectors. Finally, the obtained region is back-projected to the spatial frame corresponding to the most probable location. This paper is structured as follows: the Methodology section introduces the proposed strategy for polyp detection; Results demonstrates the effectiveness of the proposed approach; and Conclusions includes the discussion and potential future works.
METHODOLOGY
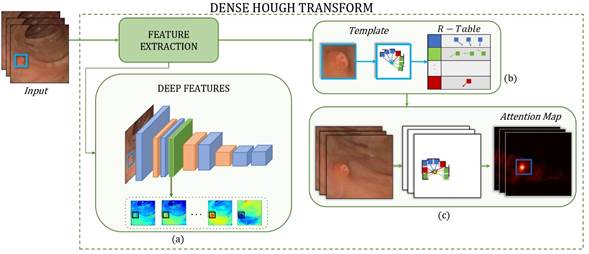
This paper presents a novel approach that takes a polyp template in the first frame and generates attention maps in successive sequence frames in order to support polyp localization and characterization during colonoscopy. The polyp template representation is obtained using deep convolutional features, and it is encoded with cumulative feature tables. Then, a voting process of dense features over each pixel location is carried out in order to determine the most probable location of abnormal masses. Figure 1 shows the proposed method.
Source: Authors
Figure 1 Pipeline of the proposed approach. From an input video, the DHT learns the extracted features. This method is divided into three stages: a) extracting the deep features, b) learning the polyp template and building the R-Table, and c) generating frame visual attention maps containing the polyp location probability.
Nonparametric polyp representation
Polyps are observed as nonparametric shapes with high appearance and geometric intra- and inter-patient variability. Local modeling of these masses is demanding while dealing with such variations. In this work, DHT is a multidimensional feature voting scheme that operates at the pixel level and allows generating flexible and independent dense representations of geometric or appearance structures (Manzanera, 2012). Specifically, the polyp region is encoded into a template and mapped through a video sequence, and the spatial regions with the highest probability of polyp matching are highlighted, i.e., the attention maps that summarize the responses in Hough's multidimensional space. This process consists of two phases: polyp template learning and searching for the polyp template in subsequent frames for detection. This can be described as follows:
Polyp template learning
A polyp template is learned in the first colonoscopy frame in order to capture a dense and local visual representation. First, for any colonoscopy sequence, a dense coding is obtained which represents each pixel 𝑥 at a particular location (𝑚,𝑘)𝑇 along the axis 𝑀 and 𝐾 by a feature vector 𝑥∈ℝ𝑁. Each frame 𝐼𝑡∈ℝ(𝑤×ℎ×𝑁) is therefore a multidimensional matrix with 𝑁 features and a size of (??×ℎ), where 𝑡 is the frame number.
A particular template is a submatrix image manually selected to bound a polyp lesion example in the first frame. This subregion 𝑇𝑟 , with a size (𝑤𝑇×ℎ𝑇) that varies according to the polyp dimensions, is coded to represent visual polyp complexity. A Hough coding representation is herein obtained by computing the distances of each pixel feature with respect to the template center, which is defined as
 . Specifically, for a particular feature pixel 𝑥𝑖 in position (𝑚,𝑘,𝑖), the following distance is computed: (δ𝑀=
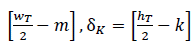 ). Each of the computed distances is weighted (ω) according to feature importance, storing the tuple (δ𝑀,δ𝐾,ω). This process is carried out when the gradient magnitude
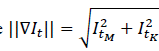 is greater than zero, thus ensuring the computation of edges with high probability of belonging to polyp tissue. According to the feature domain, these distances are indexed by defining feature bins (ϕ(𝑥𝑖)), forming a Representation Table RT(ϕ(𝑥)), which allows for an effective polyp description. Figure 1b illustrates this process, and Figure 2 depicts a function defined as R-Table().
Polyp search and detection
In each frame, colonoscopy attention maps Γ𝑡 are obtained by projecting the RT(ϕ(𝑥)) learned from the template 𝑇𝑟 for the rest of the colonoscopy sequence. These maps Γ𝑡 are matrices with frame dimensions (𝑤×ℎ) that store the most probable polyp locations. To assign the polyp probability to each pixel 𝑥 (with location (𝑚,𝑘)) each feature value 𝑥𝑖 points to a ϕ(𝑥) bin in the corresponding RT(ϕ(𝑥)). The selected bin ϕ(𝑥) stores a set of learned distances (δ𝑀+𝑚,δ𝐾+𝑘), which are projected from pixel location (𝑚,𝑘). Each of the projected distances votes with a weighted importance (ω) on the pixel with position (δ𝑀+𝑚,δ𝐾+𝑘). In such a case, if most pixels vote for the same position, this corresponding pixel will have the highest importance, i.e., it will be most likely that this location corresponds to the center of a polyp lesion. The process is carried out in all feature spaces and in each frame of the colonoscopy. Figure 1c illustrates the procedure for obtaining colonoscopy attention maps, and Figure 2 depicts a function defined as Attention-Maps().
Local polyp representation from deep features
Polyp modeling is a challenging task that must face a highly variable representation in colonoscopies. Additionally, specular highlights, sudden movements, and other artifacts increase the complexity of recovering polyps from appearance observations. Deep learning representations have emerged in the literature to model complex visual entities but require huge amounts of labeled training samples in order to achieve an effective solution. There are several works that deal with polyp modeling from such deep nets (Alagappan et al., 2018). However, there are few training sets available for polyp modeling, and their annotation is a very demanding process.
In this work, each colonoscopy frame I t is represented by using deep features from pretrained convolutional neural networks (CNN), which ensures the general and appropriate adjustment of visual representations. Each frame is characterized by activation blocks learned in low-level representations that consider nonlinear partitions of space. Convolutional decomposition learned with nonlinear filters is expected to provide a better characterization of polyps and their observational variability. The features for each pixel 𝑥={𝑥1,𝑥2,…𝑥𝑁} represent the response of 𝑁 convolutional filters in a primary layer.
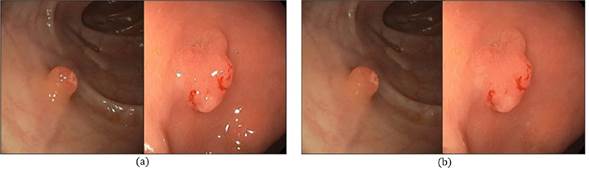
To compute these deep features x in each colonoscopy frame 𝐼 t , first, a preprocessing scheme to remove specular highlights is carried out. These appear as the brightest regions along the intestinal tract. This process starts by transforming RGB into HSV color representation and removing high brightness and a few saturations, together with an inpainting strategy (Bertalmio et al., 2001). Figure 3 depicts an example of this processing.
Once each frame is filtered out, the convolutional deep features are obtained by mapping each frame 𝐼𝑡 into the first layers of known and pretrained deep convolutional frameworks. This first layer decomposes visual information on low-level characteristics by progressively computing linear transformations, followed by contractive nonlinearities, projecting information on a set of 𝑁 learned filters Ψ𝑗={ψ1 𝑗,ψ2 𝑗,…,ψ𝑁 𝑗} in a given layer 𝑗. Hence, each frame 𝐼 is filtered by a particular Ψ𝑗 set, thus obtaining a convolutional feature representation: 𝑥=Σ𝑛=1…𝑁∗ψ𝑛 𝑗 , with 𝑥𝑖 as the characteristic resulting from convolution with respect to the filter Ψ𝑖 𝑗 . In this case, the intensity value of each activation ϕ(𝑥) represents the index that is stored into the 𝑅𝑇(ϕ(𝑥)). Therefore, there is no predetermined range of variation for all instances. These convolutional features preserve the spatial structure and can represent local and regional textural patterns, which can be effective in differentiating between polyps and folds in the intestinal tract. This work evaluated three state-of-the-art nets: ResNet, Inception-ResNet-V2, and DenseNet.
Attention maps
Colonoscopy attention maps Γ𝑡 in each frame 𝐼𝑡 represent the probability of each pixel location to be the centroid of a particular polyp region. These attention maps are implemented as a representation table RT(ϕ(𝑥)) of the learned polyp 𝑇𝑟 into deep feature space. Figure 4 shows examples of the resulting attention maps Γ𝑡 for different frames. Feature representation extracted through the deep learning helps these attention maps to effectively recover suspicious regions to which gastroenterologists should pay attention in order to identify abnormal masses. In such a sense, to select these regions, two different maximum rules are defined:
Maximum vote and similarity
A first nonlinear maximum operator is defined over the Γ𝑡 attention map in order to select the most probable polyp regions. Over the maximum vote pixel
 , a region with a template dimension is overlapped. The selected region represents the most probable region in attention map Γ𝑡. This process is repeated several times, and, after several iterations, a set of
 points are selected.
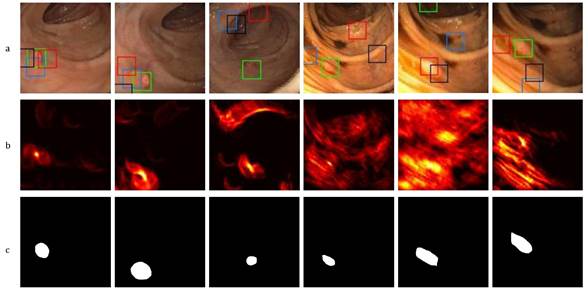
Hence, an additional rule is introduced to reinforce the selection of maximum pixel location and avoid false positive regions related to folds in the intestinal tract. In this case, the appearance similarity is measured by calculating the histogram ℎ𝑇𝑟 of the learning template 𝑇𝑟 with region histogram ℎ𝑖 that bounds the maximum region. This comparison is achieved by computing the cosine metric between the histograms of regions as
 , which allows weighting and rearranging regions. The selected pixels are then back-projected to the original frame in order to mark probable polyp regions.
Polyp location from Harris corner
A second strategy considered herein was to select a vote pixel that exposes a local maximum, with uniform and dominant relevant edges around the point, i.e., a corner in the attention map Γ𝑡(𝑚,𝑘). Following this hypothesis, a Harris corner detector is implemented to analyze the local importance distribution of each point along the spatial axis. Then, the region that bounds each point is represented by a structural tensor coded with a Hessian matrix. This matrix encodes the information of the edges along the spatial axis, and the corresponding eigenvalue (λ1,λ2) decomposition allows determining the importance of the voting pixel: λ1λ2−𝐾(λ1+λ2)2, with 𝐾 as a constant value. In this case, only if both eigenvalues are greater, the point is considered to be a relevant polyp location.
Dataset description
The evaluation of the proposed approach was carried out via public colonoscopies published within the framework of the Endoscopic Vision Challenge (EndoVis). Two different datasets were considered, which are described below:
The ASU-Mayo Clinic Colonoscopy Video Database (Tajbakhsh et al., 2016) has 20 short colonoscopy videos collected at the Department of Gastroenterology of Mayo Clinic, Arizona. This database reports only one polyp along the sequence. These videos have a high variation of luminance and sudden movements, which are common in colonoscopies. The training set has 3.799 frames, while the test set has 4.313 frames with polyps. These polyps were annotated by a gastroenterology expert and made available for training and test sets.
The CVC-Video Clinic DB database (Bernal et al., 2018; Angermann et al., 2017) has 18 short colonoscopy video sequences with more than 12.613 frames. These colonoscopies were captured during routine explorations at the Hospital Clinic of Barcelona, Spain. Only one polyp was reported in the videos, which was identified, localized, and segmented by clinic experts. Only videos from the training set that have their corresponding annotation and localization were considered because the main objective of this work is to evaluate the ability of the proposed approach to obtain the attention maps. This training set has around 10.000 frames with a polyp.
RESULTS
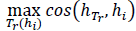
This proposed approach is dedicated to generating attention maps showing the location with the most probable abnormal masses during a colonoscopy procedure, with the purpose of detecting polyps. These attention maps are represented by a Γ𝑡 matrix resulting from the cumulative voting process, projecting a polyp representation table over each frame. Each position in Γ𝑡 represents the probable center of a polyp mass in the intestinal tract. Figure 4 describes typical colonoscopy frames (first row) with their respective attention polyp map (second row) and ground truth (third row). As observed in this Figure, colonoscopy images exhibit significant changes regarding appearance and illumination. Furthermore, the polyps report high variability with regard to shape and appearance, with close similarity to neighborhood intestinal folds. In the attention maps, yellow regions represent locations with a higher probability for the correspondence for polyps. Despite these challenges, the attention map focuses on abnormal masses. As observed, for frames without strong camera movements (first three columns), the computed attention map focuses on polyps, with some probabilities distributed to folds that share appearance and shape features. In the other three columns, strong illumination changes complicate the task of polyp localization, which also happens if the attention maps affect the distribution of localization energy. The Γ𝑡 attention maps were processed to search for regions that maximize the probability and generate alarms of probable polyps, thus supporting the task of localization during colonoscopy. As observed in Figure 4, the maximum regions found in the attention maps are back-projected to colonoscopy frames (color boxes). In descending order of importance, four regions are selected: the green box, the red box, the blue box, and the black box. It is important to note that the extracted regions belong to the polyps to a significant extent, even in attention maps showing noisy voting. In all cases, the polyp is located at one of the detected regions.
Source: Authors
Figure 4 Proposed polyp representation. a) Polyp detection using four maxima in a video sequence, b) the corresponding Γ t voting map, (c) the corresponding ground truth.
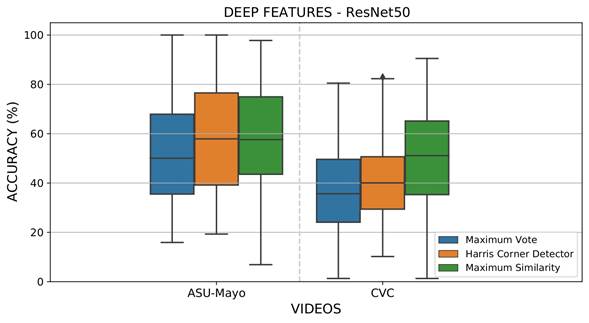
A first experiment was designed in order to evaluate the performance of the proposed approach regarding the most probable localization of polyps from the attention maps Γ𝑡 in each colonoscopy frame, where ω=1, and ϕ(𝑥) is the intensity value of each pixel in each of the extracted features. The most probable location was back-projected into the colonoscopy frame, following the maximum vote, similarity, and polyp location from corner Harris. An overlap measure was implemented to find correspondence with respect to a ground truth delineated by a gastroenterologist. For validation, if the location of the maximum back-projected point corresponds to any location inside the ground truth, a true positive detection is considered. Figure 5 summarizes the results obtained for each considered sequence in the CVC and ASU-Mayo datasets with the CNN ResNet50. This architecture achieved the best polyp representation in each of its activations. These plots illustrate the results for each sequence under different maximum strategies. As observed, polyp estimation is a challenging task; polyps may be captured in the attention map Γ 𝑡 but not necessarily as the most probable value. The Harris location rule achieved the best results, with an incidence average between 58 and 42% for the ASU-Mayo and CVC datasets, respectively.
Source: Authors
Figure 5 Results obtained from evaluating local maximum search operators to select the most probable polyp regions with deep feature extraction and the ResNet50 architecture
The same experiment was performed on other convolutional architectures, such as Inception-ResNet-V2 and DenseNet. The first one achieved average results of 49% for the ASU-Mayo dataset and 40% for CVC. On the other hand, the DenseNet201 architecture achieved results of 56% for ASU-Mayo and 42% for CVC with the Harris location rule. These results are lower than those obtained by ResNet50. Thus, residual activations achieved a better frame description than other architectures, especially where objects share close characteristics with the background. The same experiment was performed on other convolutional architectures, such as Inception-ResNet-V2 and DenseNet. The first one achieved average results of 49% for the ASU-Mayo dataset and 40% for CVC. On the other hand, the DenseNet201 architecture achieved results of 56% for ASU-Mayo and 42% for CVC with the Harris location rule. These results are lower than those obtained by ResNet50. Thus, residual activations achieved a better frame description than other architectures, especially where objects share close characteristics with the background. To compare the robustness of deep characterization, in this approach, RTables were also built from multiscale geometric features (MGF), defined as orientation gradients (α) , curvature (κ), and color channel intensity (𝑂1) for each pixel 𝑥. In this case, ϕ(𝑥) in the angle (α) is bounded between [-90, 90], the curvature (κ) is between [-1, 1], and the color channel (𝑂1) is the intensity value of each pixel. The cumulative weight ω is defined from the norm of the gradient ||∇𝐼𝑡|| for the angle (α). The Frobenius norm of the Hessian matrix is defined as
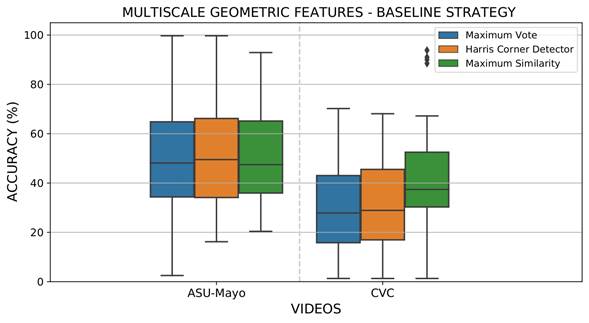
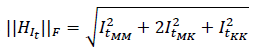 for the curvature (κ) and set at 1 for the color channel (𝑂1). These parameters were calculated for each pixel at different scales obtained by convolving images with a set of Gaussian filters σ𝑙. In this case, the best configuration was three scales σ𝑙={3,5,7}. Only MGF with a gradient norm greater than zero were considered in the representation. Figure 6 reports the results obtained via MGF for the recovery of the most probable polyp location. As expected, the sparse representation focus on salient points around polyps results in less representative areas for localization and detection during colonoscopy. MGF representation obtained 5 and 13% less than deep feature representation for the ASU-Mayo and CVC datasets, respectively. In this experiment, the Harris corner detector was again the best strategy to extract the most accurate regions from each voting map, reporting approximately 53 and 29% location scores for the ASU-Mayo and CVC datasets. In MGF, each boxplot showed a small variation attributed to low dimensional representation, with only three features, while deep features learned sixty-four activations. Thereupon, having a larger amount of data can lead to higher variance in detection.
Source: Authors
Figure 6 Results obtained from evaluating local maximum search operators to select the most probable polyp regions with the MGF extraction baseline strategy
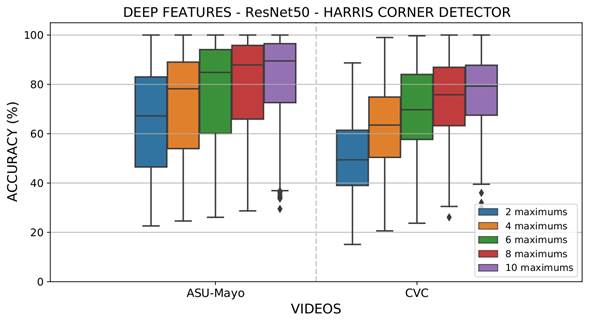
A second experiment was designated to select a reduced number of relevant points and then back-projecting them to obtain Θ regions into the colonoscopy frame. An iterative process was conducted to sort the regions that had maximum votes while avoiding local maxima. During the voting map, there was interest in false positive reduction at the moment of verifying that the polyp can be found among an estimated number of maximum regions. This experiment aimed to emulate the proposed approach as a polyp alert system that supports the identification and localization task during colonoscopies. The configuration of the selected maxima was Θ={2,4,6,8,10}. Figure 7 summarizes the results obtained using deep features in the CVC and ASU-Mayo datasets. As expected, the back-projection of a higher number of regions allows finding a polyp in the sequence correctly, the most relevant task during colonoscopy (with an average accuracy higher than 70%). In fact, for some videos, a perfect localization of the polyp was achieved in one of the selected regions of the salient map Γ𝑡.. Other regions were misdetected, but, in this approach, these maps are designed to focus the gastroenterologists' attention for them to describe or find some abnormal patterns in folds along the intestinal tract. On average, a total of four regions seems to be sufficient to bound a polyp from attention maps, with some differences for videos that report strong camera movements and artifacts during colonoscopy.
Source: Authors
Figure 7 Results evaluating maxima Θ in each attention map (Γ𝑡.) with the deep feature extraction strategy, the ResNet50 convolutional architecture, and the Harris corner detector
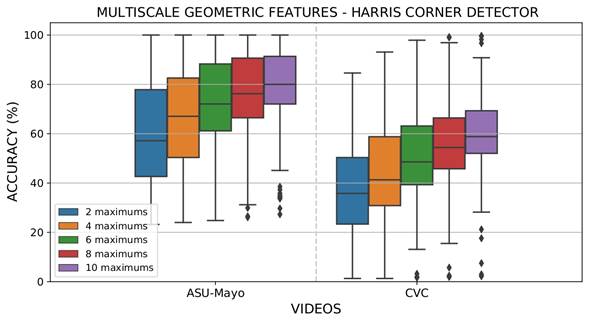
In the same line, using MGF to represent polyps, the back-projection of several salient points from attention maps Γ𝑡. to regions in colonoscopy sequences was obtained. Figure 8 shows the obtained results for the ASU-Mayo and CVC datasets. As expected, the estimation of most regions increases the probability to box polyp masses, thus showing the robust capability of attention maps to enhance points with features such as learned polyps. Nevertheless, this representation has a lower accuracy than deep features, and many of the videos may require major regions to properly detect abnormal masses. The main limitations appear in the CVC dataset, with an average accuracy of 55% using the ten regions over colonoscopies.
Source: Authors
Figure 8 Results obtained from evaluating different maxima Θ in each attention map (Γ𝑡) with the MGF extraction strategy and the Harris corner detector
The main contribution of the proposed approach lies in returning an attention map that explains the features associated with suspicious regions in clinical routine. The implementation of this strategy may suggest potential regions to experts and reduce the rate of polyp overlooking.
Some approaches in the state of the art deal with the polyp detection challenge. For instance, Shin et al. (2017) proposed a hand-crafted characterization that, together with a convolutional representation, allows deciding whether there is a polyp in a particular frame. This approach achieves an average accuracy of 86% with respect to an evaluation conducted in the ASU-Mayo dataset. Moreover, Akbari et al. (2018) proposed a convolutional representation with a specific kernel-based descriptor, reporting an accuracy of around 90,2% in the ASU-Mayo dataset. With the same dataset, the proposed approach reports an accuracy of 80% regarding polyp detection. Despite the fact that the proposed approach achieves a lower accuracy in such dataset, baseline approaches may be sensitive to variations in other colonoscopy sequences and datasets. Besides, the main interest of the proposed approach is to recover attention maps to support experts, aiming to reduce false positives caused by specular reflections or folds of the intestinal tract with polyp-like patterns.
CONCLUSIONS
According to the obtained results, it can be hypothesized that the recovered polyp attention maps support the detection and characterization of abnormal masses during colonoscopies, with the potential to eventually support the clinical procedure. From the attention maps, it is also possible to compute the maximum location and back-projected regions of the original colonoscopy in order to enhance the visualization of abnormal regions. although there are no polyps in many of these regions, this routine could mitigate the reported polyp misdetection, which is estimated to be around 4-12% (Tajbakhsh et al., 2016; Wang et al., 2013).
In the literature, most computational approaches have focused on detecting and identifying polyps during colonoscopies. Regarding detection, several works have independently modeled some primary features such as color, edges, and texture (Bernal et al., 2017). In addition, Figueiredo et al. (2019) proposed a threshold-based strategy to code polyp features such as geometry and color, which allows classifying frame regions using a standard support vector machine. These approaches are limited to representing the complexity and variability of polyps in a routine colonoscopy. In contrast, the proposed method achieves a robust representation using a bank of filters learned from a pretrained image representation. The main advantage of these filters is the band separation from nonlinear functions that can potentially better separate the primitive patterns of polyps. Recently, deep learning approaches have been used in polyp detection tasks. For example, Zheng et al. (2019) proposed a UNET architecture that, together with optical flow, shows promising results over a set of academic datasets. These representations learn a robust polyp representation but require an increased number of colonoscopy sequences in order to deal with new polyp observations, which are typical in clinical routine. Their approach reports a precision of 74%. Urban et al. (2018) use a transfer learning strategy to take advantage of the knowledge of natural images and tune final layers to learn polyp features. Similarly, the strategy proposed by Shin et al. (2018) was adjusted to a Faster R-CNN with an Inception-ResNet backbone net in order to detect common polyp regions, reporting a precision of 91% and a recall of 71%. Our study takes advantage of deep representations, albeit using some previously trained general layers, which are sufficient to represent image variability. From such a hypothesis, the proposed approach characterizes polyps according to each sequence, which makes it more flexible to implement in clinical scenarios. The result of the proposed approach shows a remarkable detection of polyps enclosed in more salient regions. For instance, by using ten regions, the approach achieves an accuracy of 79%. Moreover, the attention maps can focus on other regions with similar polyp patterns which could be of interest for gastroenterologists. In the literature, to the best of our knowledge, there are no related works on attention maps to support polyp detection. Therefore, the proposed approach may open the possibility to introduce an alternative tool to observe saliencies into colonoscopy procedures, which allows gastroenterologists provide better diagnosis. In the literature, some approaches (Shin et al., 2017, with an accuracy of 86%; and Akbari et al., 2018, with 90%) have been approximated for polyp detection, albeit including convolutional and hand-crafted features. These approaches achieve notable detection rates in the ASU-Mayo dataset, but the use of a dense appearance representation may be sensitive to generalization in other colonoscopy sequences. On the contrary, the most relevant contribution of the proposed approach is that attention maps may be useful to better cover suspicious masses associated with early polyps.
During the evaluation, several limitations of the proposed approach were reported with regard to dealing with the complex structure of the intestinal tract, sudden camera movements, and different visual irregularities corresponding to intestinal folds or artifacts such as specular reflection. Such observational alterations can contribute to enhancing false positive regions in attention maps. Future approaches could include the analysis and learning of specific polyp characteristics to achieve more precise maps. This application can be employed as an educational tool to train gastroenterologists (Hidalgo-Suárez et al., 2021), as well as to optimize processes during colonoscopies. In this sense, other knowledge fields have demonstrated the contribution of such intelligent networks to optimizing processes (Hernández et al., 2021) or using alternatives such as genetic algorithms (Giral-Ramírez et al., 2017). In addition, fully automatic polyp detection can be evaluated for test colonoscopies by learning a polyp atlas.

