


 Inglés (pdf)
 Articulo en XML
 Referencias del artículo
 Enviar articulo por email
 Citado por SciELO
  Citado por Google
  Similares en
SciELO
Similares en
SciELO  Similares en Google
 Permalink
Introduction
The control of infections is a frequent and serious problem worldwide; however, in intensive care units (ICUs), the picture is more discouraging because the frequency of sepsis exceeds 5-10 times that seen in other services, which seems to be associated with variables such as advanced age, patient comorbidities, immune status, need for invasive devices, exposure to broad-spectrum antibiotics, risk of infection by multidrugresistant microorganisms and progression to sepsis1-5, which in turn generates a longer hospital stay, increased costs to the health system, and increased mortality inside and outside the ICU3,4,6-10.
Sepsis affects approximately 1.7 million adults annually and contributes to more than 250,000 deaths in the United States alone11, corresponding to approximately 10% of the population admitted to the ICU and 10-20% of the hospital mortality rate12. For this reason, according to the campaign "Surviving sepsis", the empirical initiation of antibiotics during the first hour after diagnosis is required to reduce the preventable mortality associated with sepsis5,11,13.
The frequency of the inappropriate prescription of antimicrobials in the ICU, including those for empirical therapies and the overtreatment of colonizations, contamination and viral infections, has been estimated to range from 14 to 79%6,13-17. Studies that characterize microorganisms with usual profiles of resistance and errors in the selection, dosage, or duration of antibiotic treatment can contribute to solving this problem1-4. Inadequate use has promoted the selection of resistant microorganisms such as methicillin-resistant Staphylococcus aureus (MRSA) or vancomycin-resistant Enterococcus (VRE)4,18. This, associated with the low number of new antimicrobials, has generated a public health problem for which different strategies for the responsible use of antibiotics are being promoted2,4,9,14.
Given specific variations in each population, research should be conducted to determine the microbiological and treatment characteristics of infections present at the local and regional levels4,17-20. This research can guide antimicrobial stewardship programs (ASPs), which include coordinated interventions so that patients receive the appropriate antibiotic, minimizing the occurrence of adverse drug reactions and antimicrobial resistance and reducing costs21,22. European Union reports estimate, for example, costs close to 1.5 billion euros per year associated with microbial resistance23.
The Colombian Health System offers universal coverage through 2 affiliation regimes, one contributory or paid by employers and workers, and another subsidized by the state, which provides ICU care for any patient who requires it and allows the use of many antibiotics from different classes included in a Benefit Plan, with small exceptions for those with very high costs. For these reasons, the aim of this study was to determine the trends in the consumption of antibiotics and the costs of their use in a population of patients treated in different ICUs in Colombia between 2010 and 2017.
Materials and methods
This was an observational study of the trend for antibiotic consumption in 11 ICUs in 7 cities in Colombia (Barranquilla, Bogotá, Buga, Cali, Cartagena, Manizales, and Pereira) between January 2010 and December 2017. The data were collected from the information on drug use obtained systematically by the company responsible for dispensing medications to the ICU (Audifarma SA). Data from all hospitalizations of patients older than 18 years of either sex who had received antibiotic therapy during the time period studied were included. Patients with incomplete information were excluded. The study included the dispensing records of antibiotics effectively administered to patients. The ICUs included were mixed units with patients with different pathologies of an infectious, cardiovascular, and neurological nature among others. A database was designed to collate the following groups of variables:
Sociodemographic: age and sex;
Pharmacological: ß-lactams (and their combinations with ß-lactamase inhibitors), cephalosporins, carbapenems, aminoglycosides, tetracyclines, macrolides, fluoroquinolones, vancomycin, linezolid, antimycotics (amphotericin B and echinocandins) and other antibacterial agents (Table 1). In total, 47 different medications were sought, of which 35 were antibiotics, 7 were antifungals, and 5 were antituberculosis drugs. The defined daily dose (DDD) was expressed as a technical unit of measurement, expressed in DDD per 100 bed-days (DBD), in accordance with the recommendation of the World Health Organization (WHO), as the standard to conduct pharmaco-epidemiological studies. The variation in the number of beds per year was considered in the analysis. Most of the antibiotics analyzed were included in their intravenous preparations, except for linezolid, 5-flucytosine and those that were available only in oral preparations (doxycycline, isoniazid, pyrazinamide, ethambutol, rifampicin, and ethionamide). The consumption of antibiotics was considered part of a different therapy when the time interval between each dispensation was 48 hours or more for the same patient; and
Overall costs of dispensed medications: The absolute cost of dispensing antimicrobials for each year was calculated from the perspective of the third-party payer (in this case, the insurer responsible for the health of the patients). For the conversion of monthly and annual spending to dollars, historical information on the representative market rate on the last business day of each month and year published by the Bank of the Republic of Colombia was used. The cost of the main drugs per day of treatment per patient in each year was calculated.
Table 1 Trends in antibiotic prescriptions for patients treated in 11 ICUs in Colombia, 2010-2017
| Variable | 2010 | 2011 | 2012 | 2013 | 2014 | 2015 | 2016 | 2017 | Total |
|---|---|---|---|---|---|---|---|---|---|
| Patients -n | 2964 | 3368 | 3635 | 3790 | 4330 | 4593 | 5329 | 5641 | 31886 |
| Number of therapies -n * | 3742 | 4006 | 4421 | 4654 | 5321 | 5753 | 6650 | 7023 | 41224 |
| Dispensations -n | 23070 | 26499 | 28298 | 29548 | 33972 | 36104 | 44293 | 43567 | 265352 |
| Dispensations / therapy -mean | 6.2 | 6.6 | 6.4 | 6.3 | 6.4 | 6.3 | 6.7 | 6.2 | 6.4 |
| Antibiotics / therapy -mean | 1.9 | 1.8 | 1.8 | 1.8 | 1.8 | 1.8 | 1.8 | 1.8 | 1.8 |
| Days / therapy - mean | 4.0 | 4.4 | 4.3 | 4.3 | 4.2 | 4.1 | 4.4 | 4.0 | 4.2 |
| Monotherapy (%) | 51.3 | 53.8 | 54.6 | 54.9 | 54.4 | 53.9 | 52.1 | 51.7 | 53.2 |
| Beds -n | 108 | 126 | 137 | 170 | 170 | 190 | 195 | 220 | NA |
| Medicine | % use per therapy | Mean % | |||||||
| Penicillins, in combination + | 38.3 | 43.6 | 44.5 | 50.7 | 48.3 | 40.7 | 42.4 | 43.0 | 43.9 |
| Piperacillin-tazobactam | 22.2 | 23.6 | 24.4 | 28.0 | 28.8 | 22.2 | 24.7 | 28.0 | 25.2 |
| Ampicillin sulbactam | 18.5 | 23.4 | 23.6 | 26.1 | 22.9 | 21.4 | 20.5 | 18.2 | 21.8 |
| Beta-lactam antibacterials, penicillins | 5.7 | 3.6 | 4.0 | 2.4 | 3.1 | 2.8 | 3.0 | 3.5 | 3.5 |
| Oxacillin | 4.1 | 2.1 | 2.6 | 1.5 | 1.5 | 1.5 | 1.5 | 2.1 | 2.1 |
| Ampicillin | 1.0 | 1.1 | 1.0 | 0.7 | 1.2 | 1.0 | 1.1 | 1.1 | 1.0 |
| Penicillin | 0.6 | 0.4 | 0.3 | 0.2 | 0.3 | 0.2 | 0.4 | 0.3 | 0.3 |
| Benzathine penicillin | 0.0 | 0.0 | 0.2 | 0.2 | 0.1 | 0.1 | 0.1 | 0.1 | 0.1 |
| Cephalosporins | 37.9 | 35.8 | 35.5 | 33.2 | 34.5 | 40.7 | 39.4 | 38.4 | 36.9 |
| Cefazolin | 16.1 | 17.0 | 18.8 | 15.9 | 15.7 | 18.0 | 17.4 | 19.4 | 17.3 |
| Cefepime | 5.4 | 4.6 | 5.4 | 6.2 | 8.1 | 13.7 | 14.4 | 12.1 | 8.7 |
| Ceftriaxone | 10.8 | 8.9 | 6.6 | 6.0 | 7.0 | 7.5 | 7.2 | 6.6 | 7.6 |
| Cephalothin | 6.7 | 6.1 | 5.6 | 6.1 | 4.5 | 3.2 | 2.0 | 2.1 | 4.6 |
| Cefuroxime | 0.1 | 0.0 | 0.0 | 0.1 | 0.5 | 0.1 | 0.2 | 0.1 | 0.1 |
| Cefoperazone | 0.4 | 0.1 | 0.1 | 0.0 | 0.0 | 0.0 | 0.0 | 0.1 | 0.1 |
| Ceftaroline | 0.0 | 0.0 | 0.0 | 0.0 | 0.1 | 0.2 | 0.2 | 0.0 | 0.1 |
| Ceftazidime | 0.1 | 0.0 | 0.0 | 0.0 | 0.0 | 0.0 | 0.0 | 0.0 | 0.0 |
| Cefotaxime | 0.0 | 0.0 | 0.0 | 0.0 | 0.1 | 0.0 | 0.0 | 0.0 | 0.0 |
| Carbapenems | 22.3 | 22.7 | 21.9 | 20.1 | 19.9 | 22.2 | 23.3 | 22.4 | 21.8 |
| Meropenem | 18.8 | 17.6 | 19.2 | 17.2 | 17.1 | 19.7 | 21.5 | 21.5 | 19.1 |
| Ertapenem | 2.8 | 5.4 | 3.1 | 3.0 | 3.0 | 2.6 | 1.8 | 1.0 | 2.8 |
| Imipenem | 2.1 | 1.0 | 0.4 | 0.3 | 0.3 | 0.2 | 0.1 | 0.1 | 0.6 |
| Doripenem | 0.0 | 1.0 | 0.3 | 0.8 | 0.8 | 0.9 | 0.8 | 0.3 | 0.6 |
| Aminoglycoside antibacterials | 8.0 | 8.4 | 5.0 | 5.1 | 5.6 | 4.9 | 4.2 | 4.0 | 5.6 |
| Amikacin | 6.3 | 6.8 | 3.9 | 3.8 | 3.7 | 3.7 | 3.0 | 3.1 | 4.3 |
| Gentamicin | 1.8 | 1.7 | 1.1 | 1.3 | 1.9 | 1.2 | 1.3 | 0.9 | 1.4 |
| Tetracyclines | 1.5 | 1.3 | 0.9 | 1.0 | 1.2 | 1.1 | 1.1 | 0.9 | 1.1 |
| Tigecycline | 0.7 | 0.7 | 0.6 | 0.7 | 0.7 | 0.7 | 0.4 | 0.3 | 0.6 |
| Doxycycline | 0.8 | 0.5 | 0.3 | 0.3 | 0.5 | 0.4 | 0.6 | 0.6 | 0.5 |
| Macrolides-Clarithromycin | 10.0 | 10.8 | 11.3 | 10.3 | 10.7 | 9.1 | 8.6 | 9.9 | 10.1 |
| Antimycotics for systemic use | 8.4 | 7.3 | 7.2 | 7.8 | 7.8 | 6.2 | 7.3 | 6.4 | 7.3 |
| Fluconazole | 7.5 | 6.2 | 5.3 | 5.8 | 5.3 | 4.3 | 4.8 | 4.3 | 5.5 |
| Caspofungin | 0.4 | 0.4 | 1.9 | 2.1 | 2.5 | 2.0 | 2.6 | 2.5 | 1.8 |
| Amphotericin B | 0.9 | 0.6 | 0.4 | 0.4 | 0.5 | 0.3 | 0.5 | 0.3 | 0.5 |
| Anidulafungin | 0.1 | 0.6 | 0.2 | 0.1 | 0.3 | 0.1 | 0.0 | 0.1 | 0.2 |
| Voriconazole | 0.2 | 0.1 | 0.1 | 0.0 | 0.2 | 0.0 | 0.0 | 0.0 | 0.1 |
| 5-Flucytosine | 0.0 | 0.0 | 0.0 | 0.0 | 0.0 | 0.0 | 0.1 | 0.1 | 0.0 |
| Fluoroquinolones | 7.2 | 5.2 | 2.8 | 2.6 | 2.1 | 1.7 | 1.9 | 1.8 | 3.2 |
| Ciprofloxacin | 6.9 | 3.8 | 2.5 | 2.5 | 1.7 | 1.5 | 1.4 | 1.6 | 2.7 |
| Moxifloxacin | 0.1 | 1.2 | 0.2 | 0.0 | 0.3 | 0.1 | 0.3 | 0.2 | 0.3 |
| Levofloxacin | 0.3 | 0.2 | 0.1 | 0.1 | 0.0 | 0.1 | 0.2 | 0.0 | 0.1 |
| Vancomycin | 22.0 | 19.3 | 16.4 | 17.4 | 18.5 | 23.3 | 26.9 | 27.2 | 21.4 |
| Linezolid | 2.5 | 4.5 | 4.9 | 5.1 | 4.5 | 3.6 | 2.8 | 1.7 | 3.7 |
| Other antibacterials | 15.8 | 13.1 | 13.5 | 13.1 | 13.5 | 13.6 | 12.1 | 13.1 | 13.5 |
| Metronidazole | 6.9 | 6.0 | 6.4 | 6.3 | 6.1 | 5.6 | 4.9 | 5.4 | 6.0 |
| Clindamycin | 4.7 | 4.3 | 4.3 | 4.0 | 4.3 | 4.4 | 3.7 | 3.9 | 4.2 |
| Trimethoprim-sulfamethoxazole | 1.9 | 1.8 | 1.5 | 1.6 | 1.7 | 1.4 | 1.4 | 1.4 | 1.6 |
| Aztreonam | 1.4 | 0.9 | 0.8 | 0.6 | 0.6 | 0.7 | 1.2 | 1.8 | 1.0 |
| Colistin | 0.4 | 0.3 | 0.8 | 0.6 | 0.4 | 0.9 | 0.4 | 0.5 | 0.5 |
| Polymyxin b | 1.5 | 0.2 | 0.0 | 0.1 | 0.3 | 0.7 | 0.7 | 0.5 | 0.5 |
| Daptomycin | 0.0 | 0.3 | 0.3 | 0.6 | 0.3 | 0.6 | 0.3 | 0.2 | 0.3 |
| Rifampicin | 0.3 | 0.6 | 0.5 | 0.3 | 0.2 | 0.2 | 0.2 | 0.3 | 0.3 |
| Chloramphenicol | 0.1 | 0.0 | 0.0 | 0.0 | 0.0 | 0.0 | 0.0 | 0.1 | 0.0 |
| Ethambutol | 0.0 | 0.0 | 0.0 | 0.0 | 0.0 | 0.0 | 0.0 | 0.0 | 0.0 |
| Isoniazid | 0.0 | 0.0 | 0.0 | 0.0 | 0.1 | 0.0 | 0.0 | 0.0 | 0.0 |
| Ethionamide | 0.0 | 0.0 | 0.0 | 0.0 | 0.0 | 0.0 | 0.0 | 0.0 | 0.0 |
For the data analyses, the statistical package R Studio 1.0.136 for Windows was used. Descriptive statistics, such as the mean, median, standard deviation, and minimum and maximum values are used for continuous variables, and percentages are used for categorical variables. An average occupancy of 87% was used for the calculation of DBD and costs, based on data reported by the ICU. Linear logistic regression was used to measure the trend over time for antibiotic consumption, expressed as DBD. The DBD for each antibiotic was used as an outcome variable, and the year of measurement was included in the model as a numerical variable so that the average beta coefficient of change for each year of study could be obtained.
This study was approved by the Bioethics Committee of the Universidad Tecnológica de Pereira as "research without risk", based on the 1993 resolution No. 8430 of the Colombian Ministry of Health. The principles of confidentiality established in the Declaration of Helsinki were followed. The authors encrypted the database, giving each patient an alternative identification number.
Results
During the study period, a total of 31,886 patients were treated with antimicrobials in the mixed ICUs of eleven high complexity hospitals in seven Colombian cities; these patients received 41,224 therapies, with a total of 265,352 drug dispensations. On average, these patients represented 45.3% of the total ICU patients attended (n=70,380) during the study time. The mean age of the patients treated with antimicrobials was 60.3 ± 19.8 years, and 50.8% (n=16,215) were men. The average duration of each therapy was 4.2 ± 4.7 days, with a median of 2 days (interquartile range-IQR: 2-6 days) and an average of 6.4 drug dispensations per therapy. The ICUs studied had 16.2 ± 7 beds in average. The frequency of prescriptions for each of the antibiotics in the ICU throughout the 8 years studied can be observed in table 1. The antibiotics with the highest proportion of prescriptions, on average, during the study period were piperacillin-tazobactam (25.2%), ampicillin-sulbactam (21.8%) and vancomycin (21.4%).
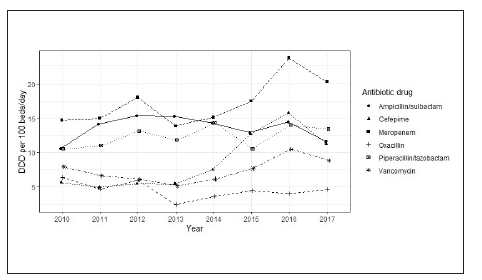
The trends for DBD over time for the most prescribed antibiotics are shown in Table 2. For 2017, the most commonly used drugs were meropenem (20.18 DBD), piperacillintazobactam (13.44 DBD) and ampicillin-sulbactam (11.67 DBD). At the time of observation, the antibiotics with the greatest increase in use were cefepime (increase of 5.56 DBD), meropenem (5.45 DBD) and piperacillin-tazobactam (2.90 DBD). The changes in DBD over time are shown in Figure 1.
Table 2 Defined daily dose per 100 bed-days for antibiotics prescribed to patients treated in 11 ICUs in Colombia, 2010-2017.
| Drug | 2010 | 2011 | 2012 | 2013 | 2014 | 2015 | 2016 | 2017 | Mean | Difference* | ß | p value |
|---|---|---|---|---|---|---|---|---|---|---|---|---|
| Amikacin | 1.74 | 1.92 | 1.12 | 0.92 | 0.93 | 0.97 | 0.77 | 0.75 | 1.14 | -1.00 | -0.16 | 0.006 |
| Ampicillin | 1.17 | 1.53 | 2.07 | 1.40 | 1.95 | 1.71 | 1.83 | 1.91 | 1.70 | 0.74 | 0.07 | 0.126 |
| Ampicillin sulbactam | 10.58 | 14.19 | 15.40 | 15.30 | 14.33 | 12.93 | 14.50 | 11.67 | 13.61 | 1.10 | 0.01 | 0.975 |
| Cephalothin | 1.18 | 0.88 | 0.88 | 1.05 | 0.68 | 0.46 | 0.34 | 0.28 | 0.72 | -0.90 | -0.12 | <0.001 |
| Cefazolin | 3.51 | 3.45 | 4.18 | 3.30 | 4.49 | 4.84 | 5.69 | 5.73 | 4.40 | 2.21 | 0.35 | 0.002 |
| Cefepime | 5.69 | 4.91 | 5.47 | 5.46 | 7.50 | 12.69 | 15.80 | 11.25 | 8.60 | 5.56 | 1.39 | 0.011 |
| Ceftriaxone | 4.59 | 3.51 | 2.87 | 2.25 | 2.75 | 2.95 | 3.04 | 2.91 | 3.11 | -1.68 | -0.15 | 0.147 |
| Ciprofloxacin | 3.32 | 1.66 | 1.34 | 1.32 | 1.09 | 0.99 | 0.90 | 0.83 | 1.43 | -2.49 | -0.27 | 0.015 |
| Clarithromycin | 4.85 | 4.74 | 5.24 | 3.82 | 4.45 | 3.66 | 3.77 | 3.48 | 4.25 | -1.37 | -0.22 | 0.011 |
| Clindamycin | 1.86 | 1.65 | 1.80 | 1.36 | 1.59 | 1.74 | 1.73 | 1.81 | 1.69 | -0.06 | -0.01 | 0.983 |
| Doripenem | 0.00 | 0.43 | 0.23 | 0.35 | 0.62 | 0.59 | 0.67 | 0.67 | 0.41 | 0.67 | 0.02 | 0.662 |
| Ertapenem | 1.36 | 2.68 | 1.36 | 1.03 | 1.14 | 0.92 | 0.75 | 0.42 | 1.21 | -0.95 | -0.21 | 0.030 |
| Fluconazole | 8.43 | 7.32 | 7.88 | 5.91 | 6.34 | 5.26 | 6.39 | 5.07 | 6.57 | -3.36 | -4.21 | 0.029 |
| Imipenem | 1.05 | 0.60 | 0.32 | 0.17 | 0.07 | 0.02 | 0.04 | 0.04 | 0.29 | -1.01 | -0.15 | 0.006 |
| Linezolid | 1.31 | 1.91 | 2.15 | 2.03 | 2.08 | 1.46 | 1.60 | 0.83 | 1.67 | -0.48 | -0.08 | 0.273 |
| Meropenem | 14.73 | 14.99 | 18.04 | 13.90 | 15.14 | 17.52 | 23.64 | 20.18 | 17.27 | 5.45 | 0.96 | 0.047 |
| Metronidazole | 2.78 | 2.48 | 2.61 | 2.33 | 2.65 | 2.24 | 2.12 | 1.93 | 2.39 | -0.86 | -0.1 | 0.006 |
| Oxacillin | 6.39 | 4.73 | 6.03 | 2.44 | 3.63 | 4.49 | 4.01 | 4.63 | 4.54 | -1.75 | -0.22 | 0.270 |
| Piperacillin-tazobactam | 10.54 | 11.02 | 13.17 | 11.84 | 14.35 | 10.57 | 14.02 | 13.44 | 12.37 | 2.90 | 0.36 | 0.149 |
| Vancomycin | 7.96 | 6.65 | 6.13 | 5.16 | 6.14 | 7.69 | 10.50 | 8.88 | 7.39 | 0.91 | 0.37 | 0.179 |
Difference in the defined daily dose per 100 beds / day between 2017 and 2010
Figure 1 Defined daily dose per 100 bed-days for the main antimicrobials used in the studied ICUs, Colombia, 2010-2017.
Monotherapy versus combination therapy
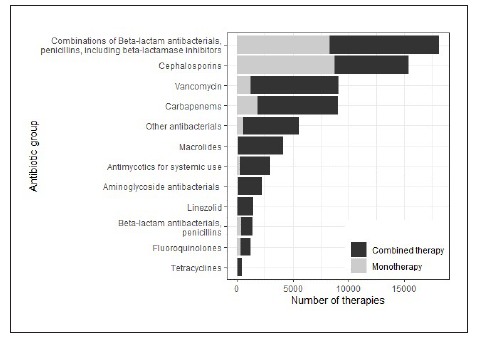
Of the total therapies recorded in the study, 21,951 (53.2%) were with one antibiotic, and 19,273 (46.8%) were combination therapy. The use of 2 antibiotics was identified in 11,673 (28.3%) therapies, the use of 3 was identified in 4,157 (10.1%), the use of 4 was identified in 1,966 (4.8%), and the use of 5 or more was identified in 1,477 (3.7%). The antibiotics that were most frequently used in monotherapy were cefazolin (n=5,716; 79.0%), cephalothin (n=1,326; 76.4%), ampicillin/ sulbactam (n=4,460; 50.0%) and piperacillin/tazobactam (n=3,837, 36.6%). The most frequently used combinations were piperacillin/tazobactam with vancomycin (n=1,751;11.0% of the combined therapies), piperacillin/tazobactam with clarithromycin (n=1,418; 8.9%) and ampicillin/sulbactam with clarithromycin (n = 1,371; 8.6%). Figure 2 shows the monotherapy/combination therapy relationship for the main groups of antibiotics.
Economic analysis
In the 8 years analyzed, a total of US $ 8,932,588 was billed for antimicrobials; 41.3% of the expenditure corresponded to meropenem (US $ 3,686,583), 25.8% to piperacillin/tazobactam (US $ 2,300,229), 8.9% to linezolid (US $ 795,501), 7.0% to clarithromycin (US $ 622,955), 6.4% to ampicillin/sulbactam (US $ 574,420.87) and the remaining 7.2% to other antibiotics. Table 3 provides the average costs per day of treatment for the main antibiotics studied. The global average cost per day of antibiotics decreased over the years, with a variation greater than 50% when comparing the costs per day between 2017 and 2010.
Table 3 Cost analysis (USD) per day of treatment for antibiotics in 11 ICUs in Colombia, 2010-2017.
| Antibiotic | 2010 | 2011 | 2012 | 2013 | 2014 | 2015 | 2016 | 2017 | % variation 2017-2010 |
|---|---|---|---|---|---|---|---|---|---|
| Amikacin | 1.04 | 1.03 | 1.05 | 0.89 | 0.73 | 0.54 | 0.49 | 0.48 | -54.0 |
| Ampicillin | 4.57 | 5.35 | 5.22 | 5.71 | 5.19 | 3.36 | 2.91 | 3.10 | -32.3 |
| Ampicillin sulbactam | 63.44 | 21.82 | 20.03 | 24.48 | 18.54 | 12.38 | 11.26 | 11.87 | -81.3 |
| Cefazolin | 4.62 | 3.70 | 3.77 | 4.36 | 4.80 | 3.06 | 2.87 | 2.95 | -36.2 |
| Cefepime | 61.24 | 41.39 | 29.99 | 33.98 | 20.84 | 21.96 | 16.26 | 28.43 | -53.6 |
| Ceftriaxone | 7.91 | 8.74 | 9.94 | 10.39 | 10.23 | 6.62 | 4.85 | 4.14 | -47.7 |
| Ciprofloxacin | 12.00 | 8.39 | 8.58 | 7.58 | 7.01 | 4.83 | 4.52 | 4.12 | -65.7 |
| Clarithromycin | 63.30 | 59.67 | 59.67 | 49.88 | 46.07 | 28.47 | 25.74 | 22.66 | -64.2 |
| Clindamycin | 2.95 | 2.87 | 2.77 | 2.54 | 2.25 | 1.77 | 1.55 | 1.26 | -57.2 |
| Linezolid | 248.71 | 147.14 | 152.21 | 152.92 | 134.81 | 111.62 | 89.18 | 83.40 | -66.5 |
| Meropenem | 153.79 | 189.76 | 177.40 | 180.89 | 87.16 | 69.61 | 55.96 | 43.32 | -71.8 |
| Oxacillin | 6.78 | 7.13 | 7.34 | 6.77 | 6.12 | 4.69 | 4.09 | 3.89 | -42.6 |
| Piperacillin / tazobactam | 95.41 | 84.36 | 91.87 | 87.47 | 64.91 | 40.15 | 36.45 | 38.01 | -60.2 |
| Vancomycin | 20.22 | 22.89 | 23.23 | 23.07 | 21.28 | 15.49 | 15.01 | 13.37 | -33.9 |
| Mean | 53.28 | 43.16 | 42.36 | 42.21 | 30.71 | 23.18 | 19.37 | 18.64 | -65.0 |
| Median | 16.11 | 15.28 | 14.99 | 16.73 | 14.38 | 9.50 | 8.05 | 8.00 | -50.3 |
Discussion
This study describes the trends for the use of antibiotics and the costs associated with their use in 11 ICUs in 7 Colombian cities from 2010 to 2017. The trends for the number of drug dispensations per therapy, antibiotics per therapy, and days per therapy did not present significant variations, but changes were found in the costs of antibiotics per patient day, which were reduced, and in the frequency of use of certain antibiotics. This analysis indicates that the most prescribed antimicrobials over time were piperacillin-tazobactam, ampicillin-sulbactam, vancomycin, meropenem and cefazolin. This finding differs from reports from other continents, such as Asia, where the most prescribed antimicrobials were cefazolin and carbapenems17, and Africa, where the most prescribed antimicrobials were third-generation cephalosporins, nitroimidazoles and second-generation quinolones24. These variations can be explained by the epidemiological characteristics of each population and by different profiles of antibiotic resistance4,6. The decrease in the prescription of some ß-lactams could be explained by reports of resistance; the decrease in aminoglycosides could be related to their high toxicity potential; and the decrease in fluoroquinolones could be due to their potential for the selection of resistant germs, especially Pseudomonas aeruginosa6 , 7 , 17.
Regarding DBD, a significant increase in the use of meropenem, cefepime and cefazolin was observed, while the use of aminoglycosides and other carbapenems showed a considerable decrease. The increases in DBD can be explained by a tendency to optimize antibiotic therapies with doses higher than the minimum inhibitory concentrations, the decrease in dosage intervals, the prolongation of treatment times or the use of continuous infusions, as is usually done with ß-lactams, fluoroquinolones and vancomycin16,25. The increase in the prescription of antimicrobials such as cefepime, meropenem or piperacillin/tazobactam may correspond to their inclusion in international guidelines and protocols as first-line regimens for patients with septic shock6,7,17. Nearly half of patients received combination therapy, which, in the context of the ICU, does not appear to have a significant effect on mortality10.
The proportion of antifungals decreased, in particular due to fewer prescriptions for fluconazole despite a slight increase in the use of caspofungin. Patients with HIV, patients with neoplasms and patients requiring ICU management have a high risk of fungal infections; however, the first 2 groups are often treated in specialized institutions, which could explain the slight decrease in antifungal use26,27. The incidence of fungal infections in ICU patients is between 3.5 and 6 per 1,000 admissions28. The addition of antimycotics should be considered as part of antimicrobial treatment when the escalation of the antibiotic scheme does not improve the clinical state of the patient15.
The cost of all antibiotics progressively decreased, largely due to the continuous changes in drug price regulation policies established by the Ministry of Health of Colombia to regulate and control the market and thus increase accessibility to treatments29,30. On the other hand, changes in consumption patterns could be explained by conditions not included in this study, such as microbiological and epidemiological profiles of infectious processes in patients in ICUs in Colombia, and changes in clinical practice guidelines, among other reasons31-33.This study has limitations inherent to the observational design based on a dispensing database and not on clinical records; therefore, it was not possible to review the indications for which each of the antimicrobials were prescribed, the comorbidities of the patients, or the clinical outcomes. Furthermore, a therapy was considered different when more than 48 hours elapsed between antimicrobial dispensations. It was also not possible to evaluate whether antimicrobial use was adjusted because of clinical variables or the results of antibiograms and cultures. The information analyzed corresponds to a convenience sample. The analysis by city was not described. Regarding the cost analysis, an important limitation corresponds to the hidden costs, which were not considered for the present study.
Nevertheless, the present study described the trends of antibiotic use in Colombian ICUs across 8 years. Some of the aspects to be highlighted include a detailed report of the use of the medications over time for a specific healthcare service, and on an individualized basis for each patient, which is valuable information to establish pharmacovigilance policies in antibiotic therapy. Multicenter studies that include clinical, paraclinical and microbiological variables are recommended.
In conclusion, based on the prescription trends found in this study, in general, the use of antibiotics in this population is adequate, with the use of the expected medications for care in an ICU. An increase over the years studied in the consumption of piperacillin-tazobactam, meropenem and vancomycin was evident, although the number of antibiotics and days of therapy remained stable. Policies for regulating the prices of drugs, particularly antibiotics, showed favorable results in terms of reducing average costs per day of treatment. Pharmacoepidemiology and pharmacovigilance studies are a source of information necessary for the development and implementation of programs for the appropriate use of antibiotics; therefore, the results of this study can be used by health personnel to make decisions about the prescription of antibiotics in the ICU.

