


Servicios Personalizados
Revista
Articulo
 Inglés (pdf)
 Articulo en XML
 Referencias del artículo
 Enviar articulo por email
Indicadores
-
 Citado por SciELO
 -
 Accesos
Links relacionados
-
 Citado por Google
 -
 Similares en
SciELO
Similares en
SciELO -
 Similares en Google
Compartir

 Permalink
Revista de Salud Pública
versión impresa ISSN 0124-0064
Rev. salud pública v.10 n.5 Bogotá nov./dic. 2008
Artículos Originales/Original Articles
Building a New Predictor for Multiple Linear Regression Technique-based Corrective Maintenance Turnaround Time
Estimación de predictor para el tiempo de parada del mantenimiento correctivo usando regresión lineal múltiple
Antonio M. Cruz1, Cameron Barr2 and Elsa Puñales-Pozo3
1. Escuela de Medicina, Universidad del Rosario. Bogota D.C., Colombia. Antonio.cruz43.@urosario.edu.co.
2. Freelance writer cameronbarr@rogers.com
3. Clinical Engineering Department at "Cira García" Hospital, Havana, Cuba.
Received 13th March 2008/Sent for Modification 27th September 2008/Accepted 3 November 2008
ABSTRACT
Objectives This research's main goals were to build a predictor for a turnaround time (TAT) indicator for estimating its values and use a numerical clustering technique for finding possible causes of undesirable TAT values.
Materials and methods The following stages were used: domain understanding, data characterisation and sample reduction and insight characterisation. Building the TAT indicator multiple linear regression predictor and clustering techniques were used for improving corrective maintenance task efficiency in a clinical engineering department (CED). The indicator being studied was turnaround time (TAT).
Results Multiple linear regression was used for building a predictive TAT value model. The variables contributing to such model were clinical engineering department response time (CErt, 0.415 positive coefficient), stock service response time (Stockrt, 0.734 positive coefficient), priority level (0.21 positive coefficient) and service time (0.06 positive coefficient). The regression process showed heavy reliance on Stockrt, CErt and priority, in that order. Clustering techniques revealed the main causes of high TAT values.
Conclusions This examination has provided a means for analysing current technical service quality and effectiveness. In doing so, it has demonstrated a process for identifying areas and methods of improvement and a model against which to analyse these methods' effectiveness.
Key Words: Maintenance, regression analysis, biomedical technology, decision support system, management (source: MeSH, NLM).
RESUMEN
Objetivos Construir un predictor que permita estimar los valores de tiempo de cambio de estado (del ingles TAT) y usar técnicas de conglomerados para encontrar las posibles causas de los valores no deseados de TAT.
Materiales y Métodos Para llevar a cabo esta investigación se realizaron los siguientes pasos: Selección, reducción y caracterización de los datos contenidos en la base de datos bajo estudio y Construcción del Indicador bajo estudio. El indicador bajo estudio fue el tiempo de cambio de estado (por sus siglas en inglés TAT).
Resultados Se construyó el nuevo predictor para TAT basado en técnicas de regresión múltiple. Las variables que más contribuyeron a la construcción del nuevo predictor fueron tiempo de respuesta del departamento de IC (CErt), con un coeficiente 0,415 positivo, tiempo de respuesta de entrega de las piezas de repuesto (Stockrt), con un coeficiente de 0,734 positivo, nivel de prioridad del equipamiento (RL), con un coeficiente de 0,25 positivo, y tiempo de servicio de mantenimiento (ST), con un coeficiente de 0.06 positivo. La tecnica de regresión aplicada demostró una fuerte dependencia de las variables Stockrt, CErt, y PL en este orden. Las técnicas de conglomerados encontró las principales causas por las cuales el valor de TAT era demasiado alto.
Conclusiones. El estudio demostró que es posible aplicar técnicas de minerías de datos para mejorar la eficiencia de las actividades que se desarrollan en los departamentos de Ingeniería de los hospitales
Palabras Clave: Mantenimiento, estadística y datos numéricos, gerencia (fuente: DeCS, BIREME).
Multiple linear regression and clustering techniques are tools which have been extensively applied in several financial, technical and biomedical areas where vast quantities of data are produced and stored (1).These techniques have shown promise in analysing the performance of departments responsible for and related to hospital equipment maintenance and identifying and improving areas of concern.
This research is focused on analysing the quality and effectiveness of corrective (non-scheduled) maintenance tasks in the health care environment and improving these processes. This research's two main objectives were:
1. Building a turnaround time (TAT) predictor for estimating its value; and
2. Using a numerical clustering technique for finding possible causes of undesirable TAT values.
The sequential minimal optimisation (SMO) algorithm was selected for building the TAT predictor (2). Mathematical support for the SMO algorithm was based on support vector machine (SVM) theory. The SVM algorithm is a nonlinear generalisation of the generalised portrait algorithm developed in Russia in the 1960s (3). SMO algorithms are fast (reported to be several orders of magnitude faster, up to a factor of 1,000), exhibit better scaling properties and are easily implemented (2). SMO algorithms have also been demonstrated to be valuable for several real-world applications. For example, they have been applied in many areas including cost-benefit models for regression test selection, test suite reduction, test case prioritisation, time series prediction applications, scheduling jobs and equipment maintenance tasks and power supply and stock management problems. An interesting stock management study compared various learning algorithms (LBR, WR, Ibk, Kstar, linear regression (4-6) with the SMO algorithm in different scenarios (six experiments). It showed that the SMO algorithm was the best in four cases and the second best in the two remaining cases.
MATERIALS AND METHODS
This research followed the stages detailed below:
1. Domain understanding, data characterisation and sample reduction;
2. Insight characterisation; and
3. Building the TAT indicator predictor.
Domain understanding, data characterisation and sample reduction
The data sample for this study was taken from a hospital inventory having 749 pieces of medical equipment located in 25 cost centres. This equipment was classified into 400 different models within the inventory and had been acquired from 180 different vendors and/or original equipment manufacturers (OEM). A total of 980 corrective work orders were analysed covering 2002-2006; all this data was maintained by means of SMACOR (a computerised maintenance management system-CMMS).
A problematic overall value was readily identified and required attention when performing a preliminary reduction of this data. Average TAT for corrective maintenance was 5,42 days during the period being analysed (2002-2006) for all equipment type groups. TAT affects medical equipment availability (6) and, consequently, the waiting times of patients in the health care system. A TAT of more than one work week was deemed unacceptable. So, a specific focus for the present endeavour was identified from such initial observation because TAT is a main measurement of a clinical engineering department's (CED) performance.
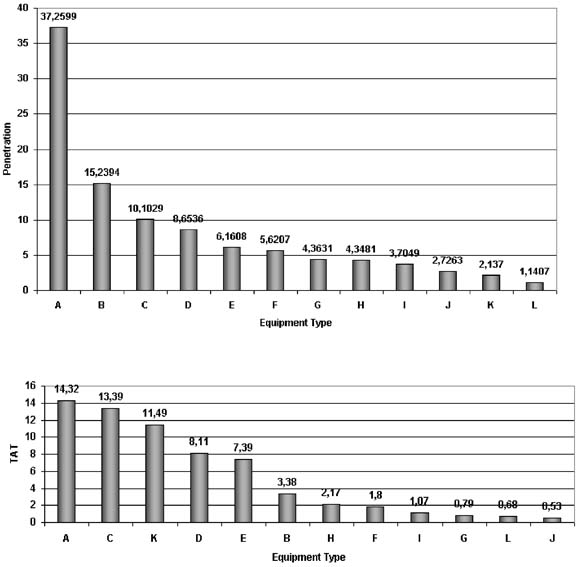
Figure 1 shows the average TAT and acquisition cost penetration according to respective equipment type (acquisition cost penetration represents the % of acquisition cost of a category compared to total acquisition cost for all categories).
Figure 1. Acquisition cost penetration and average TAT per equipment type
Insight characterisation
Once the gross statistical properties of the data had been retrieved, some interesting "insights" emerged and are summarised as follows:
1. Equipment types C, B, E and A represented 55.54% of the hospital inventory (by number) and caused 67.45% of the total work orders (Table 1);
2. A type E equipment accounted for a mere 3.6% of medical equipment (26) in the inventory but caused 13.37% (131) of the total work orders (Table 1, row 3);
3. Equipment types A, B, E and D accounted for 71.26% of acquisition cost penetration (Figure 1); and
4. Equipment types A, C, K and D had the higher TAT values, ranging from 14.32 to 8.11 days (Figure. 1).
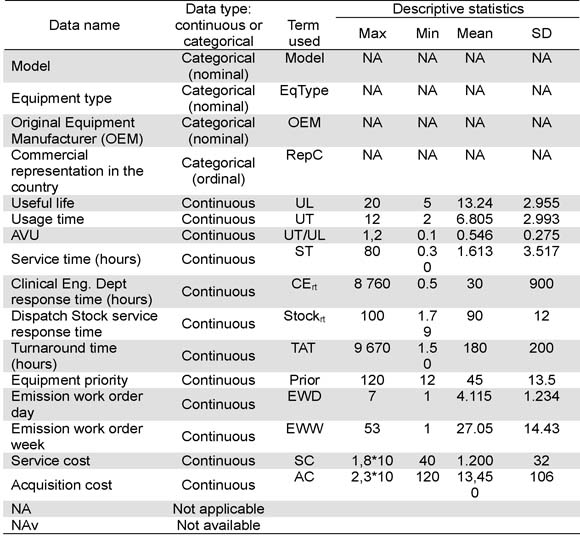
Table 1. Selected variables for data model builder purpose (where max, min, mean, SD means maximum, minimum, mean and standard deviation values)
The process continued with an analysis of all the "insights" to discard those which did not contribute to or made a redundant contribution to resolving the TAT problem. It should be stressed that the specifics and implications of these insights must be examined more closely and their interpretation be explicit. Initial considerations of the work order count (insights 1) did not readily reveal its impact on equipment TAT. However, it is interesting to note that if a simple calculation were performed for yielding the total TAT for each equipment type, given the number of work orders it received, it became clear that equipment type C had 50,7 % of total TAT, whereas it accounted for only 30,6 % of work orders. Although this result had little bearing on individual TAT, it was a definite indicator of its likely prevalence in CED maintenance management issues.
Averages for C, B, E and A were 1.2, 1.21, 1.5, 2.9 hours, respectively, when first looking at average service times for these groups. Type A was placed in rank 4 in insight #1 but had the highest average service time of those included here. In fact, the ranks were reversed, running from A, E, B, and C. Regarding the third insight, equipment type group A had major acquisition cost penetration (a value close to 38 %) and its closest competitor, B, at around 15 %. This fact could have been indicative of the relative complexity of composite type A equipment. Final consideration of average TAT insights, equipment type A and C had the highest individual values (14,3 and 13,4 days, respectively). Doing the same simple calculation for total TAT contribution for type A yielded 16 %.
This revealed that service time did not seem to have a likely significant impact on TAT (i.e. 2,9 hours <<14.32 days in type A) and equipment types A and C contributed 67 % of total TAT spent by all equipment types and nearly 50 % of acquisition cost penetration.
Building the TAT predictor
Variables listed in Table 1 were assessed as being the most likely contributors to TAT. As will become evident, subsequent elimination of variables continued through the remainder of the process.
The representative rows for equipment type A and C gave a highly representative and random sample from which to begin to build the TAT model. 16 variables were taken to give a picture of the data sample size at this point and multiplied by the 389 representative work orders produced for equipment type A and C. The number was just above 5,800 entries, which was considerably more concise than the entire data set and eliminated non-relevant information.
Multiple linear regression was used for estimating the TAT values; a numeric clustering technique was then used for finding possible causes of undesirable TAT values (1). The TAT calculation has been proposed as being a simple sum of response time and service time (7). In spite of such usage being adequate and reasonable in many cases (for quickly estimating non-operational time for the given equipment), it is conceded that, while efficient, it may not be the most effective predictor possible, given all the information. For example, in such simple usage, the priority (8), usage time and the dispatch time for stock were not considered. These variables could have a potential end-effect on the desired indicator. To illustrate the reasoning behind the newly proposed predictive quantity in "(2)", it is noted in "(1)" that the new TAT is a function of all of the continuous numerical (non date-related) variables selected (Table 1) and/or constructed previously. This general formulation should allow a manager to find which variables are the main contributors to a TAT value in their respective health care environment.
Two separate regressions were carried out for the data being reviewed. First, all variables in "(2)" were included and an initial weighting was acquired for each. This initial step identified the less contributory data so that it could be eliminated. Subsequent regression performance yielded refined weighting and a more compact TAT representation. Backward elimination is the descriptive term for this process and in some cases more then two steps may be deemed necessary.
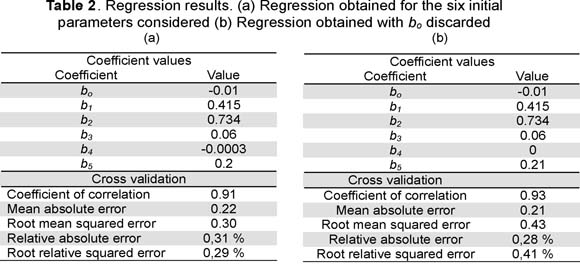
Table 2 (a) displays the weighting acquired for the six initial parameters. The AVU factor (AVU=UL/ET, Table 1) provided almost no information about TAT (b4=-0.0003). The second regressive pass with this data was run with usage time:useful life ratio weighting eliminated (b4=0). Table 2 shows the new weighting (b). Both regressions had high correlation coefficients (0.91 and 0.93 for regression one and two, respectively). Regression two had the higher correlation; however, the root mean squared error and root relative squared error were also higher. Conversely, the relative absolute error for regression two was smaller than regression one. Choosing the second set of weighting was reasonable, given the observed improvement in correlation and the relatively minor difference in relative absolute error (0,02 %).
All computational processing was completed using WEKA version 3.4.7 (6) on a Celeron 2.3 GHz 512 MB RAM Pentium IV PC. Mean time for building the model ran from 12-45 seconds.
When interpreting the resulting weighting and insights it was observed that:
1. The TAT calculation was not a simple algebraic sum of response time and service time;
2. Service time had little effect on TAT value (b3 =0.06);
3. Stock dispatch service and CE response times were large contributors to TAT values. Both had a positive correlation coefficient, b2 =0.734 and b1 =0.415, respectively; and
4. TAT dependence on priority was smaller (b5 =0.21) compared to those in point 3. However, there was positive correlation between priority level and TAT. Explicitly, if priority increased then TAT value increased proportionally.
Point four (4) in results indicated that the clinical engineers and technicians were not using the priority system well in the hospital in question. Only one conclusion can reasonably be made with the TAT of a piece of equipment increasing with priority; medical equipment having the lowest priority is being repaired first, when the exact opposite is intuitively desirable. TAT should have a negative correlation with priority level; due attention must therefore be given to this issue.
With TAT's heavy dependence on stock service response time some investigation therein may uncover possible areas for improvement. Suppliers, OEMs and vendors all account for a meaningful proportion of such response time. Clustering this time against whether or not a product in question has commercial representation in Colombia (Figure 2) showed clear dependence.
The relationships of the remaining variables' (UL, UT, EWD, EWW, SC/AC) ratio against TAT were investigated to complete the analysis. No meaningful pattern was uncovered for them in the hospital being studied.
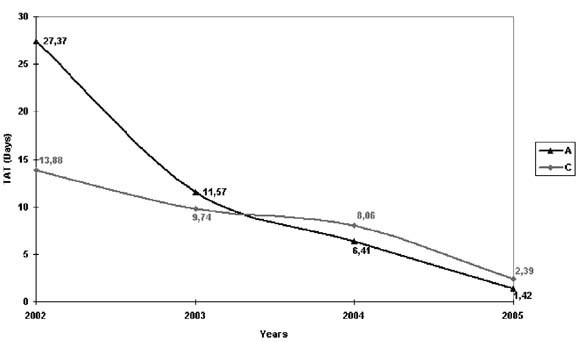
A review of policy relating to using a priority system was made after this study. Figure 3 shows the TAT trend for groups A and C, dropping from 27,37 to 1,42 and 13,88 to 2,39 days, respectively. It can be seen that average TAT for 2002-2004 was 15.15 and 10.56 days for groups A and C, respectively.
The authors reached the following conclusions after finalising this research:
1. TAT was found to be dependently modelled on stock dispatch and clinical engineering departments' response times, having a lower, but still relevant, dependence on using a priority system;
2. Clustering revealed a large TAT for OEM, vendors, and suppliers having no representation in Colombia. This point should be carefully considered whe taking a decision to purchase such equipment in the first place as it has such a drastic effect on availability in patient care; and
3. This examination has provided a means for analysing current technical services' quality and effectiveness. In doing so, it has demonstrated a process for identifying areas and methods of improvement and a model against which to analyse these methods' effectiveness§
1. Two Crows Corporation. Introduction to Data Mining and Knowledge Discovery, 3rd Ed., Maryland, 1999. [Internet] Available at http://www.twocrows.com/intro-dm.pdf (browsing February 2002) [ Links ]
2. Smola A.J., Scholkopf B. A. Tutorial on Support Vector Regression, NeuroCOLT2 Technical Report Series, 1998, NC2-TR-1998-030. [ Links ]
3. Muller KR A, Smola G, Ruatsch B, Schoolkopf J, Kohlmorgen, Vapnik V. Predicting time series with support vector machines, In: Gerstner W, Germond A, Hasler M ,Nicoud JD, editors, Artificial Neural Networks, ICANN '97, Springer Lecture Notes in Computer Science Vol. 1327, 1997. [ Links ]
4. Belouadah H, Potts CN. Scheduling Identical Parallel Machine to Minimize Total Weighted Completion Time. Discrete Applied Mathematics 1995; 48:201-218. [ Links ]
5. Gelly S, Mary J, Teytaud O. Learning for stochastic dynamic programming. [Internet] Available at http://opendp.sourceforge.net (browsing February 2002) [ Links ]
6. Press WH, Teukolosky SA, Vetterling WT. Numerical Recipes in C: The Art of Scientific Computing. Cambridge, 1996, UK: Cambridge University Press. [ Links ]
7. Miguel CA, Rodriguez ED, Caridad SV MC, Gonzales LM. An event-tree-based mathematical formula for the removal of biomedical equipment from a hospital inventory. Journal of Clinical Engineering 2002; Winter:39. [ Links ]
8. Miguel CA, Rodriguez ED, Caridad SV, Measured effects of user and clinical engineering training using a queuing model. Biomedical Instrumentation and Technology 2003; 37:3. [ Links ]

