


Services on Demand
Journal
Article
 English (pdf)
 Article in xml format
 Article references
 Send this article by e-mail
Indicators
-
 Cited by SciELO
 -
 Access statistics
Related links
-
 Cited by Google
 -
 Similars in
SciELO
Similars in
SciELO -
 Similars in Google
Share

 Permalink
Revista de Salud Pública
Print version ISSN 0124-0064
Rev. salud pública vol.16 no.1 Bogotá Jan./Feb. 2014
https://doi.org/10.15446/rsap.v16n1.38665
http://dx.doi.org/10.15446/rsap.v16n1.38665
Artículo/Investigación
Investigating neighbourhood effects on health: Using community-survey data for developing neighbourhood-related constructs
Efectos del barrio sobre la salud: Metodología para construir variables del barrio utilizando datos de encuestas poblacionales
Beatriz Caicedo1 and Kelvyn Jones2
1 National School of Public Health, University of Antioquia, Medellin, Colombia. bcaicedov@gmail.com
2 School of Geographical Sciences, University of Bristol. England. kelvyn.jones@bristol.ac.uk
Received 4th July 2013/Send for Modification 10th August 2013/Accepted 16th September 2013
ABSTRACT
Objective Structural and social neighbourhood constructs have been developed for studying a neighbourhood's influence on a variety of health outcomes; community surveys are being increasingly used for capturing such information. This paper has proposed a six-fold approach which integrates existing methodologies (i.e. multilevel factor analysis, ecometrics, multilevel spatial multiple membership models and multilevel latent class analysis) for estimating reliable and valid measurement of neighbourhood conditions.
Methods The proposed approach used seven demographic and socio-economic variables reported in a community survey by 20,413 individuals residing in 244 neighbourhoods in Medellin, Colombia, to measure structural neighbourhood conditions.
Results The set of variables reliably measured one neighbourhood construct: the deprivation index; this showed significant variation between neighbourhoods as well as significant spatial clustering across the city.
Conclusions The approach presented here should enable public health researchers to better estimate neighbourhood indicators and may result in more accurate assessment of the relationship between neighbourhood characteristics and individual-level health outcomes.
Key Words: Residence characteristics, data collection, epidemiological method, psychometrics, multilevel analysis (source: MeSH, NLM).
RESUMEN
Objetivo Múltiples variables que describen las características físicas y sociales de los barrios han sido desarrolladas para investigar los efectos del barrio sobre la salud. Las encuestas poblacionales son cada vez más utilizadas para capturar dicha información. Este artículo propone una metodología que integra diferentes técnicas estadísticas, tales como análisis factorial multinivel, ecometría, modelo espacial multinivel y modelo de clases latentes multinivel, para explorar datos derivados de encuestas poblacionales y estimar variables que describan las características de los barrios de manera precisa y confiable.
Métodos Este artículo demuestra la aplicación del método propuesto para caracterizar condiciones estructurales de los barrios de Medellín-Colombia. Para esto se analizaron siete variables demográficas y socio-económicas reportadas por 20 413 individuos residentes de 244 barrios de la ciudad.
Resultados Los resultados mostraron que el conjunto de variables miden de manera confiable un índice de privación económica para cada barrio, el cual mostró variaciones significativas entre los barrios, y agrupaciones espaciales en diferentes áreas de la ciudad.
Conclusiones Se espera que el método propuesto sirva a los investigadores en salud pública para estimar indicadores del barrio más precisos, lo que ha de traducirse en estimaciones más confiables de los efectos del barrio sobre la salud individual.
Palabras Clave: Características geográficas, recolección de datos, métodos epidemiológicos, psicometría, análisis multinivel (fuente: DeCS, BIREME).
Spatial data regarding an individual's residential neighbourhood's physical, social and economic conditions is becoming increasingly important in studies investigating how the context is associated with individual health outcomes (1). Several sources are used for measuring such neighbourhood constructs; census or local administrative data sets are most widely used, whilst community surveys represent the second most common source.
Converting census and administrative-data into neighbourhood measurements is relatively straight forward; in practice such measurements are usually available as summaries for geographical units and are typically used as means or percentages. Regarding survey data, the most common strategy is simple aggregation using existing geographical units and calculating indicators, such us means or percentages. Although this technique may provide a rich summary of the survey data, neighbourhood researchers have highlighted some methodological constrains which may affect neighbourhood studies. For example, aggregation techniques typically assume that the sample mean is a reliable estimate of the neighbourhood mean, or that the resultant neighbourhood variables are continuous with a known distribution (2). Such assumptions may be problematic when there is little information on a neighbourhood's specific characteristic (neighbourhoods having few respondents) or when neighbourhood latent constructs are discrete rather than normal.
An atomistic fallacy may also be committed when using survey data (i.e. incorrectly assuming that the characteristics observed at individual-level holds for neighbourhood-level versions of such variables) (3). Empirical evidence suggests that three different neighbourhood-level constructs may emerge from survey data: one refers to neighbourhood-level constructs only having a conceptual meaning at that level (e.g. as social disorganisation or collective efficacy), another concerns neighbourhood-level constructs which are meaningful at both individual and neighbourhood-level (although the variables provide different information at each level, e.g. individual income and mean neighbourhood income) whilst yet another deals with neighbourhood-level variables operating at both levels but having a different factor structure (4). It has also been found that the number of constructs at neighbourhood-level tends to be smaller than the number of constructs at individual-level (5).
Failure to properly measure neighbourhood constructs may lead to bias in estimating the association between neighbourhood predictors and individual outcomes (1,6). Recent methodological developments have consequently addressed such issues, showing significant improvement regarding the proper measurement of survey data-derived neighbourhood constructs. This would include multilevel factor analysis, multilevel latent class analysis, ecometrics and multilevel spatial multiple membership models (5,7-11). Briefly, multilevel factor analysis and multilevel latent class analysis explores survey-data factor-structure at different levels. The main difference between the two is based on the nature of estimated latent variables (12,13); the former creates continuous neighbourhood variables; while the latter creates categorical neighbourhood variables (12,13). The ecometric model (i.e. assessing ecological settings, applied to the systematic social observation of neighbourhoods) allows continuous neighbourhood scores to be estimated and uses psychometric tools for assessing their reliability and validity. Spatial models take into account the spatial structure of the data and calculate precision-weighted estimates to provide more reliable neighbourhood measurements, especially for neighbourhoods involving small sample sizes. This paper presents a combination of such statistical techniques in a novel approach which aims to create neighbourhood variables which can be used as reliable predictors in neighbourhood-health research. This combination of approaches has not been used previously in measuring neighbourhood constructs; this paper thus provides a step-by-step illustration of its application which can be consistently and easily replicated in public health research.
METHODS
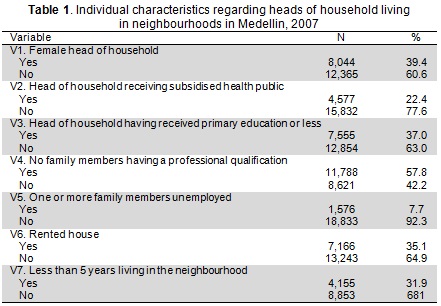
Data was taken from a 2007community-survey in Medellin, Colombia (the Medellin Life Quality Survey) which provided information about city households' size and structure. This survey involved 20,409 heads of households from 244 neighbourhoods. The community-survey collected a set of individual demographic and socio-economic variables which are commonly used for assessing two main structural neighbourhood conditions: deprivation and residential instability (14). Table 1 shows these binary indicators' distribution.
Analysis: A six-fold scheme for measuring neighbourhood characteristics using survey data
The proposed scheme used three-level latent models, with responses at level-1 nested within individuals at level-2 and within neighbourhoods at level-3. The first three steps followed Muthén's analytical strategy (5) for exploring hierarchical data's factor-structure; this was further extended to assess neighbourhood score reliability (step 4), spatial dependency and distributional assumptions (step 5) and, if necessary, to identify neighbourhood-latent classes (step 6).
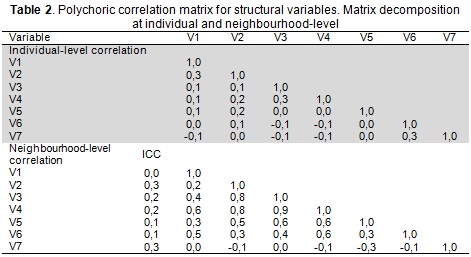
1. The first step determined variation in neighbourhood response and evaluated whether a multilevel analysis was justified for creating the constructs. This was done by calculating the intra-class correlation coefficient (ICC) for each variable which was obtained by using a random effects model (i.e. the larger the ICC, the higher the variation). An overall ICC greater than 0.10 indicated enough variability to justify a multilevel modelling technique.
2. The second step explored the variable factor structure at individual and neighbourhood-level, as well as defining the least interpretable factors at each level of analysis, without imposing any restriction on parameter estimates. This was done by separate exploratory factor analysis into individual and neighbourhood-level variance-covariance matrices. This two-level exploratory factor model was defined as:
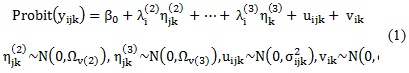
Where yijk represented response i for individual j in neighbourhood k; β0 was overall intercept, λi(2) and λi(3) were individual and neighbourhood factor loading parameters. The scores for each individual and neighbourhood were described by ηjk(2) and ηjk(3); which were assumed as being normally distributed with variance Ωv(2) and Ωv(3) and constrained to 1 to make the model estimable. uijk and vik represented residual random individual and neighbourhood-effects which were mutually independent and assumed to have normal distribution with variance σijk2 and σik2.
Standardised root mean square residual (SRMR) and root mean square error of approximation (RMSEA) goodness of fit statistics (15) were used for choosing the best factor structure. Values lower than 0.08 indicated an acceptable fit (16).
3. The third step involved multilevel confirmatory factor analysis. Based on the results of the exploratory analysis, this step investigated how well the identified factors fit the sample. This was done by placing constraints on factor loading, variance, covariance and residual variance in Eq. (1). SRMR and RMSEA were also used for assessing the models' goodness-of-fit, as well as the comparative fit index (CFI) and the Tucker-Lewis index (TLI) which were expected to have values higher than 0.95 (16).
4. The fourth analysis step specified an ecometric model for estimating the identified constructs' continuous neighbourhood scores and evaluating their reliability. This model was written as:
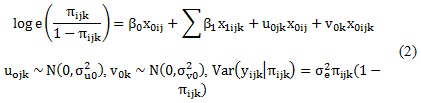
Where πijk was the estimated probability of saying 'yes' to question i for individual j in neighbourhood k. The xijk terms were a series of dummy variables representing the i variables reported for individual j in neighbourhood k. u0jk and v0k were individual and neighbourhood-level scores on the logit scale, having variance σu02 and σv02. Level-1 variation was represented by σe2; which was constrained to 1 as it was a Bernoulli distribution. Estimated model parameters were used for calculating a reliability index, as follows:

Where jk was the number of individuals sampled within neighbourhood k and the average number of neighbourhood indicators per individual in neighbourhood k was  was variance based on the predicted average percentage of affirmative responses in neighbourhood k,
  . This measurement ranged from 0 to 1, higher values indicating the model's sensitivity in distinguishing neighbourhood differences regarding neighbourhood construct scores.
5. The fifth step extended the ecometric model to a spatial multiple membership model to improve neighbourhood estimates and hence create more reliable neighbourhood measurements. This spatial model calculated precision-weighted estimates(i.e. few individuals within a neighbourhood would have resulted in the estimate shrinking back towards the mean for the neighbouring neighbourhoods in a form of spatial smoothing) (9). The model was specified as:
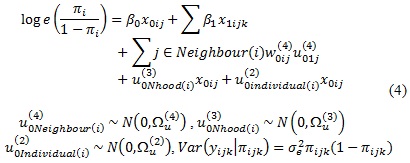
The above notation followed Browne, Goldstein and Rasbash (17),only using one subscript i to represent the lowest-level (responses) and three-classification indicators to represent subscripts for individuals (classification-2), neighbourhoods (classification-3) and surrounding neighbours (classification-4) random effects. These three separate random effects influencing the logit of an affirmative response to the variables were given by the between-individual-effects, the a spatial between-neighbourhoods-effects and spatial neighbouring-effects, assumed to be normally distributed (mean= 0 and variance Ωu(2), Ωu(3) and Ωu(4)). The superscript represented the classification number which started from 2 given that the lowest level (response) was considered classification 1. The weight assigned to the neighbour random effect for neighbourhood k for individual j was given by w0ij(4). In this model the weightings were constructed to sum up to one. If nj referred to the number of adjacent neighbours in neighbourhood i, then: w0ij(4)=1/nj if neighbourhood i and j shared a common boundary and, w0ij(4)=0 otherwise. σe2πijk(1-πijk) was level-1 variance associated with Bernoulli weighting (having a value of 1).
Deviance information criterion (DIC) was used to compare the fit of the ecometric model in Eq. (3) (no spatial effects) with that in Eq. (4) (having spatial effects). The model having the smaller DIC was the better (9). Neighbourhood scores were calculated and their distributional assumptions evaluated using the chosen model. Similar estimates of neighbourhood scores' mean and median would have indicated an approximated normal distribution and a continuous neighbourhood variable would thus have been an acceptable specification for the data. Conversely, concerns about non-normality may have revealed that a binary or ordered variable would have better characterised the neighbourhood construct. If this were the case, then it would have been necessary to proceed to the next step.
6. The sixth step of the analysis involved multilevel latent class analysis to allow discrete classification of neighbourhood scores into homogeneous categories. This was provided by a non-parametric latent class model specified as described by Muthén and Vermunt (18,19). Bayesian information criterion (BIC) (20) was used for determining the number of neighbourhood-latent classes, as well as the entropy statistic which ranged from 0 to 1, higher values indicating better classification (21).
MPLUS version 6.11 (22) (steps 1 to 3 and 6) and MLwiN 2.22 software with MCMC (steps 4 and 5) were used for estimating the proposed six-fold scheme (9).
RESULTS
Table 2 gives ICC values from step 1, ranging from 0.0 to 0.3 (mean 0.2 and median 0.2); such values indicated sufficient between-neighbourhood variability in the responses to warrant an explicit multilevel analysis. Table 2 also shows the correlation between the variables at individual and neighbourhood-level (step 2). Variables V7 and V6 had greater correlation at individual-level than neighbourhood-level (being negative at the latter level) (Table 2).
Model 3 factor loadings derived from the confirmatory factor model (step 3) are shown in Table 4. Variables having ≤ 0.30 loadings were constrained to zero. The factor loadings for each variable were allowed to load onto one factor, and only one; therefore, the first factor at individual-level was specified to consist of V1, V2 and V5. Variables V3 and V4 defined the second factor and variables V6 and V7 constituted the third factor. The single factor at the neighbourhood-level was specified to consist of all variables, except for variable V7.
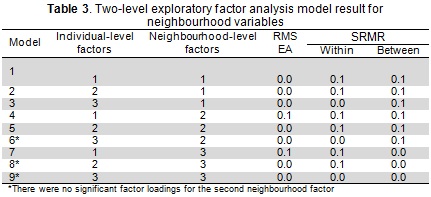
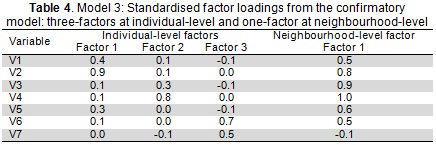
The factor variance of the model at both levels was constrained to 1 to ensure a unique identifiable solution. The results for this model showed goodness of fit within the expected range (CFI=0.975, TLI=0.960, RMSEA=0.010), suggesting that three-latent variables at the individual-level and one-latent variable at the neighbourhood-level provided the best factor structure.
Regarding the chosen model's standardised factor loadings (Table 4), larger loadings values were found at the neighbourhood-level, indicating the presence of a construct having stronger meaning at this level than at individual-level. At neighbourhood-level, single factor loadings were fairly homogeneous, except for variable V7 which had low and non-significant loading. This neighbourhood dimension can be termed 'neighbourhood deprivation'.
The ecometric model in step 4 used the six variables found to form the neighbourhood construct. Results from the random component estimates showed that deprivation level varied more at the neighbourhood-level than individual-level (σu02=0.27: (0.22,0.33) 95% CI; σe2=0.20: (0.17,0.22) 95% CI). Regarding the reliability index, this had high reliability (0.95), suggesting that mean estimated deprivation was a good estimate of the true neighbourhood score.
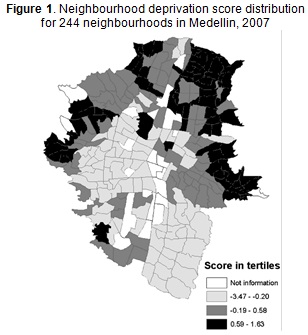
Results for the spatial multiple membership ecometric model adjusted in step 5 showed substantial improvement of the model's estimates by including the spatial neighbour terms. The spatial variance term was highly significant (Ωu(4)=0.98: (0.70,1.41) 95% CI) and even higher than the a spatial effects (Ωu(3)=0.05: (0.03,0.07) 95% CI) thereby indicating considerable spatial clustering regarding deprivation level across the city.
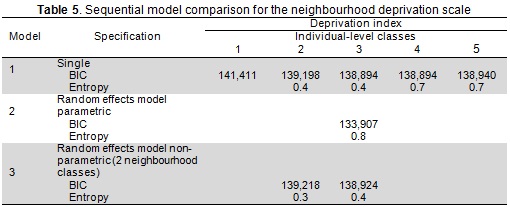
This result was confirmed in Figure 1 portraying the estimated neighbourhood scores derived from this spatial ecometric model. The map shows that the most deprived neighbourhoods in Medellin tended to be significantly clustered along the periphery of the city, with substantial clustering located on the north-east side. The differences between the mean and median for estimated neighbourhood scores indicated a negatively skewed distribution (mean=0.0046, median=0.14), suggesting that was worth proceeding to the sixth step. Table 5 gives the multilevel latent class analysis results. Single-level model (model 1) BIC values showed that a model having three classes of individual provided the preferred solution. Much lower BIC values were observed when the data's hierarchical structure was considered (model 2). Model 3 included two neighbourhood-level latent classes leading to a slightly higher BIC than the parametric representation. However, very low entropy values indicated great uncertainty in classifying the neighbourhoods into two distinct classes. The results thus demonstrated that the neighbourhood deprivation scale was better represented by continuous distribution, thereby validating the spatial ecometric model's results.
This paper has tried to estimate reliable and valid measurements of survey data-derived neighbourhood conditions and use novel approaches integrated with properly measured constructs operating at this level. This paper was not focused on presenting new statistical approaches' experimental results; rather it focused on mastery of the existing methodologies to derive theoretically rich and empirically meaningful constructs of categorical and continuous neighbourhood conditions. These have been shown in previous research to contribute towards the differential distribution of individuals' health by comparing communities. This paper's contribution was based on a coherent sequence of steps for producing valid neighbourhood measurement. The important advantages of the approaches used here consisted of:
- Allowing the nature of the data to be explored at neighbourhood-level and therefore focus on obtaining uni-dimensional scales operating specifically at that level;
- Applying them to whatever scale of measurement used to define input variables(whether continuous or categorical), thereby avoiding subjectivity in defining the scales and arbitrary choices of cut-off points to discretise the continuous neighbourhood variables; and
- Providing neighbourhood measurements as precision-weighted estimates fully exploiting the available data and minimising the effect of small neighbourhood sample size.
A neighbourhood deprivation construct was developed with the data which related well to conceptual theories of neighbourhood differences. The models found significant variation in probability of occurrence as well as significant spatial clustering across the city. The results confirmed Muthén's (5) observation that the number of factors at neighbourhood-level are fewer than the number of factors at individual-level. Thus, for the set of variables measuring structural characteristics, only one construct was found to be distinguishable at neighbourhood-level (neighbourhood deprivation) while three were recognised at individual-level.
The approach presented here should enable public health researchers to better estimate neighbourhood indicators, possibly resulting in more accurate assessment of the relationship between neighbourhood characteristics and individual-level health outcomes.
REFERENCES
1. O'Campo P, O'Brien CM. Measures of residential community contexts. Methods in social epidemiology. San Francisco (CA): Jossey Bass; 2006.p.p. 193-208. [ Links ]
2. Rajaratnam JK, Burke JG, O'Campo P. Maternal and child health and neighborhood context: the selection and construction of area-level variables. Health & Place. 2006;12(4):547-56. [ Links ]
3. Robinson W. Ecological correlations and the behavior of individuals. International journal of epidemiology. 2009;38(2):337. [ Links ]
4. Chan D. Functional relations among constructs in the same content domain at different levels of analysis: A typology of composition models. Journal of Applied Psychology. 1998;83(2):234-46. [ Links ]
5. Muthén BO. Multilevel covariance structure analysis. Sociological Methods & Research. 1994;22(3):376. [ Links ]
6. Shin Y, Raudenbush SW. A latent cluster-mean approach to the contextual effects model with missing data. Journal of Educational and Behavioral Statistics. 2010;35(1):26. [ Links ]
7. Goldstein H, Steele F, Rasbash J, Charlton C. REALCOM: methodology for realistically complex multilevel modelling. Bristol: Centre for Multilevel Modelling, Graduate School of Education, University of Bristol; 2008. [ Links ]
8. Raudenbush SW, Sampson RJ. Ecometrics: toward a science of assessing ecological settings, with application to the systematic social observation of neighborhoods. Sociological Methodology. 1999;29:1-41. [ Links ]
9. Browne W. MCMC Estimation in MLwiN. London: Institute of Education; 2003. [ Links ]
10.Lawson A, Browne W, Rodeiro C. Disease mapping with WinBUGS and MLwiN: Wiley 2003. [ Links ]
11. Savitz N, Raudenbush S. Exploiting spatial dependence to improve measurement of neighborhood social processes. Sociological Methodology. 2009;39(1):151-83. [ Links ]
12. Goldstein H, Browne W. Multilevel factor analysis modelling using Markov Chain Monte Carlo (MCMC) estimation. New Jersey: Lawrence Erlbaum; 2002. p.p. 225-43. [ Links ]
13. Vermunt JK. Applications of latent trait and latent class models in the social sciences. Lecture Notes in Artificial Intelligence. 2003;2711 22-36. [ Links ]
14. Kawachi I, Subramanian S. Neighbourhood influences on health. Journal of Epidemiology and Community Health. 2007;61(1):3. [ Links ]
15. Yu CY. Evaluating cutoff criteria of model fit indices for latent variable models with binary and continuous outcomes. Los Angeles: University of California; 2002. [ Links ]
16. Hu L, Bentler PM. Cutoff criteria for fit indexes in covariance structure analysis: Conventional criteria versus new alternatives. Structural Equation Modeling: A Multidisciplinary Journal. 1999;6(1):1-55. [ Links ]
17. Browne W, Goldstein H, Rasbash J. Multiple membership multiple classification (MMMC) models. Statistical Modelling. 2001;1(2):103. [ Links ]
18. Vermunt J. Multilevel latent class models. Sociological Methodology. 2003;33(1):213-39. [ Links ]
19. Henry K, Muthén B. Multilevel latent class analysis: an application of adolescent smoking typologies with individual and contextual predictors. Structural Equation Modeling: A Multidisciplinary Journal. 2010;17(2):193-215. [ Links ]
20. Luko IO, Vermunt J. Determining the number of components in mixture models for hierarchical data. Advances in data analysis, data handling and business intelligence; 2010. p.p. 241-9. [ Links ]
21. Murphy J, Shevlin M, Adamson G. A latent class analysis of positive psychosis symptoms based on the British Psychiatric Morbidity Survey. Personality and Individual Differences. 2007;42(8):1491-502. [ Links ]
22. Muthén LK, Muthén BO. Mplus User's Guide. Los Angeles, CA: Muthén & Muthén; 1998-2010. [ Links ]
