


 English (pdf)
 Article in xml format
 Article references
 Send this article by e-mail
 Cited by SciELO
  Cited by Google
  Similars in
SciELO
Similars in
SciELO  Similars in Google
 Permalink
Assessing road user behavior is essential for the design of safe road environments. Understanding users’ errors, motivations and expectations when using road systems allows for an infrastructure design that minimizes human error, elicits safe behavior and reduces the probability of serious injury 1-5. This paradigm of road environment design is at the heart of road safety philosophies in leader countries such as Sweden (Vision Zero program) and the Netherlands (Sustainable Safety program) 6. The assessment of pedestrian behavior is a priority in today’s global society 7 and, in particular, in developing countries, where they are considered as the most vulnerable road user 8.
There are a variety of ways to assess pedestrian behavior, including the evaluation of pedestrian choices under simulated and real scenarios. Simulated scenarios have been especially valuable in understanding pedestrian behavior 9-14. On the other hand, studies on pedestrian behavior in real scenarios allow researchers to describe and quantify the frequency of common risky behaviors 15-17, as well as testing theories that predict pedestrians’ choices and reactions to traffic conditions.
Video-based methods may constitute a feasible option to assess pedestrians’ road-crossing choices and interactions with vehicles around them. However, most computer applications that focus on evaluating pedestrian behaviors are still at the level of algorithm development for detecting and tracking moving objects 15,18-20 or are not easily available or well suited for the analysis of a variety of traffic conditions 15-17,21-23. Only a few studies have reported the use of flexible applications for road safety with a main focus on assessing the trajectory, traffic volume and/or traffic object speed 19,24,25.
The present study reports the feasibility of a new video-based algorithm to conduct automated analysis of pedestrians’ behavior at a busy urban location in Bogotá, Colombia.
METHODS
Design
In this study, a computer algorithm was developed to gather information on pedestrian behavior from videos taken in a busy urban location in Bogotá, Colombia. Urban locations considered for this study included those with high frequency of pedestrians crossing the road and those were video-camera recording above street level (8th to 10th floor) was possible. To assess the validity of the video-based information, selected behaviors of pedestrians assessed with the algorithm that was created for the video analysis were compared whit those assessed visually.
Data collection procedures
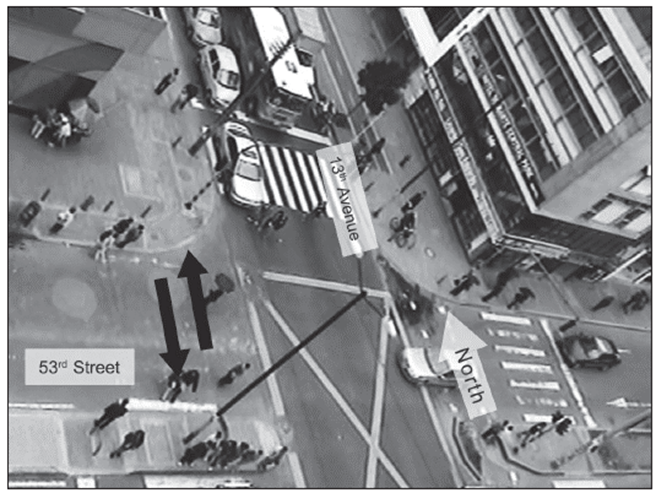
Data collection was done through videotaping pedestrians as they crossed a selected road (Figure 1). An audio video interleave format (AVI) video was taken from a tall building that was adjacent to the road of interest. The view scope of the recordings allowed for the analyses of pedestrian crossings at the corner through designated areas (i.e., the crosswalk or pedestrian crossing) and up to approximately 30 meters from the corner. The video recording angle and distance did not allow to positively identifying specific pedestrians; therefore, it was not possible to describe the demographics of observed pedestrians. Letters requesting permission to place video recording equipment on an upper level of buildings were sent to their administrators. The present study reports the results obtained from videos taken at the corner of 53rd street and 11th avenue in Bogotá, Colombia. Standard SONY camcorder DCR SR82 equipment was used.
Algorithm development and testing
The objective of the study was to develop an algorithm that allowed analyzing automatically videos to identify and record pedestrian position and pedestrian distance from motor vehicles, as well as speeds of pedestrians and vehicles during the crossing of a specific road segment. In particular, the study aimed to identify potentially hazardous pedestrian behaviors, i.e., to assess if pedestrians: 1. Crossed in designated areas (i.e., designated locations for pedestrian crossing, commonly known as crosswalks); 2. rossed near moving vehicles that were at a distance less than 2 meters away, and; 3. Ran when crossing a road, which is a measure of conflict between pedestrians and drivers 17.
The recorded video was used to refine a version of an algorithm for movement detection that was previously developed by the authors of this paper. The algorithm was developed using C++ language and uses libraries for image processing from OpenCV (Open computer vision) 26.
The algorithm comprises of a 6-step process: 1) video reading, background modeling using a code book algorithm and extraction of first plane pixels; 2) morphological filtering, object segmentation and indexing; 3) contour extraction for each object in the first plane; 4) calculation of the area moments based on the contour of each object; 5) classification of each object as vehicle, single pedestrian or cluster of pedestrians (to train the classifier, a support vector machine was used), and 6) follow-up 27-29. Based on sizes and shapes of objects, the algorithm classifies a single pedestrian. Bigger objects are classified using a support vector machine that determines whether the object is a vehicle or a cluster of pedestrians. Multiple versions of the algorithm were created in the process of its refinement in order to improve its ability to identify and follow objects correctly in a user-specified area of interest in the video.
The use of the algorithm includes loading the video on the developed application and modifying the algorithm code to indicate the correspondence between pixels in the video and meters on the road, as well as specification of the area of interest. Also, the user must indicate a particular segment within the area of interest. Every person who crosses that segment is counted by the algorithm and a visual count will be shown on the screen. This preparation process takes only a few minutes.
The analyses are executed in real-time as the video progresses. However, the algorithm requires additional calibration from the user as the video progresses, which is achieved by indicating, whenever possible, that there is not a moving object in the area of interest. The algorithm runs on a computer with a standard processor and does not require additional software aside standard computer operating systems.
At the end of the video, the algorithm produces a record of positions (coordinates) and speeds (meters per second) throughout the cross for each object identified in the video at a frequency of 30 Hz. Recorded speeds were averaged over a moving window of 1 second before further analysis. To ascertain whether pedestrians crossed through the crosswalk or not, the coordinates of their specific positions need to be compared with the coordinates defining the crosswalk in the video. To assess whether pedestrians crossed running, average recorded pedestrian speeds need to be dichotomized with an adjustable cutoff that distinguishes between walking and running according to previous reports 13,30-32. Similarly, to evaluate if pedestrians started running at any time during the cross of the road, peak accelerations are estimated from the recorded speeds and dichotomized with various adjustable cutoffs that may indicate significant changes in speed.
To determine the validity of these estimations, the recorded automated algorithm-based pedestrian behaviors were compared with the visual-based assessment of pedestrian behaviors of the same video carried out by a trained analyst. It was possible to achieve at least moderate reproducibility of the analyst’s observations as measured by the Cohen’s Kappa coefficient. Specifically, the following reproducibility values of visual assessment for different behaviors were estimated: pedestrians crossed through the crosswalk (Cohen’s Kappa=95.2); pedestrians crossed at a distance less than 2 meters from a moving vehicle (Cohen’s Kappa=52.1); pedestrians crossed at less than 2 meters from an approaching vehicle (Cohen’s Kappa=54.0), and pedestrians ran while crossing the road (Cohen’s Kappa=43.8). Nevertheless, the analyst showed very poor reproducibility when identifying if pedestrians started crossing at any time.
The comparison between the results obtained in the visual observations and the observations based on the algorithm required for the validity analysis was time-intensive and took up to 3 hours for a 9-minute video. Therefore, a total of 27 minutes of video were randomly selected to perform the analyses. Agreements between manual and automated video-based estimates were measured through percentage of agreement, Spearman’s rank correlations and estimations of sensitivity and specificity. The latter measure is preferred for nominal dichotomous data such as the data compared in this study 33. The Spearman’s rank correlation is a convenient measure that can be easily interpreted but can only be generalized to other populations with similar prevalence in the observed behaviors 33. Lastly, although the Cohen’s Kappa coefficient is an appropriate measure of reproducibility 34, it has also been estimated because it has been frequently used in the literature as a measure of validity.
RESULTS
Based on visual counting, a total of 449 persons crossed the roads during the 27 minutes of video that were analyzed in the present study. The algorithm identified 165 objects of the pedestrian type. The visual assessment showed that the algorithm identified pedestrian objects with up to 7 pedestrians in each object; and most frequently the algorithm made objects containing two persons (34 %). Based on the size of the object (area measured in pixels of the video), the algorithm estimated that 429 pedestrians crossed the segment of interest of the road. Twenty (4.5 %) pedestrians that crossed the segment of interest of the road were missed by the algorithm.
Pedestrians who were missed by the algorithm were not related to whether they crossed through designated locations (Chi-squared test, p value=0.1170) or crossed at less than 2 meters from moving vehicles (Chi-squared test, p value=0.3133); however, the estimated proportion of pedestrians running when crossing was higher among the ones who were detected by the algorithm (46.9 %) than among those who were not detected (20 %) (Chi-squared test, p-value=0.0184), and the estimated proportion of pedestrians running at any time during the cross was higher among those who were detected by the algorithm (71.8 %) than among those who were not detected (30 %) (Chi-squared test, p- value<0.0001).
The algorithm successfully followed the detected pedestrians throughout the cross from sidewalk to sidewalk in the specified area of interest. The expected error in the estimations of distance between the center of different objects of interest (i.e., pedestrian and vehicles) was 0.3 meters. Assuming a negligible error in time estimation, the average speed of pedestrians during the crossing and the instantaneous speed of the closest vehicle were also estimated with a maximum error of 7 meters per hour (Table 1).
Table 1 Recorded pedestrian-vehicle distance and vehicle speeds by size of the pedestrian object
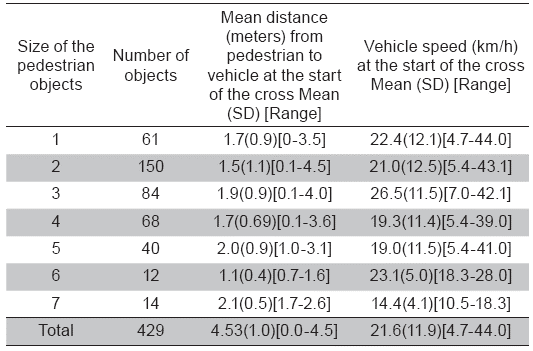
*The number of pedestrians in each pedestrian object detected by the algorithm was counted based on manual observations
Among those pedestrians that were detected by the algorithm, the agreement between visual and automated observations was at least moderate depending on the assessed behavior and the measure of agreement that was used (Table 2). In general, the percentage of agreement and the sensitivity and specificity measures showed good agreement between both methods. In contrast, for the observation of whether pedestrians cross at 2 meters or less from a moving approaching vehicle or not and the observation of whether pedestrians cross running at any time during the cross or not (for example if the pedestrian starts the cross walking and then starts running), low correlations were found (28.7-37.4), as well as only fair agreement by using Cohen’s Kappa according to the criteria proposed by Landis & Koch 35.
Table 2 Agreement between manual and algorithm-based (automated) observation of pedestrians’ behaviors
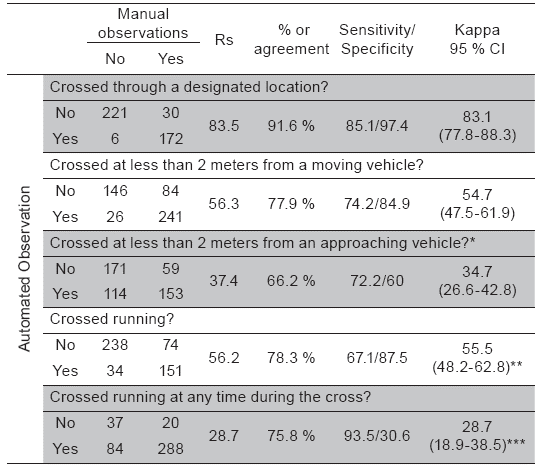
Rs: Spearman Correlation; *The visual observations could identify whether the vehicle that was at 2 meters away or closer was approaching to the pedestrian. The algorithm-based (automated) observation could not identify whether the vehicle was approaching the pedestrian or not; **This was the largest observed agreement for different cutoffs for running (mean pedestrian crossing above 1.9 meters/s) ; ***This was the largest observed agreement for different cutoffs for speed change (peak acceleration above 0.6 meters/s2).
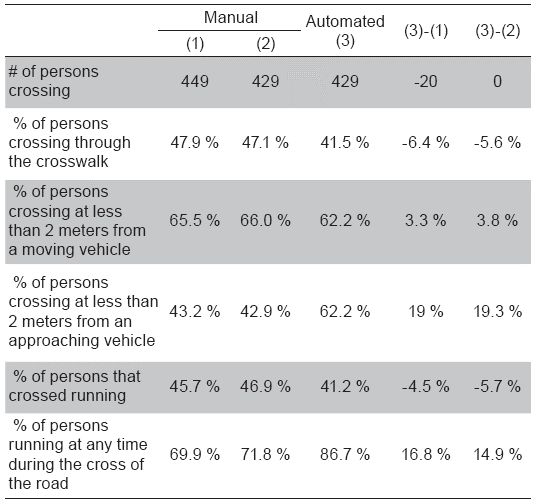
These levels of agreement resulted in group-based differences between automated and visual-based estimations of the prevalence of different pedestrian behaviors that range from -6.4 % to 19.3 % depending on the behavior parameter that is assessed (Table 3).
DISCUSSION
In this study an automated video-based method for researching pedestrian behavior was developed and tested. The application is deemed inexpensive since it does not require especial hardware and is based on an algorithm code that is freely available to be used in other scenarios, as well as to be potentially improved by other researchers. This accessibility characteristic is important as algorithms for road safety applications are not commonly available and the needs to assess road safety conditions are increasing 3.
The application developed in this research measured validly the proportion of pedestrians crossing through designated locations and the number and proportion of pedestrians who crossed it running. However, the application showed moderate disagreement with manual observations regarding the proportion of persons who crossed the segment of interest at less than 2 meters from an approaching vehicle, as well as the proportion of people who run at any time during the cross of the road.
The size of the differences found between algorithm-based and visual-based observations of the prevalence of various pedestrian behaviors was deemed acceptable. As the algorithm did not detect 4.5% of the pedestrians crossing the segment of interest of the road during the period of assessment, all behaviors that were evaluated were affected. However, this loss of information resulted in differences of only 0.3 to 1.9 % in the overall estimations of the prevalence of the assessed behaviors (Table 3). Regarding the estimation of the proportion of pedestrians crossing through designated places, the results obtained through the algorithm had a maximum difference of 6.4 % in comparison with those obtained in the visual assessment. Such difference cannot be easily compared to differences reported in previous studies as traffic conditions in this study may differ from those in other studies. Nevertheless, a rough comparison with one paper reporting this difference indicates that the error size found in this work is consistent with such results 19.
Differences between automated and visual-based estimations regarding the proportion of persons who crossed running and the proportion of people who crossed near moving vehicles were moderate and were affected by the specific behavior definition used and by the reproducibility of the visual method that was used as reference method. When the proportion of persons crossing near any moving vehicle was estimated the algorithm showed differences below 3.8 % in relation to visual-based assessments (Table 3). However, if the condition that only moving approaching vehicles are considered in the estimation is taken into account, this difference increases to 19.3 %, which is explained as the algorithm was not designed to distinguish vehicles moving near pedestrians from vehicles moving near pedestrians and also approaching them. The function to make such distinction should be a matter of future developments of this algorithm.
In addition, the algorithm did not show important differences with visual observations regarding the detection of pedestrians who ran during their whole cross (up to -5.7 %), however if only pedestrians who run at any time during the cross are considered, these differences are up to 16.8 %. The latter estimation may be more relevant as a measure of road safety because it may be better related to the occurrence of pedestrian-vehicle conflicts in roads 16, in spite of that, running may be in fact a protective behavior (e.g., potential reactions of pedestrians to avoid being struck by vehicles).
The disagreement between automated and visual assessments to estimate the prevalence of pedestrians who run any time during the cross can be attributed to the analyst difficulty to observe this behavior. Thus, in the case of this behavior the automated analysis based on the assessment of speed change may be a more accurate method to investigate whether pedestrians run at any time during the cross or not.
This study had several limitations. First, there is uncertainty regarding the performance of the algorithm in different locations. However, it is foreseeable that the algorithm may result in more accurate estimates in less busy locations since objects (i.e., pedestrians and vehicles) that are more separated may be easier to identify and track down. Furthermore, different locations may result in different sources of occlusion and different recording angles that may affect the results to be obtained.
On the other hand, the algorithm is not yet suited for night or rainy conditions. Finding the solution to these potential shortcomings related to pedestrian tracking in crowded areas is a complex task and is the focus of attention of recent works on human detection 36. Addressing these problems will be a focus of future enhancements to the algorithm conducted by the authors of this paper.
It can be concluded that video-based automated analysis of road safety conditions are feasible and can be successfully used to assess pedestrian behavior in urban scenarios. Future work on this tool shall include the creation of prediction models to estimate variables such as “post-encroachment time”, “time to accident”, “compromised pedestrian crossings” 37 and “vehicle deceleration rate” 16) .
.

