


 English (pdf)
 Article in xml format
 Article references
 Send this article by e-mail
 Cited by SciELO
  Cited by Google
  Similars in
SciELO
Similars in
SciELO  Similars in Google
 Permalink
Currently, cardiovascular diseases (CVD) are the leading cause of death world-wide 1. A risk factor for CVD is hypertension, a condition associated with high sodium intake 2. According to the World Health Organization (WHO), the current recommendation for sodium intake is 2 000mg daily (equivalent to 5g of salt) 3, but in South America, the average salt intake is between 9-12 g / day 4. This high consumption of sodium in the diet is partly due to westernization of lifestyles and the availability and low cost of ultra-processed foods 5. Thus, in countries from South America has been reported that meat, dairy products, pasta, and seasoning are the main sources of sodium consumption 6. This is aggravated because for people in several of these countries salt is considered not harmful for health 6.
In Ecuador, using 24-hour urine sodium excretion, salt intake has been estimated in average 6.8 g/day 7), cultural habits like add salt to citrus fruits (lemon) and some sweet fruits (mango) 8.
However, there is no information regarding which food items contribute the most to the high salt consumption at a local level. Thus, the objective of this study was to identify the main sources of sodium in the Ecuadorian diet and describe their knowledge, attitudes and practices to reduce its consumption.
METHODS
This was a cross-sectional study with a sample for convenience of 177 workers from the urban area of Quito (2 800 m above sea level) in Ecuador. The study population, was either administrative or academic staff, janitorial, security guards and nursing assistants at a university hospital (Hospital de los Valles) or a higher education institution (Universidad San Francisco de Quito).
Socio-demographic data was collected by a survey di-vided into two sections: first for personal information, which included questions such as name, occupation, sex, age, level of education; and another on medical history in which personal background, family history and consumption (frequency and quantity) of alcohol and cigarette were recorded. The subjects' weight, height and blood pressure were recorded on three different occasions to minimize information bias (mean regression). To measure food consumption, a food frequency questionnaire (FFQ) was de-signed and applied, whilst knowledge, attitudes and practices (KAP) were assessed through a questionnaire.
Ethical considerations
Subjects' participation was voluntary, and it respected the ethical criteria indicated in the Declaration of Helsinki. The study was approved by the Ethics Committee of the USFQ (code 2014-091T).
A food frequency questionnaire (FFQ) with a list of 25 items classified into 12 groups was designed to determine how often and how much those food was consumed. In order to reduce the error bias, answers were obtained based on consumption in the last month 9. The consumption frequencies were grouped into 3 categories: "high frequency", "medium frequency" and "low frequency"
To assess knowledge, attitudes and practices (KAP) an eleven multiple-choice questionnaire was developed, based on the recommendations of the Pan American Health Organization (PAHO) 10 was used. The information collected included: salt use, perception of salt consumption, salt consumption and diseases, and actions to reduce salt consumption. There were three additional questions related to the consumption of processed food, meals outside home and ingredients used in cooking at home (seasoning).
Statistical analysis
The normality of the variables was analyzed with Kolmogorov-Sminov. Data were described according to median and interquartile ranges (IQR) for quantitative variables and categorical variables, as counts and percentages. To analyze the differences between the characteristics of the study population according to food consumption and responses to the KAP questionnaire, parametric (Chi-square test) and non-parametric (Fisher's exact test) tests were used to evaluate the distribution of categorical variables by sex. The statistical analysis was carried out with the statistical program IBM SPSS Statistics V.22.0.0.0 and R for Mac V.3.3.2. A p<0.05 value from two-sided tests were used to define statistical significance.
RESULTS
The study participants were mainly women (64%; n=113) with a mean age of 37.4±8.9 years old, 93.2% of the subjects were considered mestizos (of mixed indigenous and European ancestry) and the majority were educated to secondary level or higher (45.8% and 47.5%, respectively). In addition, 44% of them were overweight and 19% were obese (Table 1).
Table 1 Sociodemographic, anthropometric and clinical data of the study population (N=177)
| Characteristics | Mean | SD | |
|---|---|---|---|
| Age, years | 37.4 | ± | 8.9 |
| Weight, kg | 68.6 | ± | 12.9 |
| Height, m | 1.6 | ± | 0.075 |
| Blood pressure | |||
| Systolic, mmHg | 112.3 | ± | 14.9 |
| Diastolic, mmHg | 73.7 | ± | 10.9 |
| Sex, n (%) | |||
| Male | 36 | ||
| Female | 64 | ||
| Nutritional Statusa n(%) | |||
| Underweight | 1.1 | ||
| Normal | 35.6 | ||
| Overweight | 44.1 | ||
| Obese | 19.2 | ||
| Smoking, Yes n(%) | 10.2 | ||
| Alcohol, Yes n(%) | 37.9 | ||
| Sedentary, Yes n(%) | 52 | ||
| Education, n(%) | |||
| Primary | 6.8 | ||
| Secondary | 45.8 | ||
| Higher | 47.5 | ||
| Ethnicity, n(%) | |||
| Afro-Ecuadorian | 2.3 | ||
| White | 4 | ||
| Indigenous | 0.6 | ||
| Mestizo (mixed-race) | 93.2 | ||
| Personal antecedents n% | |||
| Dyslipidemia | 10.7 | ||
| Cancer | 37.3 | ||
| Obesity | 14.7 |
aUnderweight BMI < 18.5 kg/m2, Normal 18.5 -24.9 kg/m2, Overweight 25-29.9 kg/m2 y Obese >30 kg/m2.
Eleven foods, rich in sodium, were identified as the most highly consumed. Among them, high frequency of consumption included stock cubes (i. e. seasoning) followed by meat products and sugary drinks. All other products were categorized as medium frequency consumption (Figure 1).
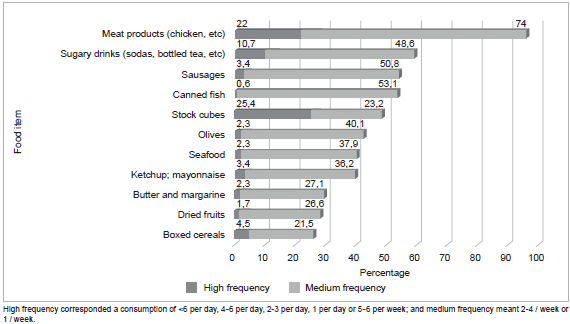
Table II shows that -63% (n=n) of the population studied stated that they never or rarely add salt to their food at the table. On the other hand, 75.7% (n=134) of the participants mentioned that always add salt while cooking food. Almost all participants (98.9%) knew that a high salt intake causes some damage to health, with high blood pressure and kidney stones being the most frequent responses. Although 58.8% (n=104) of respondents though it is very important to reduce salt in their diet, only 38.4% (n=68) takes any systematic action to regulate their salt intake.
Regarding the self-perception about salt intake, the vast majority 77.4% (n=13); of the participants considered they did in the right amount, while there was a 13.6% (n=24) mentioned it was low (very little) and only 9% (n=16) accepted it was high (a lot). Interestingly, although almost all participants, both men and women, agreed that a diet high in salt causes health problems, there was 11.3% (n=20) subjects that considered not important to reduce salt intake. It was also in agreement with 60.5% (n=107) of the participants that mentioned no action is taken to reduce their salt consumption.
On the other hand, only 15.8% (n = 28) of respondents often consume processed foods and 40.7% (n=72) of the population study consume more than 5 times per week meals outside the home. One hundred participants (56.6%) mentioned to use seasoning in the preparation of their food. Further, men were more likely to add salt while cooking and use seasoning in the food (p<0.05) (Table 2).
Table 2 Knowledge, attitudes and practices regarding salt consumption (n=177)
| Question | Total n=177 | Men n=64 | Women n=113 | P value | ||||
|---|---|---|---|---|---|---|---|---|
| Freq. | % | Freq. | % | Freq. | % | |||
| Q1: Do you add salt to food at the table? | Never | 67 | 37.8 | 24 | 37.5 | 43 | 38.1 | 0.8 |
| Rarely | 44 | 24.8 | 17 | 26.6 | 27 | 23.9 | ||
| Sometimes | 32 | 18.1 | 13 | 20.3 | 19 | 16.8 | ||
| Often | 34 | 19.2 | 10 | 15.6 | 24 | 21.2 | ||
| Q2: Do you- or the person that cooks- add salt while cooking? | Often | 10 | 5.6 | 1 | 1.6 | 9 | 8.0 | 0.01 |
| Sometimes | 17 | 9.6 | 3 | 4.7 | 14 | 12.4 | ||
| Never | 9 | 5.1 | 4 | 6.3 | 5 | 4.4 | ||
| Rarely | 7 | 4 | 0 | 0.0 | 7 | 6.2 | ||
| Always | 134 | 75.7 | 56 | 87.5 | 78 | 69.0 | ||
| Q3: How much salt do you think you consume? | Very Little | 24 | 13.6 | 7 | 10.9 | 17 | 15.0 | 0.2 |
| The right amount | 137 | 77.4 | 54 | 84.4 | 83 | 73.5 | ||
| Too much | 16 | 9.0 | 3 | 4.7 | 13 | 11.5 | ||
| Q4: Do you think a diet high in salt causes health problems? | Yes | 175 | 98.9 | 62 | 96.9 | 113 | 100 | 0.06 |
| No | 0 | 0 | 0 | 0.0 | 0 | 0.0 | ||
| Don’t know | 2 | 1.1 | 2 | 3.1 | 0 | 0.0 | ||
| Q5: How important do you think reducing salt intake is? | Highly important | 53 | 29.9 | 24 | 37.5 | 29 | 25.7 | 0.1 |
| Very important | 104 | 58.8 | 31 | 48.4 | 73 | 64.6 | ||
| Not important | 20 | 11.3 | 9 | 14.1 | 11 | 9.7 | ||
| Q6: Do you take any action to reduce your salt consumption? | Yes | 68 | 38.4 | 23 | 35.9 | 45 | 39.8 | 0.6 |
| No | 107 | 60.5 | 41 | 64.1 | 66 | 58.4 | ||
| Don’t know | 2 | 1.1 | 0 | 0.0 | 2 | 1.8 | ||
| Q7: How often do you eat processed food? | Often | 28 | 15.8 | 10 | 15.6 | 10 | 15.9 | 0.05 |
| Sometimes | 60 | 33.9 | 19 | 29.7 | 19 | 36.3 | ||
| Never | 7 | 3.9 | 6 | 9.4 | 6 | 0.9 | ||
| Rarely | 79 | 44.6 | 29 | 45.3 | 29 | 44.2 | ||
| Always | 3 | 1.7 | 0 | 0.0 | 0 | 2.6 | ||
| Q8: How many times a week do you eat outside the home? a | High | 72 | 40.7 | 33 | 51.6 | 39 | 34.5 | 0.08 |
| Medium | 31 | 17.5 | 10 | 15.6 | 21 | 18.6 | ||
| Low | 74 | 41.8 | 21 | 32.8 | 53 | 46.9 | ||
| Q9: Do you use seasoning in your food? | Yes | 100 | 56.5 | 43 | 67.2 | 57 | 50.4 | 0.03 |
| No | 77 | 43.5 | 21 | 32.8 | 56 | 49.6 | ||
a Low= <2 times/week, Medium= 2-4 times/week, High= >5 times/week.
DISCUSSION
Sodium intake is one of the dietary factors that can lead to cardiovascular diseases 2. This study determined the most highly consumed food items with the highest sodium intake in a sample of Ecuadorian adults residing in an urban area were meat products (chicken), followed by sugary drinks such as soda or bottled tea. Likewise, regarding food, sausages, canned fish, seasonings (such as stock cubes), olives, seafood, sauces (ketchup and mayonnaise), butter, nuts and boxed cereals all stand out.
Similar to our study, Sarmugam found that 80% of salt intake comes from processed food and 20% from added salt 11. Also, in a study conducted in 14 Latin American and Caribbean countries, the majority of salt consumed was from processed foods 12, 51.4% of our respondents often consumed processed food which could mean that salt comes mainly from these food items.
The differences observed in dietary behavior and quality of diet are commonly attributed to factors such as age, gender, education and income 11. In our study, most participants added salt to their food at the table or while cooking, therefore the use of tools like KAP questionnaires allows to understand the population's customs, the use of salt at the table, processed food consumption and meals outside the home, something essential to implement initiatives for the reduction in the use of discretionary salt 13.
However, the consumption of ultra-processed foods and beverages in Latin America is growing problem, for example a study conducted in Argentina determined that between 65 and 70% of dietary sodium intake comes from processed foods 14, as these products alone duplicates the recommendation established by the WHO 15. In this study, there was near half of the participants reported the consumption of this products, being consistent with was previously reported by the National Health and Nutrition Survey (ENSANUT-ECU)16.
Regarding knowledge, attitudes and practices, our data were consistent with a study conducted in Greece over 25 years in which 72.4% of its participants always add salt to their food while cooking, but rarely or never use salt on the table (7.6%)17, or in African countries it was found that salt is more used when cooking (92%) and rarely is used on the table (n%)18.
It is important to remark that in this study the majority of participants believed they consumed the right amount of salt (77.4%) but once we correlate this with our own published data in this population (7), there is an inadequate perception of salt consumption. In this sense, Sánchez et al. found that people do not recognize that they have a high consumption of salt since nutritional labeling generates confusion when using the terminology "sodium" 8, or in some cases, although people knows about the nutritional traffic light system, already in place in Ecuador, do not care about to use it 19.
Finally, of the diseases related to a high consumption of salt, our results show that almost the entire population was aware that a diet rich in salt has direct consequences on health, with hypertension being the most widely known disease among the respondents, however other problems related to high salt intake are unknown. However, knowledge of the effects of salt on health does not always translate into good attitudes and practices related to sodium consumption, especially when short-term benefits are practically asymptomatic and people do not perceive the benefits of this measure 20.
We recognize this study has some limitations, i.e. it was a pilot study, then our data is no representative for the whole country; and the lack of information on the sodium content of those foods that are sold in bulk or without packaging.
However, to our knowledge this is the first study in the country that determines the main food sources of sodium in the Ecuadorian diet and the first to measure the consumption of processed food, meals outside the home and ingredients used in cooking food at home in order to determine salt intake.
In conclusion, eleven food items rich in sodium were identified as the most consumed by the population under study, therefore these food items are potential points of focus to regulate the consumption of sodium in the Ecuadorian population. In addition to this, there is a misperception about sodium consumption. Only a small group of subjects take action to help reduce their consumption and this action is not effective. These results bring light to an important public health problem in Ecuador in order to improve local sodium intake ♦

