


 English (pdf)
 Article in xml format
 Article references
 Send this article by e-mail
 Cited by SciELO
  Cited by Google
  Similars in
SciELO
Similars in
SciELO  Similars in Google
 Permalink
Pancreatic cancer is one of the most lethal among the different types of cancer 1, being considered the seventh most common cause of cancer death in both sexes in the world, and most cases and deaths occur in more developed regions 2.
The overall incidence rate is 5.5 and 4.0 cases per 100.000 inhabitants, for males and females respectively. The worldwide mortality rate is of 5.1 for males and 3.8 deaths per 100.000 inhabitants for females. Europe has the highest incidence rates, with 9.9 cases/100.000 inhabitants for males and 7.2 cases/100.000 inhabitants for females 2. In Latin America, considering the incidence rate, it is highlighted Uruguay (9.2 and 6.5 cases per 100.000 inhabitants) and Argentina (7.2 and 5.5 new cases per 100.000 inhabitants), for males and females respectively 3. Moreover, a study points out that the incidence variation will continue to increase until 2030, and the north and northeast regions will present for both sexes, the highest cancer mortality rates in Brazil 4.
Pancreatic cancer is predominantly a cancer of the elderly population, considered rare before an age of 40 years, and less than 20% of cases are diagnosed before an age of 60 5. The risk of developing the disease increases from the age of 50 and is more common in men with a male/female ratio of 1.5 5. Its most common histological type is pancreatic adenocarcinoma, representing 85% of cases 6. Risk factors are classified as: high risk (history of chronic pancreatitis), moderate risk (tobacco, type 2 diabetes mellitus, family history) and low risk (obesity, alcohol intake) 7.
Pancreatic cancer screening is not recommended for the general population because it is a low-risk condition and is indicated for specific population groups, including individuals with a family history of pancreatitis, in first-degree relatives 8.
Like other less developed regions, Latin America is struggling to meet an ongoing commitment agenda, with adequate financial incentives and effective approaches to cancer control. Understanding the geographical distribution of pancreatic cancer and the behavior of rates over time is extremely important, as the analysis of the epidemiological situation in this region is necessary as a tool to support the planning of public health measures for the most vulnerable groups 9,10.
Therefore, the aim of this study was to analyze trends in pancreatic cancer incidence and mortality in Latin America.
METHODS
This is a time-series ecological study based on secondary data available from the International Agency for Research on Cancer (IARC) and World Health Organization (WHO) databases 11,12. Trends in incidence and mortality of malignant pancreatic neoplasia that occurred in Latin American countries were analyzed.
Incident cases of pancreatic malignancy during the 22-year period (1990-2012) were taken from the Cancer Incidence in Five Continents - CI5 PLUS, which included five Population-Based Cancer Registries (PBCRS): four regional registries; Cali (Colombia), Goiania (Brazil), Quito (Ecuador) and Valdivia (Chile) and a national registry; Costa Rica 11. For mortality data, the available information from 17 Latin American countries was analyzed, representing about 90% of the population between 1995 and 2013 12.
The number of cases was extracted and age-adjusted specific rates were calculated for three age groups (0-39, 40-59, 60-74 and above 75 years) and for all ages. Specific age-adjusted rates were calculated using the world standard population according to gender and countries with available data.
Incidence rates and standardized mortality rates were calculated by gender. The ratio of incidence and mortality rates by sex were also calculated. The average annual percent change (AAPC) was estimated for incidence and mortality with a 95% confidence interval (95% CI) in the period. The exception to these analyzes was the 0-39 age group for incidence, as well as Belize, Suriname and Uruguay for mortality due to lack of data in the histo-rical series. Statistical analyzes were performed using the Joinpoint Regression Program software, version 4.5.0.0 13,14.
RESULTS
Between 1990 and 2012, for males, the highest incidence rates for pancreatic cancer were observed in Costa Rica, Valdivia (Chile) and Cali (Colombia), in the age group 75- 85+ years, with rates of 58.7, 57.2 and 48.1 new cases per 100.000 inhabitants, respectively. For females, the highest rates were found in Costa Rica and Cali (Colombia), 55.8 and 50.8 new cases per 100.000 inhabitants, for the age group 75-85+ years respectively, as shown in Table 1.
Table 1 Age-standardized incidence rate (ASIR), number of cases (N), average annual percent change (AAPC), and standardized incidence ratio (SIR) for pancreatic cancer by age and gender in Cali (Colombia), Valdivia (Chile), Costa Rica, Goiania (Brazil) and Quito (Ecuador) for the period 1990-2012
| PBCR | Data availability | Age-groups | Male | Female | SIR | ||
|---|---|---|---|---|---|---|---|
| ASIR (N) | AAPC (95% CI1) | ASIR (N) | AAPC (95% CI1) | ||||
| Cali (Colombia) | 1990-2012 | 0-39 40-59 | 0.1 (12) 5.6 (212) | - -1.3 (-3.2; 0.7) | 0.1 (22) 3.8 (175) | - -0.8 (-3.4;1.8) | 1 1.4 |
| 60-74 | 23.7 (302) | -1.4 (-3.5; 0.7) | 20.6 (346) | -0.3 (-2.0; 1.3) | 1.1 | ||
| 75-85+ | 48.1(199) | -0.6 (-3.2; 2.1) | 50.8 (322) | -0.7 (-2.4; 1.0) | 0.9 | ||
| Total | 4.3 (728) | -1,1 (-2.3; 0.1) | 3.7 (870) | -0.7 (-1.6; 0.3) | 1.1 | ||
| Costa Rica | 1990-2011 | 0-39 40-59 | 0.1 (40) 4.2 (319) | - -1.7 (-3.5; 0.1) | 0.1 (42) 3.4 (260) | - -1.2 (-3.2; 0.9) | 1 1.2 |
| 60-74 | 22.7 (560) | -1.4 (-2.9 ;0.1) | 18.6 (492) | -1.2 (-3.2; 0.9) | 1.2 | ||
| 75-85+ | 58.7 (508) | 0.5 (-1.4; 2.5) | 55.8 (580) | -0.5 (-3.0; 2.0) | 1 | ||
| Total | 4.2 (1427) | -0.8 (-1.9; 0.2) | 3.6 (1376) | -0.9 (-2.4; 0.6) | 1.1 | ||
| Goiania (Brazil) | 1993-2012 | 0-39 40-59 | 0.1 (11) 4.8 (95) | - 4.7* (1.0; 8.6) | 0.1 (15) 4.6 (105) | - 2.6 (-1.5; 6.8) | 1 1 |
| 60-74 | 26.8 (152) | 4.0 (-0.2; 8.4) | 20.5 (151) | 0.2 (-2.0; 2.5) | 1.3 | ||
| 75-85+ | 46.5 (70) | - | 37.0 (85) | - | 1.2 | ||
| Total | 4.4 (328) | 3.5* (0.1; 7.1) | 3.6 (356) | - | 1.2 | ||
| Quito (Ecuador) | 1990-2012 | 0-39 40-59 | 0.1 (3) 7.0 (45) | - -1.9 (-5.2; 1.5) | 0.1 (3) 5.0 (32) | - -1.4 (-4.1; 1.5) | 1 1.4 |
| 60-74 | 25.0 (60) | -0.9 (-3.4; 1.6) | 19.0 (53) | -0.2 (-2.2; 1.9) | 1.3 | ||
| 75-85+ | 40.4 (130) | -0.6 (-2.7; 1.6) | 48.0 (217) | -0.1 (-1.9; 1.8) | 0.8 | ||
| Total | 3.3 (386) | -1.1 (-2.6; 0.4) | 3.6 (542) | -0.4 (-1.8; 1.0) | 0.9 | ||
| Valdivia (Chile) | 1998-2012 | 0-39 40-59 | 0.1 (3) 7.0 (45) | - - | 0.1 (3) 5.0 (32) | - - | 1 1.4 |
| 60-74 | 25.0 (60) | 3.2 (-2.1; 8.8) | 19.0 (53) | -0.5 (-9.3; 9.2) | 1.3 | ||
| 75-85+ | 57.2 (47) | - | 48.6 (54) | - | 1.1 | ||
| Total | 5.0 (155) | 1.6 (-2.6; 6.0) | 3.8 (142) | -0.1 (-7.4; 7.9) | 1.3 | ||
'95% confidence interval.
According to Table 1, increasing trends in incidence of pancreatic cancer occurred in Goiania (Brazil), for males aged 40-59 years (AAPC: 4.7% *; 95% CL1.0; 8.6) and total (AAPC: 3.5%*; 95% CI: 0.1; 7.1). In females, there was stability in all age groups. Figures 1 and 2 complement the observed trends.
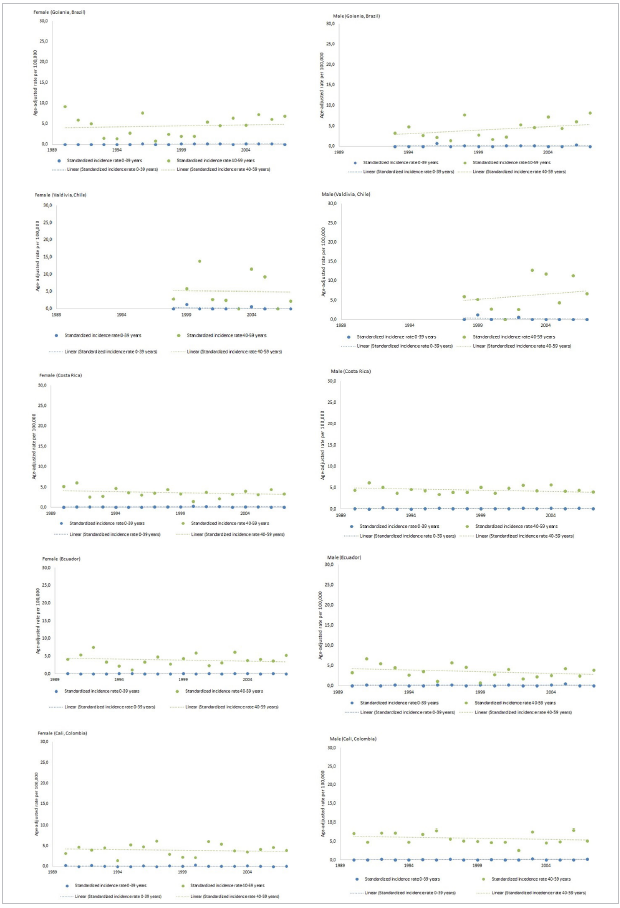
Figure 1 Age-adjusted incidence rate of pancreatic cancer (95% confidence interval) by sex, age 0-39 and 40-59 years, for Cali (Colombia), Costa Rica, Goiania (Brazil), Quito (Ecuador) and Valdivia (Chile) for the period 1990-2012, 95% confidence interval. The gray line represents the trends of the period
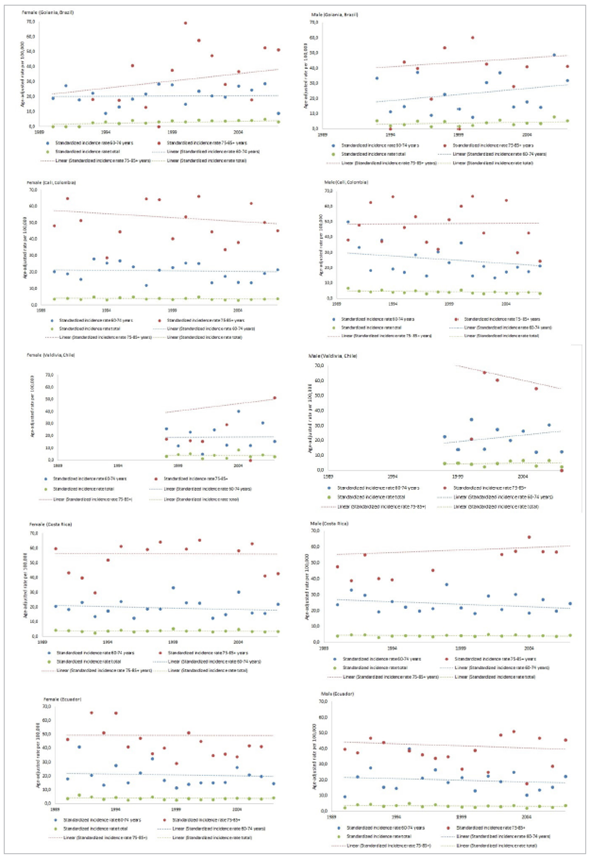
Figure 2 Age-adjusted incidence rate of pancreatic cancer (95% confidence interval) by sex, age 60-74 years, 75-85+ and total for Cali (Colombia), Costa Rica, Goiania (Brazil), Quito (Ecuador) and Valdivia (Chile) for the period 1990-2012, 95% confidence interval. The gray line represents period trends
Between 1995 and 2013, the highest pancreatic cancer mortality rates were observed in Uruguay in the age group 75-85+ years (103.3/100.000 in men and 83.8/100.000 in women) and in Argentina, in the same age group (94.0/100.000 in men and 76.4/100.000 in women). Belize also stands out, with (88.0/100.000 in women) for the same previous age group. According to the age-standardized mortality rate (ASMR), mortality was higher in men in most countries, as shown in Table 2.
Table 2 Age-standardized mortality rate (ASMR) per 100.000, number of deaths (N) and pancreatic cancer mortality rate (SMR) ratio by sex and age group for 17 Latin American populations in the period 1995-2013
| Population | Data availability | Age-groups | ASMR (N) | SMR | |
|---|---|---|---|---|---|
| Male | Female | ||||
| Argentina | 1997-2013 | 0-39 | 0.1 (345) | 0.1 (252) | 1 |
| 40-59 | 8.5 (5867) | 5.6 (4150) | 1.5 | ||
| 60-74 | 43.2 (12836) | 30.2 (11257) | 1.4 | ||
| 75-85+ | 94.0 (9459) | 76.4 (14409) | 1.2 | ||
| Total | 7.6 (28507) | 5.5 (30068) | 1.3 | ||
| Belize | 1997-2013 | 0-39 | 0.2 (4) | 0.1 (1) | 2 |
| 40-59 | 5.8 (18) | 4.3 (14) | 1.3 | ||
| 60-74 | 16.3 (17) | 26.2 (26) | 0.6 | ||
| 75-85+ | 46.2 (13) | 88.0 (29) | 0.5 | ||
| Total | 3.7 (52) | 5.1 (70) | 0.7 | ||
| Brazil | 1996-2013 | 0-39 | 0.1 (1285) | 0.1 (909) | 1 |
| 40-59 | 4.4 (14326) | 3.1 (10783) | 1.4 | ||
| 60-74 | 21.7 (22354) | 16.2 (20409) | 1.3 | ||
| 75-85+ | 56.7 (14090) | 48.9 (19770) | 1.1 | ||
| Total | 4.1 (52055) | 3.1 (51871) | 1 | ||
| Chile | 1997-2013 | 0-39 | 0.1 (102) | 0.1 (85) | 1 |
| 40-59 | 5.0 (1589) | 4.4 (1449) | 1.1 | ||
| 60-74 | 27.4 (3053) | 24.4 (3306) | 1.1 | ||
| 75-85+ | 59.2 (2247) | 60.4 (3729) | 0.9 | ||
| Total | 4.8 (6991) | 4.4 (8569) | 1 | ||
| Colombia | 1997-2013 | 0-39 | 0.1 (252) | 0.1 (209) | 1 |
| 40-59 | 3.2 (2147) | 2.7 (2001) | 1.1 | ||
| 60-74 | 17.7 (3559) | 16.9 (4094) | 0.4 | ||
| 75-85+ | 44.1 (2609) | 44.6 (3814) | 0.9 | ||
| Total | 3.2 (8567) | 3.0 (10118) | 1 | ||
| Costa Rica | 1997-2013 | 0-39 | 0.1 (30) | 0.1 (17) | 1 |
| 40-59 | 4.1 (306) | 3.3 (250) | 1.2 | ||
| 60-74 | 20.3 (518) | 17.6 (482) | 1.1 | ||
| 75-85+ | 68.0 (531) | 60.6 (626) | 1.1 | ||
| Total | 4.1 (1385) | 3.5 (1375) | 1.1 | ||
| Ecuador | 1997-2013 | Male | Female | ||
| 0-39 | 0.1 (84) | 0.1 (67) | 1 | ||
| 40-59 | 2.5 (484) | 2.2 (450) | 1.1 | ||
| 60-74 | 12.8 (854) | 13.6 (990) | 0.9 | ||
| 75-85+ | 34.2 (801) | 36.0 (1047) | 0.9 | ||
| Total | 2.4 (2223) | 2.5 (2554) | 0.9 | ||
| El Salvador | 1997-2013 | 0-39 | 0.1 (29) | 0.1 (31) | 1 |
| 40-59 | 2.2 (171) | 2.0 (188) | 1,1 | ||
| 60-74 | 9.3 (302) | 9.5 (371) | 0.9 | ||
| 75-85+ | 25.1 (236) | 27.0 (356) | 0.9 | ||
| Total | 1.9 (738) | 1.9 (946) | 1 | ||
| Guatemala | 2000-2013 | 0-39 | 0.1 (64) | 0.1 (43) | 1 |
| 40-59 | 2.4 (263) | 2.3 (312) | 1 | ||
| 60-74 | 9.5 (413) | 10.7 (519) | 0.8 | ||
| 75-85+ | 23.9 (310) | 26.0 (424) | 0.9 | ||
| Total | 1.9 (1050) | 2.0 (1298) | 0.9 | ||
| Mexico | 1998-2013 | 0-39 | 0.1 (718) | 0.1 (595) | 1 |
| 40-59 | 4.1 (5958) | 4.0 (6008) | 1 | ||
| 60-74 | 21.3 (10343) | 20.2 (10965) | 1 | ||
| 75-85+ | 43.1 (6976) | 42.0 (9620) | 1 | ||
| Total | 3.7 (23995) | 3.5 (27188) | 1 | ||
| Nicaragua | 1997-2013 | 0-39 | 0.1 (28) | 0.0 (15) | 0 |
| 40-59 | 2.3 (136) | 2.3 (155) | 1 | ||
| 60-74 | 10.2 (201) | 11.5 (265) | 0.8 | ||
| 75-85+ | 28.8 (172) | 26.6 (230) | 1 | ||
| Total | 2.0 (537) | 2.1 (665) | 0.9 | ||
| Panama | 1998-2013 | 0-39 | 0.1 (13) | 0.1 (11) | 1 |
| 40-59 | 3.0 (147) | 2.6 (132) | 1.1 | ||
| 60-74 | 15.3 (273) | 13.4 (247) | 1.1 | ||
| 75-85+ | 45.0 (281) | 43.3 (320) | 1 | ||
| Total | 3.0 (714) | 2.7 (710) | 1.1 | ||
| Paraguay | 1996-2013 | 0-39 | 0.1 (34) | 0.1 (18) | 1 |
| 40-59 | 3.1 (257) | 2.7 (213) | 1.1 | ||
| 60-74 | 13.6 (374) | 13.4 (383) | 1 | ||
| 75-85+ | 38.0 (307) | 36.3 (376) | 1 | ||
| Total | 2.7 (972) | 2.5 (990) | 1 | ||
| Peru | 1999-2013 | 0-39 | 0.1 (139) | 0.1 (116) | 1 |
| 40-59 | 2.3 (828) | 2.6 (983) | 0.8 | ||
| 60-74 | 13.8 (1757) | 13.8 (1908) | 1 | ||
| 75-85+ | 40.5 (1507) | 37.4 (1927) | 1 | ||
| Total | 2.6 (4231) | 2.6 (4934) | 1 | ||
| Suriname | 1995-2013 | 0-39 | 0.2 (6) | 0.1 (3) | 2 |
| 40-59 | 4.9 (42) | 2.7 (24) | 1.8 | ||
| 60-74 | 18.7 (56) | 11.9 (42) | 1.5 | ||
| 75-85+ | 31.6 (23) | 29.2 (32) | 1 | ||
| Total | 3.5 (127) | 2.3 (101) | 1.5 | ||
| Uruguay | 1997-2013 | 0-39 | 0.2 (33) | 0.1 (23) | 2 |
| 40-59 | 10.3 (615) | 6.6 (434) | 1.5 | ||
| 60-74 | 50.4 (1465) | 32.6 (1225) | 1.5 | ||
| 75-85+ | 103.3 (1164) | 83.8 (1812) | 1.2 | ||
| Total | 8.9 (3277) | 6.1 (3494) | 1.4 | ||
| Venezuela | 1996-2013 | 0-39 | 0.0 (53) | 0.0 (52) | 0 |
| 40-59 | 4.3 (1787) | 3.3 (1436) | 1.3 | ||
| 60-74 | 18.7 (2423) | 17.3 (2510) | 1 | ||
| 75-85+ | 46.8 (1570) | 43.4 (2134) | 1 | ||
| Total | 3.6 (5971) | 3.2 (6241) | 1.1 | ||
Finally, Table 3 shows there were increasing trends in the age group 75-85+ years in Chile's male mortality rates (AAPC: 0.88%; 95% CI: 0.00; 1.77), El Salvador (AAPC: 4.03%; 95% CI: 0.60; 7,57), Paraguay (AAPC: 4.23%; 95% CI: 0.73; 7.85) and Peru (AAPC: 1.76%; 95% CI: 0.21; 3.33). For Mexico, there was a trend towards a reduction in mortality (AAPC: -0.98%; 95% CI: -1.53; -0.43). In females, there were increasing trends in mortality rates for Brazil (AAPC: 1.05%; 95% CI: 0.72; 1.37), El Salvador (AAPC: 2.69%; 95% CI: 0.03; 5.42), Chile (AAPC: 1.01%; 95% CI: 0.59; 1.44), Ecuador (AAPC: 1.98%; 95% CI: 0.47; 3.52) and Colombia (AAPC: 1.28%; 95% CI: 0.70; 1.86). There was a downward trend only for Costa Rica (AAPC: -2.46%; 95% CI: -3.77; -1.13).
Table 3 Pancreatic cancer mortality trends by sex and age group for 17 Latin American populations from 1995 to 2013
| Population | Data availability | Age-groups | AAPC (95% CI) | |
|---|---|---|---|---|
| Male | Female | |||
| Argentina | 1997-2013 | 0-39 | -0.82 (-2.82; 1.24) | 1.14 (-1.42; 3.77) |
| 40-59 | -0.78 (-1.27; -0.30) | 0.18 (-0.47; 0.82) | ||
| 60-74 | 0.01 (-0.46; 0.48) | 0.29 (-0.12; 0.69) | ||
| 75-85+ | 0.04 (-0.40; 0.49) | 0.04 (-0.37; 0.45) | ||
| Total | -0.18 (-0.47; 0.10) | 0.20 (-0.08; 0.49) | ||
| Belize | 1997-2013 | 0-39 | - | - |
| 40-59 | - | - | ||
| 60-74 | - | - | ||
| 75-85+ | - | - | ||
| Total | - | -5.88 (-11.80; 0.44) | ||
| Brazil | 1996-2013 | 0-39 | 0.34 (-0.77; 1.45) | 0.78 (-0.86; 2.45) |
| 40-59 | 0.93 (0.57; 1.29) | 2.32 (1.94; 2.71) | ||
| 60-74 | 1.09 (0.76; 1.42) | 1.38 (1.07; 1.69) | ||
| 75-85+ | 0.27 (-0.21; 0.75) | 1.05 (0.72; 1.37) | ||
| Total | 0.81 (0.56; 1.06) | 1.46 (1.25; 1.66) | ||
| Chile | 1997-2013 | 0-39 | 2.64 (-1.42; 6.88) | -0.09 (-4.47; 4.48) |
| 40-59 | 0.64 (-0.49; 1.77) | 0.72 (-0.26; 1.71) | ||
| 60-74 | 0.52 (-0.11; 1.16) | 1.17 (0.37; 1.98) | ||
| 75-85+ | 0.88 (0.00; 1.77) | 1.01 (0.59; 1.44) | ||
| Total | 0.62 (0.14; 1.10) | 0.98 (0.46; 1.51) | ||
| Colombia | 1997-2013 | 0-39 | -0.68 (-2.75; 1.44) | -2.08 (-5.62; 1.60) |
| 40-59 | 0.34 (-0.59; 1.29) | -0.59 (-1.63; 0.46) | ||
| 60-74 | -0.51 (-1.06; 0.05) | -0.90 (-1.39; -0.42) | ||
| 75-85+ | 0.51 (-0.38; 1.42) | 1.28 (0.70; 1.86) | ||
| Total | 0.01 (-0.38; 0.40) | -0.24(-0.58;0.11) | ||
| Costa Rica | 1997-2013 | 0-39 | - | - |
| 40-59 | -0.70 (-2.28; 0.92) | 0.33 (-2.49; 3.24) | ||
| 60-74 | -0.43 (-2.21; 1.39) | -0.77 (-2.95; 1.46) | ||
| 75-85+ | -1.62 (-3.37; 0.16) | -2.46 (-3.77; -1.13) | ||
| Total | -0.87 (-2.08; 0.36) | -1.19 (-2.70; 0.34) | ||
| Ecuador | 1997-2013 | 0-39 | -2.63 (-9.02; 4.21) | -0.97 (-5.82;4.12) |
| 40-59 | 0.16 (-1.41; 1.76) | -1.64 (-3.43;0.17) | ||
| 60-74 | -0.49 (-1.86; 0.89) | -1.52 (-2.89;-0.13) | ||
| 75-85+ | 0.64 (-0.06; 1.34) | 1.98 (0.47;3.52) | ||
| Total | -0.10 (-0.97; 0.78) | -0.55 (-1.57;0.48) | ||
| El Salvador | 1997-2013 | 0-39 | - | - |
| 40-59 | 3.77 (0.34; 7.33) | 5.83 (1.81;10.02) | ||
| 60-74 | 2.88 (0.38; 5.43) | 2.32 (-0.18;4.88) | ||
| 75-85+ | 4.03 (0.60; 7.57) | 2.69 (0.03;5.42) | ||
| Total | 3.50 (1.39; 5.65) | 3.27 (1.41; 5.17) | ||
| Guatemala | 2000-2013 | 0-39 | - | -5.93 (-12.78; 1.45) |
| 40-59 | -0.50 (-3.18; 2.24) | -0.57 (-2.40; 1.29) | ||
| 60-74 | -0.18 (-3.47; 3.22) | 2.48 (-0.02; 5.04) | ||
| 75-85+ | 0.93 (-2.47; 4.44) | -0.45 (-2.70; 1.85) | ||
| Total | -0.30 (-2.41; 1.86) | 0.71 (-0.65; 2.10) | ||
| Mexico | 1998-2013 | 0-39 | -0.67 (-1.78; 0.45) | -1.20 (-2.75; 0.36) |
| 40-59 | -0.74 (-1.45; -0.03) | -1.45 (-2.01; -0.88) | ||
| 60-74 | -0.73 (-1.35; -0.12) | -0.17 (-0.64; 0.30) | ||
| 75-85+ | -0.98 (-1.53; -0.43) | -0.41 (-0.83; 0.01) | ||
| Total | -0.80 (-1.30; -0.30) | -0.55 (-0.83; -0.27) | ||
| Nicaragua | 1997-2013 | 0-39 | - | - |
| 40-59 | 4.00 (-0.95; 9.19) | 1.91 (-1.78; 5.74) | ||
| 60-74 | 2.09 (-1.68; 6.00) | 2.51 (0.36; 4.71) | ||
| 75-85+ | 1.38 (-3.38; 6.37) | 3.86 (-0.44; 8.34) | ||
| Total | 1.82 (-0.82; 4.53) | 2.66 (0.47; 4.90) | ||
| Panama | 1998-2013 | 0-39 | - | - |
| 40-59 | 3.18 (-3.18; 9.96) | 0.04 (-2.56; 2.71) | ||
| 60-74 | -1.21 (-4.19; 1.86) | 1.19 (-0.92; 3.35) | ||
| 75-85+ | 1.20 (-1.59; 4.08) | 1.00 (-2.06; 4.15) | ||
| Total | 0.33 (-2.01; 2.72) | 0.90 (-0.91; 2.74) | ||
| Paraguay | 1996-2013 | 0-39 | - | - |
| 40-59 | 1.45 (-0.82; 3.76) | 2.48 (0.07; 4.95) | ||
| 60-74 | 1.30 (-0.88; 3.54) | 3.62 (1.96; 5.31) | ||
| 75-85+ | 4.23 (0.73; 7.85) | 1.76 (-0.15; 3.70) | ||
| Total | 2.06 (0.65; 3.48) | 2.78 (1.81; 3.77) | ||
| Peru | 1999-2013 | 0-39 | -2.34 (-5.64; 1.08) | 0.51 (-4.44; 5.72) |
| 40-59 | 1.30 (0.28; 2.33) | 1.61 (0.15; 3.09) | ||
| 60-74 | 1.76 (0.36; 3.17) | 2.25 (0.68; 3.85) | ||
| 75-85+ | 1.76 (0.21; 3.33) | 1.37 (-0.25; 3.03) | ||
| Total | 1.56 (0.53; 2.61) | 1.82 (0.65; 3.00) | ||
| Suriname | 1995-2013 | 0-39 | - | - |
| 40-59 | - | - | ||
| 60-74 | - | - | ||
| 75-85+ | - | - | ||
| Total | 3.74 (-0.43; 8.08) | - | ||
| Uruguay | 1997-2013 | 0-39 | - | - |
| 40-59 | - | - | ||
| 60-74 | - | - | ||
| 75-85+ | - | - | ||
| Total | - | - | ||
| Venezuela | 1996-2013 | 0-39 | -2.81 (-5.61;0.08) | -2.13 (-5.42;1.26) |
| 40-59 | 0.52 (-0.39;1.44) | 0.30 (-0.44;1.05) | ||
| 60-74 | -0.12 (-1.12;0.89) | 0.00 (-0.65;0.66) | ||
| 75-85+ | 0.42 (-0.26;1.10) | 0.17 (-0.57;0.92) | ||
| Total | 0.12 (-0.49; 0.74) | 0.06 (-0.33; 0.46) | ||
In the age group 40-59 years, there was a tendency for the mortality rate to increase in El Salvador (AAPC: 3.77%; 95% CI: 0.34; 7.33) and (AAPC: 5.83%; 95% CI: 1.81; 10.02) for male and female, respectively. While in Argentina there was a tendency to reduce the mortality rate (AAPC: -0.78%; 95% CI: -1.27; -0.30) for males aged 40-59 years.
DISCUSSION
The present study is a precursor in analyzing the trends of incidence and mortality from pancreatic cancer in Latin America. It is also the most complete one, considering the largest number of countries in this continent and demonstrating the relevance of this disease by age groups and sex. Thus, it was found that the highest incidence for pancreatic cancer was recorded for the age group 60-74 years. This rate was higher in males, similar in other studies, such as in Brazil 15, China (4.01 and 2.72 new cases per 100.000 inhabitants), for men and women, respectively 16 and for Europe 17. Regarding incidence trends, non-significant variations were found for both sexes. This result is opposite to the found for the United States (male: AAPC: 0.8%; p <0.05 and female: AAPC: 0.9%; p0.05) 18.
Several modifiable and non-modifiable risk factors have been associated with pancreatic cancer such as smoking, considered the main environmental factor for this cancer worldwide, present in 30% of those affected which, when associated with alcohol, potentiates this risk; chronic pancreatitis; diabetes mellitus; genetic factors, obesity and physical inactivity 19-21. Moreover, the increase in the senile population further increases the incidence of this cancer in the population.
Concerning smoking, a meta-analysis study points out that the use of tobacco, with or without smoke, increases the risk of pancreatic cancer, as it presents toxic and carcinogenic substances which are associated with disordered celular growth and transformation, reduction of cell cycle repair and defective cell apoptosis 22. Moreover, authors 23 emphasize that the amount of daily cigarettes and duration of smoking also influence, as the relative risk increased from 1.6 per 10 cigarettes/day to 2.2 per 30 cigarettes/day and 1.3 per 10 years of smoking to 1.8 per 30 years of smoking. However, there are positive effects when smoking decreases. Therefore, the adoption of harm reduction policies as a strategy for the prevention of this cancer becomes evident.
Regarding the chronic pancreatitis relationship, the influence of this pathology is due to the local inflammatory process 24, besides, mutations in genes such as: cationic trypsinogen (PRSS1); serine protease inhibitor Kazal type 1 (SPINK1); chymotrypsin C (CTRC) or trans-membrane conductance regulatory genes (CFTR), as well as alcohol abuse has also been reported in countries such as Australia, Japan, China and India as one of the most common factors that increase susceptibility to pancreatic cancer 25,20. Concerning diabetes, epidemiological evidence shows an association with cancer suggested by a tumorigenic effect of hyperglycemia and the mitogenic effect of hiperinsulinemia, causing pancreatic metastasis and proliferation. Due to the glucose dependence of cancer cells, individuals with high glycemic indexes can present a fast growth of these cells, increasing the aggressiveness and mortality 26-28.
The worldwide prevalence of type 2 diabetes mellitus in 2013 was 8.3% of adults, with a rate of 9.9% for 2030 29. In the Americas, the number of individuals with diabetes was estimated at 35 million for the year 2000 and projected to 64 million by 2025 30. The prevalence of this disease in Chile was 9.4% in 2009 30, and in Brazil, according to the 2013 National Health Survey, the prevalence was 6.2%, with an estimated 9 million people with diabetes in the country 31. Given this scenario, there is a need for effective actions aimed at controlling and preventing this disease, especially in primary care, since DM is considered a sensitive condition for primary care, which is the main articulator of care 32.
Pancreatic cancer has a median survival of 3 to 6 months (16), and a relative 5-year survival rate of only 8.2% 33, so it has a high lethality rate. Mortality trends for Brazil, Peru, El Salvador, Paraguay, Nicaragua, and Chile have changed significantly. These results corroborate those of European Union countries, which showed a significant upward trend for both sexes between 1998 and 2012 (AAPC = 0.4% for males and AAPC = 0.8% for females) 34. In Canada, on the other hand, the analysis of mortality trends from 1992 to 2005 found that there was a decrease in age-standardized mortality rates from 7% for men (from 11.18 per 100.000 in 1992 to 10.38 per 100.000 in 2004) and a slight increase of 3% for women (from 7.98 per 100.000 in 1992 to 8.23 in 2004) (35).
In a population-based study conducted in Brazil from 2001 to 2015, stability in female mortality rates was observed (AAPC=0.4%; 95% CI: -0.2; 1.0). It also presented a significant increase in the mortality trend for men (AAPC = 3.7%; 95% CI: 0.6-7.0) 15, differing from our study, which showed an increase for both sexes. Accordingly, a study that sought to examine global trends in incidence and mortality demonstrated increased mortality in many countries, with a higher incidence among men. However, it has been elucidated that in some countries, such as Finland, Denmark and North American countries, this increase affects both sexes 36. Given this, it may be inferred the relationship of the adoption of different methodologies of correction of sub-registration of the data used by the studies, differing the results.
From this perspective, pancreatic cancer is a major challenge for Latin America. The epidemiological, nutritional and demographic transitions observed in recent decades have resulted in increased morbidity and mortality from chronic noncommunicable diseases such as diabetes and obesity, which may impact future rates of pancreatic cancer. Consequently, there is a need for the organization of strategies for coping with noncommunicable chronic diseases, as well as for modifiable risk factors such as overweight, physical inactivity, smoking and excessive alcohol consumption 3.
Regarding the mortality profile observed in these countries, it may represent a reflection of the fragmen-tation of health systems, which provide minimal care, with delays in the diagnosis and treatment of cancer 3. To change this situation, it is necessary to increase investment to understand this disease, promote the search for therapeutic targets that can be tested in clinical trials, and identify early detection strategies 15.
Regarding the availability of incidence data, there was a lack of data for the age group from 0 to 39 years old for all countries, making it impossible to analyze this age group. Regarding mortality, there were no data available from Belize and Uruguay. Nevertheless, despite these limitations, the data used in this study were validated by the International Agency for Research on Cancer (IARC) and World Health Organization (WHO), thus being able to describe mortality in Latin American countries.
This study analyzed the incidence of pancreatic cancer in four Latin American cities and one country (Costa Rica) and the mortality trends for pancreatic cancer in 17 Latin American countries. There were trends of stable incidence for females in all countries and age groups. Regarding mortality, there were stability trends in most Latin American countries for both sexes, but it has been highlighted those with an increasing trend, such as Brazil, El Salvador, Peru, Paraguay, Nicaragua and Chile ♣

