


 English (pdf)
 Article in xml format
 Article references
 Send this article by e-mail
 Cited by SciELO
  Cited by Google
  Similars in
SciELO
Similars in
SciELO  Similars in Google
 Permalink
To date, no country has spared the spread of corona-virus. According to a recent report by the World Health Organization 1, the total number of confirmed cases is nearly 278 million and the cumulative deaths is 5.4 million which consists of a mortality rate of 0,019. Specifically, the high mortality rate associated with Covid-19 is a challenge for countries worldwide. Accordingly, figures show heterogeneity and dispersion in mortality rates among countries and regions, thus, factors likely affecting the levels of mortality rates and that can be sources of divergences are worth studying. In another context, to face the Covid-19 pandemic, each country chose its strategy and reacted more or less quickly and more or less clearly to an unprecedented health hazard. Certainly, Lockdown strategies that contain the population and close borders undoubtedly play an important role in the fight against epidemics 2. However, beyond these measures and before virus propagation, certain health systems seemed better prepared than others to confront the pandemic. This fact was confusing when we recorded the highest number of confirmed cases and deaths in some countries characterized by high-performing health systems, a strange matter that was discussed by 3.
In this context of damages caused by the pandemic, we believe that the most dangerous effects are public health problems (e. g., mortality and pressure on health systems) 4, moreover, we think that Covid-19 is not simply a public health challenge; indeed, it caused the most severe socio-political crisis, like the SARS epidemic 5. Another outcome of the pandemic is the economic impacts, globally, the spreading channels are mainly coming from the failure of China and USA, both made 35 % of global Gross Domestic Product (GPD) 6.
Specifically, the main objective of the current study was to estimate the determinants (or sources of variation) of mortality rates caused by coronaviruses at the macro level (among countries and regions). We can conceptualize specific mortality models on two levels: micro and macro. At a micro-level (clinical and epidemiological studies), several studies have been conducted to analyze and estimate the effects of socioeconomic, demographic and genetic factors on mortality from Covid-19. Some studies have attempted to analyze the association between diabetes and Covid-19, such as 7,8, and other studies have estimated the effects of cardiovascular diseases 9,10, and ageing 11,12.
Note that the mortality rates were estimated as the total deaths divided by the total number of confirmed cases from 1-1-2020 to 3-12-2021 in 176 countries. Estimating mortality rates based on the total number of infected cases is more objective and reliable than dividing it by the total population. Dividing by the total population is considered a biased measure, especially because this virus did not affect (except in rare cases) the category of people aged between 1 and 20 years (in some countries, from 1 to 25 years), especially if we consider countries with a large population size or vice versa. Thus, the main idea of this paper is to check whether what has been revealed at the micro-level remains valid at the macro-level. For example, previous work on a micro-level showed that diabetes and cardiovascular disease were risk factors for death by Covid-19, see 7,8 for diabetes factor, and 9 for cardiovascular disease; consequently, we attempted to test whether countries with a higher prevalence of diabetes and cardiovascular diseases recorded the highest mortality rates due to Covid19? The same idea for age factor, micro-level studies (or clinical analysis) depicted that mortality risk of Covid-19 vary between young and elderly patients, see 11-13, the aim of this study was to investigate the if countries with high percentage of elderly population recorded high mortality rates compared to countries with small percentage?
In the literature, we found three main studies that worked on this topic: the first was conducted by 14 to estimate the sources of variations among 196 countries in per capita mortality rates due to Covid-19, where they applied the multivariable linear regression model. The second study was conducted by 15, who applied a beta regression model to estimate the effects of health, social, and economic factors on mortality rates during the pandemic in 129 countries. The third was achieved by 16 to analyze the determinants of mortality rates from Covid-19 in Europe during the first wave of the pandemic, and the beta regression model was fitted. As a difference between these studies, we worked on mortality rates estimated using the total number of confirmed cases, and not by the volume of the population, as studied by 14. The second study was based on the European continent which focused on the first wave of the pandemic. At this point, the study by 15 covered a short period compared to our study; such a difference can reveal a likely instability in the estimated coefficients. However, in contrast to 15, when they considered the regions as dummy variables in modeling, we designed the beta regression models for each region, and fitted a beta model for Africa, Asia, America, and Europe; This design should allow us to highlight the difference between the regions in terms of the effects of each variable on the mortality rate.
In light of previous studies, some covariates were adjusted in the modelling process to estimate their effects on mortality rates. As a regression method, statistically, when performing regression on finite data as averages, probabilities, or ratios, it can create significant statistical and metric problems first, when predicting the values of the dependent variable the regression model can give values out of range (0.1), which makes the predictions unrealistic. Second, data structures, such as rates or ratios often do not follow a normal distribution, making the ordinary least squares approach unsuitable for model estimation. For this and specification for these two points, the Beta model came to provide optimal solutions and a mathematical and standard form suitable for this structure of data 17. As a drawback of a pervious study, unfortunately, this methodological point was not taken into account by 14 when they fitted a multivariable linear regression model rather than a Beta regression model.
The rest of the paper is organized as follows, section2 presents the theoretical aspect of the beta regression model and a wide description of the dataset. Section3 was devoted to the estimation results of the regression models; section4 covers the discussion of the results and finally section5 summarizes the results of the study and draws conclusions.
MATERIAL AND METHODS
Methods and Data Beta Regression model
The dependent variable in this study is the mortality rate (estimated as total deaths divided by total confirmed cases) due to Covid-1g over the period (2020 to 2021). This variable is a continuous and takes its values in the unit interval [0, 1]. In the regression analysis, the more appropriate method to fit such a variable is fractional regression or more specifically the beta regression model (BR); this model is a type of the generalized linear family models. Historically, the BRs models were developed firstly by 17. With a slight modification, we define below the density of the beta regression model that takes in consideration a set of covariates x:
The conditional mean of the model as μ x = E(y│x), generally we work on a logit link function between }i x and covariates, which is defined as g (μ x )=1n (μ x (1 - μ x ) -1 ). We define J as scale parameter, however, the conditional variance can be written as Var(y | x)= μ x (1 - μ x )(1 + Jx)-1 - As an extension of the BR models, we can further link the scale parameter to the set of covariates, for more detail see 18.
When generalizing the density in Equation 1 to the n-sample, we find the likelihood function, which can be written in its log-transformation as
Consequently, the estimation was performed using the maximum likelihood (ML) method, where we used analytical gradients by taking the estimations of the linear regression of the transformed response as the starting values. Noted that a Bayesian inference of beta regression models has been developed and widely applied in different fields, see (1g), currently the Bayesian inference is currently considered a competitive approach to the ML method. Similarly, 20 attempted to provide an overview and comparison between these two inference approaches for estimating beta regression.
Data and Software
The data from this study contain a final sample size of 176 countries from 4 continents (Africa, Asia, America (south and north) and Europe). We excluded ten countries due to missing data. However, missing values are estimated by the "multiple imputation" method based on the MCMC principle 21. Below, we have summarized all the regression variables.
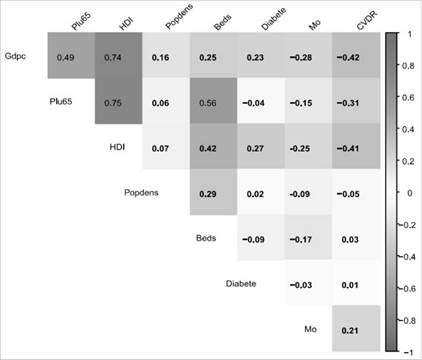
The data sources were mainly the Our World In Data website, developed by 22, World Bank database (https://data.worldbank.org/), and World Health Organization (https://covid1g.who.int/). For the statistical software used in this study, different R packages were used, mainly: ("fitdistrplus " v. 1.1-6) developed by 23 to fit a beta distribution to the mortality rates. ("betareg" v.3.1-4) developed by 24 to fit a beta regression model, and the ("corrplot" v. 0.g2) developed by 25 to estimate and plot the correlation matrix among the variables (Cuadro 1).
Cuadro 1 The variables used in the regression model
| Variable | Description |
|---|---|
| Mo | Mortality rate (as dependent variable) that was estimated as: the number of total death divided by number of total confirmed cases |
| Popdens | Number of people divided by land area, measured in square kilometers, most recent year available |
| Plus65 | Share of the population that is 65 years and older, most recent year available |
| Gdpc | Gross domestic product at purchasing power parity (constant 2011 international dollars), most recent year available |
| CVDR | Death rate from cardiovascular disease in 2017 (annual number of deaths per 100,000 people) |
| Diabet | Diabetes prevalence (% of population aged 20 to 79) in 2017 |
| Beds | Hospital beds per 1,000 people, most recent year available since 2010 |
| E0 | Life expectancy at birth in 2019 |
| HDI | A composite index measuring average achievement in three basic dimensions of human development-a long and healthy life, knowledge and a decent standard of living. Values for 2019, imported from http://hdr.undp.org/en/indicators/137506 |
RESULTS
Descriptive analysis
In this subsection, we describe and summarize the level and dispersion of the covariates during the study period. Table 1 summarizes the dataset based on the mean values and standard deviation (SD) worldwide and across four continents (Asia, Europe, Africa, and America).
Table 1 Description of the covariates in the study
| World | Asia | Europe | Africa | America | ||||||
|---|---|---|---|---|---|---|---|---|---|---|
| Variable | Mean | SD | Mean | SD | Mean | SD | Mean | SD | Mean | SD |
| Mo | 0.0206* | 0.0192 | 0.0200 | 0.0294 | 0.0162 | 0.0096 | 0.0222 | 0.0141 | 0.0259 | 0.0179 |
| Popdens | 347.41 | 1625.24 | 585.83 | 1537.95 | 587.59 | 2869.26 | 103.65 | 129.68 | 130.61 | 147.72 |
| Plu65 | 8.80* | 6.13 | 6.77 | 4.85 | 16.76 | 3.88 | 3.69 | 1.68 | 8.81 | 3.54 |
| Gdpc | 19070.2* | 19378.9 | 23293.9 | 25194.7 | 32371.3 | 17839.1 | 5801.6 | 6513.5 | 16025.2 | 10646.8 |
| CVDR | 256.67* | 115.76 | 286.97 | 144.10 | 232.94 | 122.52 | 286.91 | 73.89 | 196.30 | 68.79 |
| Diabete | 7.73* | 3.78 | 9.37 | 3.67 | 6.56 | 1.99 | 5.70 | 4.06 | 9.73 | 2.78 |
| Beds | 3.05* | 2.36 | 2.83 | 2.64 | 5.03 | 2.43 | 2.10 | 1.54 | 2.23 | 1.32 |
| HDI | 0.73* | 0.15 | 0.74 | 0.12 | 0.87 | 0.08 | 0.57 | 0.11 | 0.76 | 0.08 |
Source: Author's estimation. (*) means that the differences were statistically significant (at 0.05 level) between the Means of the variables across the four continents; noted that the Fisher-test was applied.
According to the results in table 1, the mortality rate due to Covid-1g worldwide is 0.0206, which means that among 10,000 confirmed cases of Coronavirus 206 persons have died. However, this rate was not the same across the four continents. During the study period, the Americas (North and South) reported the highest mortality rate of 0.02 5g, followed by Africa, which reported a mortality rate of 0.0222. The Asian region was ranked third, with a mortality rate of 0.02; however, the lowest mortality rate was reported in the European region (0.0162). Note that these mortality rates were not homogenous among the countries in each region. We estimated the coefficient of variation (CV= (Mean/SD) x 100), and the results clearly showed that the rates were more dispersed in the European region (CV=167.7 %), followed by the African region (CV=157.4 %), the Americas (CV=144.7%), and finally the Asian region (CV = 68.1 %). For some details, in the European region, Norway recorded the lowest mortality rate (0.003g), Bosnia-Herzegovina recorded the highest rate (0.0457); in the Asian region, Qatar first had the lowest mortality rate (0.0025), and Syria recorded the highest mortality rate (0.0571), followed by Twain and China; however, in the African region, Seychelles recorded the lowest mortality rate (0.0053) and Malawi had the highest mortality rate (0.0372); in the Americas, Cuba recorded the lowest rate (0.0086), and Peru had the highest mortality rate of 0.08g8 , approximately ten times the rate recorded in Cuba.
The summary statistics of the explanatory variables showed different levels between regions, indicating that the European region reported the highest share of the elderly population (65 years) with 16.8 % of the total population, followed by the Americas (8.8%). In terms of GDP per capita and HDI index, the countries of the European region recorded the highest levels, followed by the Asian countries, whereas the African regions were characterized by the lowest GDP per capita and HDI index. As health factors, cardiovascular diseases, and diabetes diseases, their prevalence is heterogeneous among the four regions, with a global prevalence of 256.67 (per 100,000 people) and 7.7% (% of the population aged 20 to 7g), respectively, for CVDR and diabetes. However, the African region recorded the highest death rate from cardiovascular, whereas this continent showed the lowest prevalence of diabetes compared to the other regions.
The bivariate analysis and associations among the study variables were conducted using the linear correlation matrix in Figure 1. We focused only on analyzing the linear correlation between the mortality rates from Covid-19 and the selected variables, and the estimated correlation coefficients showed a weak negative correlation for all variables. The sign of the coefficients was logical except for the share of the population aged 65 years or older, which is expected to be positive under the hypothesis that countries with a high proportion of the elderly population recorded the highest mortality rates due to Covid-19, this result was well analyzed in detail in the next section. However, we found the same pattern of association between Mo and the set of covariates in the four regions. The next step in the analysis is to estimate beta regression models to measure the effects (or impact) of these factors on variations in mortality rates.
Results of Beta regression models
First, we tested if the data of mortality rates follow a beta distribution, for that purpose we used the Kolmogorov-Smirnov (KS) test, this test is appropriate for continuous random variables. In application the "fitditrplus" R package was used and the results were reported in Table 2 and Figure 2.
Table 2 Results of Kolmogorov-Smirnov tests
| Region | Calculated D n | Tabulated D n,α=0.005 | Fitted Beta model Be(μ,j) | Decision |
|---|---|---|---|---|
| World | 0.0614 | 0.1008 | Be(2.16, 107.41) | Accept |
| Afrlca | 0.0646 | 0.1885 | Be(2.61, 115.12) | Accept |
| America | 0.2049 | 0.2242 | Be(2.83, 102.47) | Accept |
| Asia | 0.0889 | 0.2050 | Be(1.61, 97.71) | Accept |
| Europe | 0.1079 | 0.2027 | Be(2.96, 179.75) | Accept |
Source: Author's estimation. In a standard Kolmogorov-Smirnov table, the critical values were estimated as
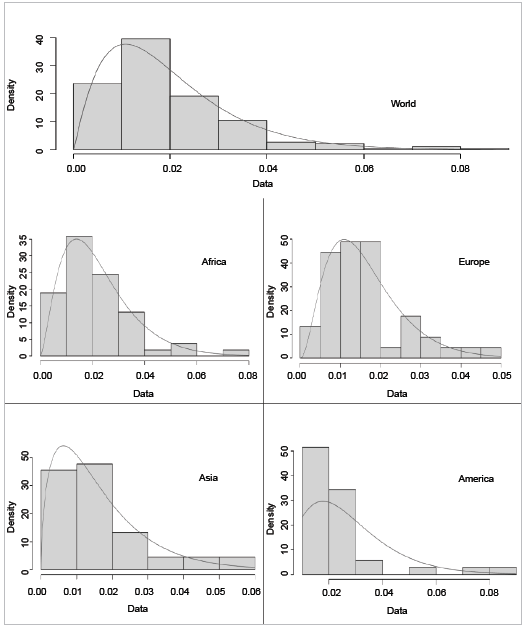
Table 2 shows the results of the KS test for five samples of mortality rates: first, we test the hypothesis that the mortality rates from Covid-19 in 176 countries (world); then, we test this hypothesis for the four continents (Africa, America, Asia, and Europe). We found that the estimated values of the D n test were all less than the tabulated values of the K-S test for a significance level of 0.05; thus, we accept that the mortality rates can be fitted by a beta distribution, where the estimated parameters of these distributions are shown in the fourth colon of Table 2.
Figure 2 summarizes the test results of the five samples: full sample, Africa, Asia, America, and Europe. The dashed histograms represent the observed mortality rates, and the red curves are the fitted beta distributions. However, the density of the beta distribution Be(μ J) can take different forms depending on the values of the two parameters μ and J . In our case as μ>1, J>1, so we have a uni-model beta distribution, note that when μ = J then the density is symmetrical around ½.
The results of the parameter estimates of the five beta regression models are presented in (Tables 3, 4). In the whole sample (world model), the results showed that countries with a high GDP per capita, and a high share of the population aged 65 years or older were significantly associated with mean mortality rates. However, the prevalence of diabetes and cardiovascular disease had a small positive but insignificant effect on the mean mortality rate. However, the population density and number of beds (hospital beds per 1,000 people) had a negative but insignificant effect on the mean mortality rate.
Table 3 Predictors of mortality rate using beta regression modelin 176 countries
| Variables | Coef. | Std. Err. | z | P>|z| | [95% Conf. | Interval] |
|---|---|---|---|---|---|---|
| Popdens | -.00002 | .0000343 | -0.580 | 0.561 | -.0000873 | .0000473 |
| Plu65 | .0263977 | .0138184 | 1.910 | 0.056 | -.0006858 | .0534811 |
| Gdpc | -.0000166 | 0.00000343 | -4.830 | 0.001 | -.0000233 | -0.00000985 |
| CVDR | .0004843 | .0004957 | 0.980 | 0.329 | -.0004872 | .0014559 |
| Diabete | .0055054 | .0149592 | 0.370 | 0.713 | -.0238141 | .0348249 |
| Beds | -.0188098 | .0258823 | -0.730 | 0.467 | -.0695381 | .0319186 |
| HDI | -.5780984 | .7900581 | -0.730 | 0.464 | -2.126584 | 0.970387 |
| Intercept | -3.556776 | .4770825 | -7.460 | 0.001 | -4.491841 | -2.621712 |
| Scale | ||||||
| Gdpc | .0000262 | 0.0000067 | 3.910 | 0.001 | .0000131 | .0000393 |
| Intercept | 4.480005 | .1960587 | 22.850 | 0.001 | 4.095737 | 4.864273 |
Source: Author's estimation.
Table 4 Estimation of the Beta regression mode for the four continents
| Continent | Variables | Coef. | Std. Err. | z | P>|z| | [95% Conf. | Interval] |
|---|---|---|---|---|---|---|---|
| America (n=35) | Popdens | .0000106 | .0008169 | 0.010 | 0.991 | -.0015905 | .0016116 |
| Plu65 | -.0893938 | .0359814 | -2.480 | 0.013 | -.1599161 | -.0188716 | |
| Gdpc | -0.000008 | .0000136 | -0.640 | 0.523 | -.0000352 | .0000179 | |
| Cvdr | -.0005873 | .0024211 | -0.240 | 0.808 | -.0053325 | 0.00416 | |
| Diabete | .0088194 | .0387557 | 0.230 | 0.821 | -.0671404 | .0847793 | |
| Beds | -.0497579 | .0986112 | -0.500 | 0.614 | -.2430324 | .1435165 | |
| Hdi | 2.61447 | 3.67012 | 0.710 | 0.476 | -4.57883 | 9.80778 | |
| Intercept | -4.54444 | 2.87 | -1.580 | 0.113 | -10.17 | 1.08187 | |
| Scale | |||||||
| Gdpc | .0001324 | .0000475 | 2.790 | 0.005 | .0000393 | .0002254 | |
| Intercept | 2.94 | .8510032 | 3.460 | 0.001 | 1.27334 | 4.60921 | |
| Asia (n=44) | Popdens | -.0000326 | .0000526 | -0.620 | 0.535 | -.0001358 | .0000705 |
| Plu65 | .0612469 | .0305125 | 2.010 | 0.045 | .0014435 | .1210503 | |
| Gdpc | -.0000157 | 0.00000458 | -3.430 | 0.001 | -.0000247 | -0.00000673 | |
| Cvdr | 0.001017 | .0007384 | 1.380 | 0.168 | -.0004302 | .0024641 | |
| Diabete | .0302921 | .0413358 | 0.730 | 0.464 | -.0507247 | .1113088 | |
| Beds | -0.045213 | .0500125 | -0.900 | 0.366 | -.1432357 | .0528097 | |
| Hdi | -0.812942 | 1.742048 | -0.470 | 0.641 | -4.227293 | 2.601409 | |
| Intercept | -4.15825 | 1.080728 | -3.850 | 0.001 | -6.276437 | -2.040063 | |
| Scale | |||||||
| Gdpc | 0.000035 | .0000115 | 3.040 | 0.002 | .0000124 | .0000576 | |
| Intercept | 4.576361 | .4077611 | 11.220 | 0.001 | 3.777164 | 5.375559 | |
| Africa (n=52) | Popdens | -.0009652 | .0009848 | -0.98 | 0.327 | -.0028954 | 0.000965 |
| Plu65 | -.1659363 | .0715376 | -2.32 | 0.020 | -.3061474 | -.0257253 | |
| Gdpc | -.0000521 | .0000266 | -1.96 | 0.050 | -.0001042 | -8.27E-08 | |
| Cvdr | .0013007 | .0014533 | 0.89 | 0.371 | -.0015477 | 0.004149 | |
| Diabete | .0601155 | .0336385 | 1.79 | 0.074 | -.0058147 | .1260457 | |
| Beds | -.0804401 | .0856124 | -0.94 | 0.347 | -.2482373 | .0873572 | |
| Hdi | 4.00206 | 1.663957 | 2.41 | 0.016 | .7407639 | 7.263355 | |
| Intercept | -5.651476 | .8140203 | -6.94 | 0.000 | -7.246926 | -4.056025 | |
| Scale | |||||||
| Gdpc | .0000651 | .0000622 | 1.05 | 0.295 | -.0000568 | 0.000187 | |
| Intercept | 4.760653 | .4908875 | 9.70 | 0.000 | 3.798531 | 5.722775 | |
| Europe (n=45) | Popdens | .0000106 | .0008169 | 0.010 | 0.990 | -.0015905 | .0016116 |
| Plu65 | -.0893938 | .0359814 | -2.480 | 0.013 | -.1599161 | -.0188716 | |
| Gdpc | -0.00000865 | .0000136 | -0.640 | 0.523 | -.0000352 | .0000179 | |
| Cvdr | -.0005873 | .0024211 | -0.240 | 0.808 | -.0053325 | 0.00416 | |
| Diabete | .0088194 | .0387557 | 0.230 | 0.820 | -.0671404 | .0847793 | |
| Beds | -.0497579 | .0986112 | -0.500 | 0.614 | -.2430324 | .1435165 | |
| Hdi | 2.61447 | 3.67012 | 0.710 | 0.476 | -4.57883 | 9.80778 | |
| Intercept | -4.54444 | 2.87 | -1.580 | 0.113 | -10.17 | 1.08187 | |
| Scale | |||||||
| Gdpc | .0001324 | .0000475 | 2.790 | 0.005 | .0000393 | .0002254 | |
| Intercept | 2.94 | .8510032 | 3.460 | 0.001 | 1.27334 | 4.60921 | |
As cited in the Methods section, we deal with the extended beta regression model by adjusting some covariates to the precision function of the model (see scale components in (Tables 3, 4). After some investigation in the bivariate analysis (using a scatter plot), the GDP per capita was included as a regressor in the precision function, which showed that it was highly significant. For example, in the estimated model for the full sample, for every additional unit of GDP per capita, the precision parameter increased by a factor of exp (0.0002) = 1.0002.
Among the regions, the parameter estimates showed different patterns of association between explanatory variables and mortality rates. In the American region, the results showed a strange pattern and nearly insignificant effect for almost all variables. In Asian countries, we found a significant effect of GDP per capita and share of population aged 65 years and older on mortality rates, whereas on the African continent, the significant variables affecting mortality rates were GDP per capita, the human development index and share of population aged 65 years and older. Finally, in the European region, we do not find clear evidence of an association between explanatory variables and mortality rates.
Table 5 summarizes the goodness-of-fit and predictive accuracy of the five models. In terms of pseudo-R2, the model in the European region performed the best compared to the other models, the lowest estimated value of pseudo-R2 was for the American region. However, the remaining accuracy measures are mainly used in nested models to select the optimal model. Moreover, by estimating an increment function, we found heterogeneity in the contribution of each individual observation (country) to the global deviance in each model.
Table 5 Predictive accuracy of the beta regression
| Model | R2 | LL | GD | AIC | BIC |
|---|---|---|---|---|---|
| World | 0.1945 | 575.8 | -1169.16 | -1145.52 | -1106.72 |
| Africa | 0.2006 | 168.1 | -335.58 | -311.55 | -287.1 |
| Asia | 0.3021 | 158.8 | -322.24 | -298.24 | -276.56 |
| Americas | 0.1857 | 106.6 | -228.65 | -204.65 | -185.99 |
| Europe | 0.4454 | 168.2 | -335.42 | -311.43 | -289.75 |
Source: R2: ;proportion of the square error predicted by the model; LogLik: log likelihood function of the estimated models; GD: Global deviance of the model (-2*log(likelihood)); AIC: Akaike information criterion; BIC: Bayesian information criterion.
DISCUSSION
The main aim of this study was to analyze the pattern of mortality rates due to Covid-19, where particular attention was paid to estimating the effects of social, health, and economic factors on mortality rates across i76 countries. For that, Beta regression models were used across four regions (Africa, Asia, America, and Europe), this statistical method is the optimal tool for dealing with fractional data bounded in the unit interval (0,1).
Is population density a factor affecting the specific mortality rate of Covid19? We can compare and contrast the results of our study with those of 26,27 despite that they have included the factor of "population density" in the context of virus spreading and not fatality. We believe that the lack of significance of this factor in estimated models was perhaps due to the fact that the population density for a country can hide the heterogeneity between the states and regions in the same country. Furthermore, it's revealed that population density is a major factor (or predictor) of coronavirus mortality rates among counties in the USA 27.
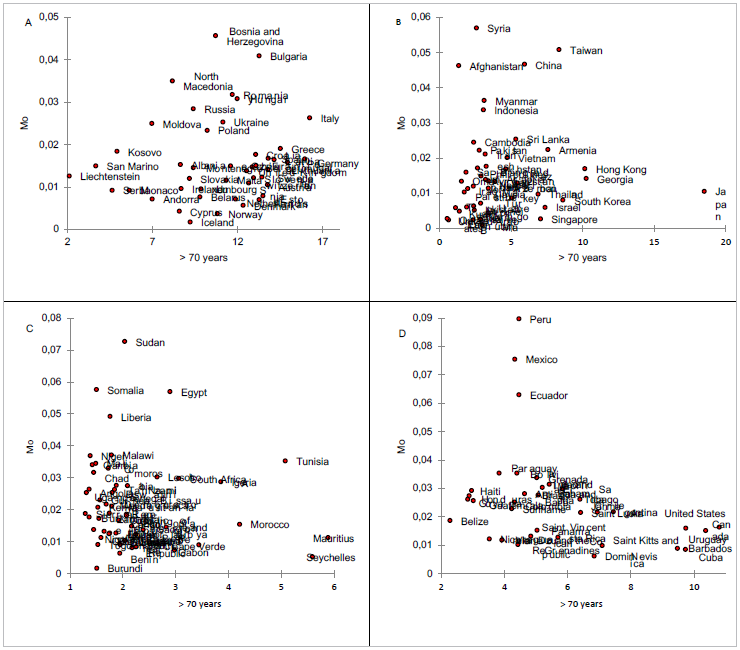
What about the effect of ageing on mortality rates? As shown in (Tables 3, 4), we can confirm that the aging covariate at the macro-level is not a prominent factor contributing to the high death rate due to Coronavirus. This result is very clear in Figure 3, which depicts the association between mortality rates and the proportion of the population aged ≥ 75 years across the four continents. from block (A) of Europe, we can reveal two clusters of countries, the first cluster contains the developed countries of this continent (Western Europe) of which we see a certain homogeneity of association between the levels of mortalities and share of the elderly population, except Italy which is an outlier in this block. The other cluster is that of developing countries (especially in Eastern Europe) that have recorded very high mortality rates, despite the fact that the share of the population aged 75 years and older is very low compared to the first cluster.
However, in the Asian region (B in Figure 3), there was a certain concentration of these countries in one block, except for certain aberrant observations, namely Japan, which had a very low mortality rate despite its large share of the population aged 75 years and older. In contrast, countries such as Syria and Afghanistan recorded high mortality rates despite their very low percentage of population aged 75 years or older. The same pattern of comparison can be performed in African (bloc C) and American regions (bloc D).
The above discussion was at the macro level, despite the fact that we can discuss the indirect effect of aging on the worse outcomes of the pandemic via these chronic diseases, 28. In the pandemic era, 11 revealed that aging is a generator factor for severe disease and death, and vulnerability to Covid-19 outcomes among older adults could occur via the decline and dysregulation of immune function. This hypothesis was tested by 12,13, who compared the clinical manifestation of Covid-19 in young and elderly patients.
Does the prevalence of diabetes and cardiovascular disease affect mortality rates? Our analysis is based on a macro level. Therefore, the results of this study should be considered in this context. First, we hypothesized that countries with a higher prevalence of diabetes and cardiovascular diseases would have the highest mortality rates due to Covid19. The estimated results revealed insignificant coefficients across almost all regions. In contrast, at a micro level, several studies reported that patients with diabetes 7,8 and with cardiovascular disease 9,10 have an increased risk of mortality from Covid-19.
On the other hand, the well-established impact of Covid-19 on the GDP has been confirmed in several studies 29. However, inverse causality was not confirmed, and the estimated results showed that the gross domestic product and HDI index had a weak significant effect on mortality rate from Covid-19 across the four regions (Africa, Asia, America, and Europe).
At this level, we can answer the following question: Why is what is validated at the clinical level not validated at the macro-and regional levels? Thus, we must maintain objectivity regarding the challenge of passing from a micro-level to a macro-level conceptualization of the determinants (or risk factors) of mortality rates due to Covid-19. A challenge for this econometric model is the problem of multicollinearity among explanatory variables, which was depicted in our case (see the correlation matrix in Table 2). A better solution for future studies is the application of the ridge-regression model, which was proposed by 30, they showed the performance of the ridge-estimation over maximum likelihood estimation. In the same context, and despite the computational ease of the likelihood-based method, the problems of non-convergence and biasing of estimation make the Bayesian inference an optimal alternative to estimate the beta regression models 20. Moreover, the Bayesian method can provide some new insights into the estimation process by exploring the prior information about some covariates (for example we can deal with an informative prior for certain parameters or hyper-parameters).
A proper pattern of the pandemic is its dynamic and perhaps chaotic behavior in some contexts; this idea was depicted by 15. Perhaps what is found to be significant over one period (or during a wave of this virus) might not be significant over other time periods Here, we can talk about the heterogeneity of the pandemic behavior across the first, second and third wave and currently the fourth wave. Another challenge is the differences and accuracy of data recording (for new cases and deaths), particularly in the underdeveloped countries of Africa and Asia. The problem of competing risks of death could be a hidden factor that can bias the specific mortality rates from Covid-19. In this context some researchers asked a challengeable question about the factors making death and mortality differ between states, countries and regions 31. In a specific context, the existence of competing risk factors can be remedied (at the micro level) using multistate models 32.
Summing up the results, it can be concluded that further investigation is needed to analyze the behavior of the pandemic and the patterns of associations with social, economic, and health factors at the macro level ♠

