25 44 
Home Page  

  • SciELO

  • Google
  • SciELO
  • Google


Revista Universidad y Empresa

 ISSN 0124-4639 ISSN 2145-4558

        07--2024

https://doi.org/10.12804/revistas.urosario.edu.co/empresa/a.11969 

Artículo de revisión

The Use of Machine Learning in Volatility: A Review Using K-Means

El uso de machine learning en volatilidad: una revisión usando K-means

O uso de machine learning na volatilidade: uma revisão usando K-means

Jesús Molina Muñoz* 

Ricard Castañeda** 

* Universidad del Rosario, School of Management (Colombia). Correo electrónico: jesus.molina@urosario.edu.co

** Universidad del Rosario (Colombia). Correo electrónico: ricard.castaneda@urosario.edu.co


Abstract

Recently, the use of machine learning (ML) in scientific disciplines has experienced an unprecedented increase. Finance has not been an exception. Several works have been published in recent years using ML techniques. However, one of the topics with the least number of developed papers is volatility in this context. Nevertheless, the data analyzed here suggest changes regarding this issue. Data obtained from the Web of Science database show that between 2001 and 2010 there were 33 published papers associated with this topic. Surprisingly, between 2019 and 2023, 189 manuscripts have been published related to this topic. The purpose of this work is to review the works related to the applications of ML in volatility. For this, a classification of the main proposals on this topic is proposed following a narrative methodology, accompanied by a statistical and bibliometric analysis in which novel techniques such as K-means were used. The results are suggestive. Although most papers focus on volatility prediction through neural networks and support vector machines, there is a lack of studies related to volatility transmission, calibration of volatility surfaces, and corporate finance. Moreover, the obtained results indicate that there is a gap in the production of works related to these topics in finance and economics specialized journals.

Keywords: Bibliometric analysis; financial literature; K-means; machine learning; volatility

Resumen

Recientemente, el uso de técnicas de machine learning (ML) en diferentes disciplinas científicas ha experimentado un aumento sin precedentes. El área de las finanzas no ha sido una excepción. En los últimos años, se han publicado numerosos trabajos utilizando técnicas de ML. Sin embargo, uno de los temas con menor número de artículos desarrollados en este contexto, es el de la volatilidad. A pesar de los anterior, los datos analizados en este articulo sugieren cambios al respecto. Datos obtenidos de la base Web of Science muestran entre 2001 y 2010 había 33 artículos asociados con este tema. Sorprendentemente, entre 2019 y 2023 se han publicado 189 manuscritos relacionados con este tipo de modelos. El propósito de este artículo es revisar los trabajos relacionados con las aplicaciones de ML en volatilidad. Para ello, se propone una clasificación de las principales propuestas sobre esta temática siguiendo una metodología narrativa, acompañada de un análisis estadístico y bibliométrico en el que se utilizan técnicas novedosas como K-means. Los resultados son sugerentes. Aunque la mayoría de los artículos se centran en la predicción de la volatilidad a través de redes neuronales y support vector machines, se evidencia una ausencia de artículos relacionados con transmisión de la volatilidad, calibración de superficies de volatilidad, y finanzas corporativas. Además, los resultados obtenidos indican que se presentan vacíos en la producción de trabajos relacionados con estos tópicos en revistas especializadas en finanzas y economía.

Palabras clave: análisis bibliométrico; K-means; literatura financiera; machine learning; volatilidad

Resumo

Recentemente, o uso de técnicas de machine learning (ML) em diferentes disciplinas científicas experimentou um aumento sem precedentes. A área das finanças não tem sido exceção. Nos últimos anos, vários artigos foram publicados usando técnicas de ML. Entretanto, um dos temas com menor número de artigos desenvolvidos nesse contexto é a volatilidade. Apesar do exposto, os dados analisados neste artigo sugerem mudanças nesse sentido. Dados obtidos da base de dados Web of Science mostram que entre 2001 e 2010 33 artigos associados a este tópico foram publicados. Surpreendentemente, entre 2019 e 2023, foram publicados 189 manuscritos relacionados a esse tipo de modelo. O objetivo deste artigo é revisar os trabalhos relacionados a aplicações de ML no tópico de volatilidade. Para isso, propõe-se uma classificação das principais propostas sobre este assunto seguindo uma metodologia narrativa, acompanhada de uma análise estatística e bibliométrica em que são utilizadas técnicas inovadoras como o K-means. Os resultados são sugestivos. Embora a maioria dos artigos se concentre na previsão de volatilidade por meio de redes neurais e support vector machines, há uma ausência de artigos relacionados à transmissão de volatilidade, calibração de superfície de volatilidade e finanças corporativas. Além disso, os resultados obtidos indicam que existem lacunas na produção de artigos relacionados a esses temas em periódicos especializados em finanças e economia.

Palavras-chave: análise bibliométrica; k-means; literatura financeira; machine learning; volatilidade

Introduction

In a panorama of uncertainty and a high degree of risk in financial markets, the study of the variables affecting their dynamics is pertinent for academics and practitioners. Two of the variables that are decisive in investment analysis correspond to returns and risk. Although in the last decades, finance as a research field has made important advances in the understanding of these two elements, there is still a long way to go to decipher the logic under which markets operate globally.

Recently, one of the most important innovations in the study of finance corresponds to the use of machine learning (ML), which "refers to a class of data science models that can learn from the data and improve their performance over time. The roots of ML [go] back to the scientific community's interest in [the] 1950s and 1960s in replicating human leaning through computer programs" (Ghodussi et al. 2019, p. 709). Particularly, in the case of finance as a research area, it "at the intersection of a number of emergent and established disciplines including pattern recognition, financial econometrics, statistical computing, probabilistic programming, and dynamic programming" (Dixon et al., 2020, p. vii).

This new approach to the study of finance has gained relevance, mainly for two reasons. Firstly, recent computational advances and the spread of statistical packages such as R and Phython have allowed the wide use and estimation of previously unviable models at low costs and with reliable accurate results. Secondly, the relative abundance of financial data allows the use of ML and big data techniques in a more accessible way than in other fields of economics and management. In consequence, the studies related to ML in finance have experienced a remarkable increase in the last few years. According to data taken from the Web of Science database, in 2001, there were four articles related to the use of ML in finance, in 2010 this figure was seven, while in 2022, the number of articles related to this topic exceeded 45.

The use of ML techniques in finance has covered a wide variety of topics. For instance, applications related to price prediction, risk management, and trading strategies have grown exponentially in academic publications in recent years. However, one of the topics that received the least attention until a couple of years ago is the study of volatility. This fact is striking, considering that "Modeling volatility is both challenging and promising. The challenge is to include the concept of second-moment clustering in a standard ML model. The advantage is that volatility is not subject to market efficiency effect (i.e., volatility will not disappear as a result of prediction)" (Ghodussi et al. 2019, p. 720). This is to say that although there is greater potential in the development of models dedicated to predicting volatility, much of the financial literature has focused on predicting returns.

However, the results obtained from our exercise suggest that there is an increasing number of works related to ML applications for volatility analysis. According to data taken from the Web of Science database, between 2001 and 2016 the number of articles related to the use of ML in the study of volatility was 84. Only considering the works published on this topic between 2017 and 2023 this figure increased to 234. In other words, in a little more than 6 years, more studies were published than in the previous 15 years. These figures show a clear trend for the use of ML techniques in volatility, which can convert this subject into a "hot topic" in the coming years.

This article aims to perform a literature review about the topic, accompanied by a bib-liometric analysis to identify trends in the scientific production on the use of ML in volatility and recognize possible research opportunities derived from this exercise. Consequently, a classification of the works published on this theme is proposed. This classification is complemented by a statistical analysis of the temporal evolution of scientific production in this field, the production by authors and countries, collaboration between countries, and the use of the K-means methodology to define the conceptual structure of this novel research area. The results are promising. Although a large majority of studies focus on volatility forecasting through neural network techniques, deep learning, and support vector machines (i.e., Tang et al., 2009; Chen et al., 2010; Pradeepkumar & Ravi, 2017; Liu, 2019; Gon et al. 2019), there is a smaller number of publications associated with proposals for volatility calibration (Zeng & Klabjan, 2019; Horvath et al., 2021), options valuation (Amornwattana et al., 2007; Fadda, 2020; Jerbi, & Chaabene, 2020), projects valuation (Jang et al., 2021), and some theoretical works related to stochastic processes and their use in volatility issues (Peng & Liu, 2011).

The remainder of this paper is structured as follows. Section 2 presents the methodology adopted to perform this exercise. Subsequently, section 3 shows the main obtained results.

Finally, a discussion related to the main findings and the principal conclusions are presented in sections 4 and 5, respectively.

Methodology

The developed exercise was carried out through two stages. In the first stage, corresponding to the literature review, data were collected from the Web of Science database1 using the search equations described in Table 1. 906 documents were obtained by this procedure. It is worth mentioning that the performed exercise corresponds to a narrative review of the literature. In this sense, it focuses on summarizing and identifying previous publications to find areas of study not covered in the literature. Posteriorly, as suggested by Ferrari (2015), we employed as inclusion criteria articles published in English and classified in the social science citation index (SSCI). Subsequently, articles that were not related to the financial area were excluded. Finally, at this step, each article was reviewed manually to propose a classification of the works that made use of ML techniques in volatility according to the topic, the machine learning technique and the type of assets that were studied. We obtained 338 articles. Moreover, in this section, a conceptual structure was defined through the K-means technique. In the second stage, a bibliometric analysis was conducted. In this stage, the trends in scientific production were identified by author, country, journals and collaborations between countries.

Step 1. Collecting Data

The first step corresponded to obtaining the articles that were related to the use of machine learning techniques in volatility. For this, a search was made in the cited database using different terms related to machine learning models, together with the term returns volatility (table 1). Following this procedure, 338 articles were identified and downloaded for the period 2001-2023.

Table 1 Search Equations 

  • Machine learning + returns volatility

  • Artificial intelligence + returns volatility

  • Neural networks + returns volatility

  • Big data + returns volatility

  • Decision trees + returns volatility

  • Support vector machine + returns volatility

  • Supervised learning + returns volatility

  • deep learning + returns volatility

  • unsupervised learning + returns volatility

  • ensemble method + returns volatility

  • genetic algorithm + returns volatility

  • particle swarm optimization + returns volatility

Step 2. Literature Review

The objective of the second step was to propose a classification of the articles to make a literature review of them. In this case, documents were analyzed one by one, placing special emphasis on the type of ML technique used, the task that was developed in the paper (i.e., volatility forecast and option valuation), the obtained results, and the financial asset class used in the document. Based on the above, a classification of the founded proposals was elaborated. This classification is detailed in the results section.

Step 3. Statistical Analysis

In this step, a statistical analysis was conducted on the results. For this goal, the Data.Table, DPLYR, and Bibliometrix packages, available at the R software, were employed. Through the used tools, the trend in the number of products associated with the studied subject was identified. Moreover, the main authors, the authors' nationality, the journals in which the developed articles were published, the authors' countries, and the collaborations between authors of different nationalities were recognized and analyzed.

Step 4. Conceptual structure using K-means

In this stage, an analysis of the documents was conducted through the ML model known as K-means. This method is identified as a clustering technique to "address the [ML] task of clustering, which involves finding natural groupings of data" (Lantz, 2019, p. 271). In this type of procedure, a specific result associated with the data is not required, as is the case in other ML techniques. The main objective of K-means is to establish groups from data that do not have a particular label but have similar characteristics which can be exploited to conform a defined number of groups. Each cluster is defined taking into consideration the similarity between the data that is used to perform the analysis.

The k-means algorithm involves assigning each of the n examples to one of the k clusters, where k is a number that has been defined ahead of time. The goal is to minimize the differences within each cluster and maximize the differences between clusters (Lantz, 2019, p. 272).

In particular, in this paper, we employed the K-means technique using the Bibliometrix package in R. In this case, the analysis aims to define the clusters according to co-occurrences of words in the set of employed documents identified in Step 1. This task is carried out by a routine of natural language processing2 in which the words contained in the titles and the abstracts of the analyzed papers are extracted to define clusters by the K-means technique. This exercise results in groups of documents with similarities in the used concepts, assets and machine learning techniques. The results derived from this step are presented in the results section.3

Results

Literature review

With the development of the methodology described in the previous section, the classification of the analyzed documents is proposed based on the task on which they are focused. For this purpose, a narrative review method was used since our exercise focuses on summarizing and identifying previous publications to find areas of study not covered in the literature (Ferrari, 2015). In this line, the Web of Science database was used as an electronic source, using as inclusion criteria articles published in English and classified in the social science citation index (SSCI). Articles that were not related to the financial area were excluded and an additional final manual debugging was performed to obtain the definitive database.

Forecast Volatility

The main application of ML methodologies in volatility corresponds to volatility forecasting. In this line, there is a marked trend towards the use of neural networks, deep learning and support vector machine methodologies.4 This last technique has received the most attention in recent years. Although most of the articles focus on the use of stock indices, some proposals use energy assets or individual stocks. Most of the articles use data daily, although some exercises employ intraday information.

In this regard, most of the analyzed articles focus on this type of task. In this context, the most applied machine learning methodology corresponds to the use of neural networks. The foregoing is a consequence of the relative ease in the use of this type of method and the evidence of offering satisfactory results in other types of prediction exercises. Most of the works in this group focus on the use of daily data employing stock indexes from the main financial markets in the U.S.A. and Asia. This can be explained by the availability of data for this type of market and the high academic production that characterizes these countries. For example, a large part of the body literature analyzes the volatility prediction for U.S.A. markets (Liu, 2019; Wang et al. 2019; Petneházi & Gáll, 2019; Ramos Pérez et al. 2019; Kaushik et al. 2019; Bucci, 2020; Jia & Yang, 2021; Wang et al. 2021; Chkili & Hamdi, 2021). Similarly, papers that used similar techniques for stock market indexes from countries different from the U.S.A. were identified. In this group, are worth mentioning applications to the Turkish, European, Taiwanese, Chinese markets, and the case of a few Latin American countries: Chile, Brazil y México (Slim, 2004; Tseng et al. 2008; Mo & Wang, 2013; Sermpinis et al. 2013; Kristjanpoller et al. 2014).

A third group of proposals used neural networks to forecast volatility for other types of assets. This is the case with the use of these techniques to predict volatility in exchange rates (Liu & Liu, 2006; Pradeepkumar & Ravi, 2017; Baffour et al. 2019; Liao et al. 2020), Bitcoin (Seo & Kim, 2020; Othman et al. 2020), oil prices (Bildirici & Ersin 2015; Kristjanpoller & Minutolo, 2016; Al-Fattah, 2019, Bouteska et al., 2023), and individual stocks for different markets (Calôba et al. 2001; Fong et al. 2005; Wang et al. 2012; Kristjanpoller & Minutolo, 2015; Kaushik et al. 2019).

In a different approach, articles that dealt with the modeling and forecasting of volatility for high-frequency data and the analysis of implied and realized volatility were identified (Hamid & Iqbal, 2004; Cai et al. 2013; Vortelinos, 2017; Kim & Baek, 2018; Zhai et al. 2020). In this group of proposals, most of the exercises used stock market indexes from U.S.A. and Asia. Other documents focused on the volatility analysis for decision-making and asset allocation (Kim & Enke; 2018; Weerasingha et al. 2021)

A second strand in the literature is related to works in which volatility is forecasted using hybrid models.5 In this case, the forecast of the interest variable is made through the ensemble of the outcomes obtained from at least two individual models. In this group, it is relevant to highlight the exercises developed by Ou & Wang (2014), Jung & Choi (2021), Liu and Fu (2016), Hu et al. (2020), and Kakade et al. (2022). In these articles, authors used hybrid models to forecast volatility related to copper Price, Chinese interbank offered rate, commodities, Nasdaq composite index and Exchange rates. The proposals employed combinations of support vector machines, chaotic genetic algorithms, extreme learning machines, deep learning and neural networks.

Another group of proposals employed support vector machine techniques to forecast volatility. In this type of exercise, most of the works use this technique to forecast volatility for daily and intraday data of U.S.A., European and Asian markets and Exchange rates (Tang et al. 2009; Chen et al. 2010; Ou & Wang, 2012; Wang et al. 2013; Santamaria-Bonfil et al. 2015; Chung & Zhang, 2017; Gong et al. 2019; Yang et al. 2020).

A recent trend in the literature associated with volatility forecasting through machine learning techniques corresponds to the use of Deep learning. In simple terms, Deep learning can be understood as an extension of neural networks with several hidden layers greater than one. In this case, most of the analyzed works are published between 2020 and 2021. Even though most of the articles focus on market indexes, it seems that this type of technique offers a higher degree of accuracy than those obtained from the previously exposed techniques. In this group it is worthwhile to mention the works of Kyoung-Sook and Hongjoong (2019), Kandem et al. (2020); Lei et al. (2021a), Lei et al. (2021b), Li et al. (2021), Petrozziello et al. (2022) and Di-Giorgi et al. (2023), considering that these publications correspond to proposals in which innovative use of deep learning algorithms is made for the forecast of volatility for different financial assets and markets.

Finally, there are a reduced number of proposals that used ML techniques different from the ones presented. These articles include the use of particle swarm optimization, adaptive heterogeneous autoregressive models, random forests and principal component analysis (Tung & Quek, 2011; Hung, 2011; Wei, 2012; Qu & Ji, 2014; Hung, 2015; Qu & Ji, 2016; Jobejarkol et al., 2018; Kristjanpoller & Minutolo, 2018; Ewees et al., 2020; Gupta et al., 2021). In a total of 86 analyzed articles, this group contributes with 9 publications. Although this number is reduced, this fact is suggestive in terms of looking for new research proposals that exploit the benefits of these models in volatility prediction exercises.

Volatility calibration and Surface construction

Another topic in which ML techniques have been applied to volatility analysis is the volatility calibration and the construction of volatility surfaces. While the Black-Scholes-Merton proposal has received great acceptance by the financial industry for the valuation of options, one of its main limitations corresponds to the assumption that volatility is constant for different strike prices with a defined time of maturity. Empirically, it has been shown that the graph which relates these two variables has a smile shape. Although different methods have been proposed in the financial literature for the calibration of volatility and the subsequent construction of volatility surfaces, this exercise presents considerable computational challenges. Recently, different proposals have been presented in which ML techniques are used to fulfill this task (Zeng & Klabjan, 2019; Cao et al., 2020; Stone et al.,2020; Horvath et al., 2021, Kwak et al., 2022), between the years 2020 and 2022 and make use of neural networks, deep learning, and support vector regression using options on financial indexes to conduct this exercise.

Derivatives pricing

One of the most interesting topics in finance corresponds to derivatives valuation. Even though there are numerous proposals in the literature to value different types of derivative contracts, some authors have made use of ML techniques to develop this task. Particularly, Amornwattana et al. (2007) proposed the use of neural networks to price call options. Liu et al. (2019) employed neural networks to price options and compute implied volatilities. Fadda (2020) made use of modular neural networks to value options and Jarbi and Chaabene (2020) proposed a stochastic volatility model which employed neural networks for price options.

Other Applications

From the conducted analysis, we found several papers in which ML techniques are used in volatility topics different from the previously studied ones. These documents do not correspond to clear trends in this literature area, but rather to isolated cases of applications in certain issues related to volatility. In this regard, Dash and Kajiji (2008) used generalized neural networks to analyze volatility spillovers in the European market of bonds. Jang et al. (2021) employed neural networks to analyze the risk level of a set of projects. Peng and Liu (2011) studied the PTH moment stability of stochastic Grossberg-Hopfield neural networks. Besides the mentioned articles, there are other applications in which ML is used to forecast direction volatility, predict requirement change volatility, analyze the profitability of a trading strategy and other applications (Tino et al. 2001; Bekiros & Georgoutsos, 2008; Medeiros et al., 2008; Xia et al., 2011; Zhu et al., 2013; Ge et al., 2019; Wang & Liu, 2020; Patnaik, 2020; Vrontos et al., 2021; Hein et al., 2021; Arvin et al., 2021; Rahman et al., 2018; Xu, 2021).

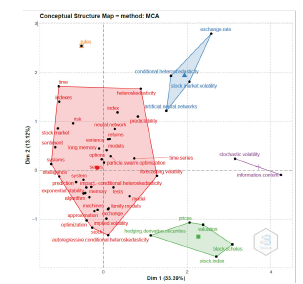
To complement the mentioned findings, we performed a K-means analysis to identify the potential conceptual structure of the use of ML in volatility (Figure 1). The details of this model are explained in section 1. We found 5 clusters related to the literature review presented in the previous section that are described as follows. The first cluster (red cluster) is related to exercises in which forecasting is the main task. In this setting, concepts such as neural network, predictability, index, and forecasting volatility are found. This cluster presents the largest size and groups most works in the performed analysis. A second cluster (green cluster) includes articles related to derivatives valuation. In this group, words such as hedging derivatives securities, valuation, and Black Scholes can be found. A third group (blue cluster) can be related to the works in which volatility calibration and volatility surface construction are developed. In this group, words like conditional heteroscedasticity and stock market volatility are present. The purple and orange clusters represent the works that do not belong to any clear trend and are classified as "other applications" in this paper.

Figure 1 ML in volatility: Conceptual structure 

Conceptual Structure Map - method: MCA

Bibliometric Analysis

In the next part of this work, a bibliometric analysis was made in which we sought to recognize the patterns in the number of products related to the use of ML in volatility, the type of journal in which they were published, authors' nationality, collaborations between authors according to their country of origin and a proposal for the conceptual structure of the topic using K-means.

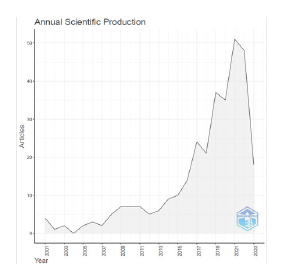
In terms of the number of academic products related to the use of machine learning in volatility, a clear growing trend is observed in recent periods, which experienced a boom towards the year 2018 (Figure 2). In the finance area, this change in the number of product slopes can be observed from 2015 onwards. This fact shows a short lag in academic production related to ML and volatility, thanks to the attention received by articles related to the analysis of returns. However, figure 1 constitutes evidence of the relevance that the use of ML in volatility is currently experiencing.

Figure 2 Number of Articles per Year Related to the Use of ML in Volatility 

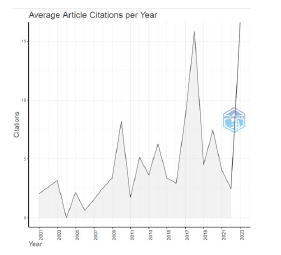
In this line, the number of citations per year (Figure 3) has experienced an increase in the previous years, particularly since 2013. This increase was expected considering the rise in the number of documents associated with ML in volatility presented in Figure 2.

Figure 3 Number of Citations per Year 

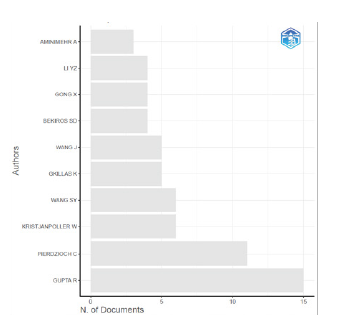
When reviewing the number of articles per author, it was found that there is not a large concentration of products in a few authors. The academics who have published a higher number of articles on the studied subject do not exceed 15 manuscripts (4.4 % of the total sample) and many academics have five or fewer publications (1.5 % of the total sample) (Figure 4). These results are correlated to the H-index for the most relevant authors (Table 2), where it can be seen that a higher number of published articles implies a higher number of citations.

Table 2 H-index for Most Relevant Authors 

Author H-index
GUPTA R 7
PIERDZIOCH C 6
KRISTJANPOLLER W 5
WANG J 5
BEKIROS SD 4
GKILLAS K 4
WANG SY 4
DUNIS CL 3
JI Q 3
KARATHANASOPOULOS A 3
KIM S 3
LI YZ 3
MEDEIROS MC 3
SANTOS AAP 3
SERMPINIS G 3
TIWARI AK 3
ZHANG YJ 3

Figure 4 Number of Articles per Author 

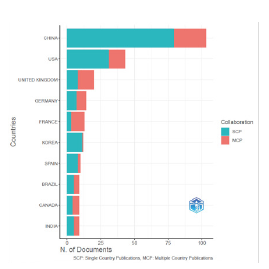
On the other hand, when reviewing the number of products according to the nationality of the authors, clear trends are observed in the application of ML to study volatility. In this case, the authors from China, the U.S.A. and the United Kingdom have 49 % of the total articles in the analyzed sample (Figure 5). It should be noted that in most cases, the articles developed by authors from these countries correspond to documents in which individuals from a single nationality participated.

Figure 5 Number of Articles per Country 

This concentration of production by country is confirmed by reviewing the network of international collaborations for the analyzed documents (Figure 6). In this case, China, the U.S.A and the United Kingdom present a greater number of collaborations. Publications including authors from different countries are evidenced not only between China, the U.S.A. and the United Kingdom. However, in the first case, there are numerous alliances with Singapore, Canada and Korea. In the case of the U.S.A., the collaborations with India, Singapore and Australia are striking. For the United Kingdom, the collaborations are presented with other European countries and some Asian nations.

Figure 6 Country Collaboration 

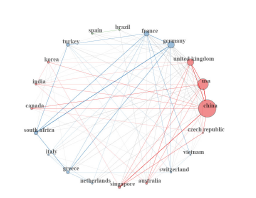
All in all, Figures 5 and 6 show a clear trend towards a high degree of concentration of academic products that make ML applications on volatility using collaborations between a small group of countries. The search for alliances and co-authors in this field of research is a fundamental task for countries that still do not have a high degree of production in this area.

When analyzing the type of journal in which the reviewed articles are published (Table 3), most publications are classified in quantiles 1 and 2 according to the Web of Science database. A large part of these journals is focused on topics related to computer science, statistics, econometrics and physics. Particularly, the journal with a higher number of products is classified as a computer science publication. The above shows a clear gap in the production of works in journals specialized in finance and economics.

Table 3 Number of Publications per Journal 

JOURNAL # OF PRODUCTS %
EXPERT SYSTEMS WITH APPLICATIONS 39 12 %
QUANTITATIVE FINANCE 16 5 %
ENERGY ECONOMICS 15 4 %
COMPUTATIONAL ECONOMICS 12 4 %
INTERNATIONAL REVIEW OF FINANCIAL ANALYSIS 10 3 %
FINANCIAL INNOVATION 9 3 %
NORTH AMERICAN JOURNAL OF ECONOMICS AND FINANCE 9 3 %
RESEARCH IN INTERNATIONAL BUSINESS AND FINANCE 9 3 %
OTHERS 219 65 %
TOTAL 338 100 %

Discussion and Implications

The developed exercise suggests interesting insights to be considered in future research works related to the application of machine learning techniques to the analysis of volatility for financial assets and markets. Firstly, interesting future research opportunities are presented regarding the growing trend of publications related to the studied topic and the development of computational tools that allow the development of sophisticated ML models to analyze financial volatility.

Moreover, there is a lack of studies that applied ML tools to the analysis of volatility transmission, volatility calibration surfaces, risk analysis, and corporate finance. This suggests the development of new research lines for academics working in these areas. The foregoing becomes even more relevant for emerging markets considering that there is not a high number of works for the topics in these markets.

On the other hand, our work has practical implications that suggest action plans for agents operating in financial markets. In particular, the use of ML techniques for volatility analysis plays a fundamental role in the design of investment and hedging strategies that accurately capture the financial market dynamics. Regulatory bodies could also begin to implement these types of models to monitor financial markets based on the remarkable results obtained from these types of models.

Finally, it is pertinent to mention that our proposal has limitations that could be considered for future studies. Firstly, only the Web of Science database was used to obtain the information employed as input for the development of the bibliometric analysis and the literature review. Incorporating other databases such as Scopus could confirm and strengthen the obtained results. On the other hand, it could be interesting to delve into the factors that explain why the publication of papers related to the studied topic is concentrated in certain markets and journals. This could generate future insights to understand academic production trends and design publication strategies related to the applications of ML techniques in the analysis of financial volatility.

Conclusions

In the last years, the use of ML in finance has experienced a remarkable increase. The study of volatility using this type of technique has not been an exception. Since 2017, the number of publications related to this topic has doubled according to data downloaded from the Web of Science database. The main uses of manuscripts related to this topic include volatility forecasting, calibration and construction of volatility surfaces, and the valuation of derivatives. Many publications in this area are related to authors or collaborations between China, the U.S.A. and the United Kingdom with a clear orientation to be disseminated in journals related to computer science, statistics, and forecasting. On the other hand, the most used methods correspond to neural networks, deep learning and support vector machines.

The above suggests the following observations. Firstly, it is expected that the use of ML in volatility will increase in the next years. In this case, there is a complete panorama to explore in terms of the methods that can be employed (different form neural networks) for different tasks with a variety of assets. For example, there is a lack of studies related to topics such as contagion risks, volatility spillovers, volatility calibration, and the estimation of risk in areas related to corporate finance. In terms of methods, currently, there are very few works related to text and sentiment analysis, decision trees, principal component analysis and deep learning. The constant use of developed stock market indexes is another concern. This creates opportunities to analyze other types of assets (i.e., energy) and markets (i.e., emerging markets).

As can be seen, there is a clear outlook for the use of machine learning in volatility. Especially if one considers that the journals related to economy and finance are still beginning to publish works related to this topic. The situation described in this paper reveals a panorama in which unprecedented opportunities for those interested in these models are available and ready to be exploited.

References

Al-Fattah, S. M. (2019). Artificial intelligence approach for modeling and forecasting oil-price volatility. SPE Reservoir Evaluation & Engineering, 22(03), 817-826. https://doi.org/10.2118/195584-PALinks ]

Amornwattana, S., Enke, D., & Dagli, C. H. (2007). A hybrid option pricing model using a neural network for estimating volatility. International Journal of General Systems, 36(5), 558-573. https://doi.org/10.1080/03081070701210303Links ]

Aria, M. & Cuccurullo, C. (2017). Bibliometrix: An R-tool for comprehensive science mapping analysis. Journal of Informetrics, 11(4), 959-975. https://doi.org/10.1016/j.joi.2017.08.007Links ]

Arvin, R., Khattak, A. J., & Qi, H. (2021). Safety critical event prediction through unified analysis of driver and vehicle volatilities: Application of deep learning methods. Accident Analysis & Prevention, 151, 105949. https://doi.org/10.1016/j.aap.2020.105949Links ]

Baffour, A. A., Feng, J., & Taylor, E. K. (2019). A hybrid artificial neural network-GJR modeling approach to forecasting currency exchange rate volatility. Neurocomputing, 365, 285-301. https://doi.org/10.1016/j.neucom.2019.07.088Links ]

Bekiros, S. D., & Georgoutsos, D. A. (2008). Direction-of-change forecasting using a volatility-based recurrent neural network. Journal of Forecasting, 27(5), 407-417. https://doi.org/10.1002/for.1063Links ]

Bildirici, M., & Ersin, Ö. (2015). Forecasting volatility in oil prices with a class of nonlinear volatility models: smooth transition RBF and MLP neural networks augmented GARCH approach. Petroleum Science, 12, 534-552. https://doi.org/10.1007/s12182-015-0035-8Links ]

Bouteska, A., Hajek, P., Fisher, B., & Abedin, M. Z. (2023). Nonlinearity in forecasting energy commodity prices: Evidence from a focused time-delayed neural network. Research in International Business and Finance, 64, 101863. https://doi.org/10.1016/j.rib-af.2022.101863Links ]

Bucci, A. (2020). Realized volatility forecasting with neural networks. Journal of Financial Econometrics, 18(3), 502-531. https://doi.org/10.1093/jjfinec/nbaa008Links ]

Cai, X., Lai, G., & Lin, X. (2013). Forecasting large scale conditional volatility and covariance using neural network on GPU. The Journal of Supercomputing, 63, 490-507. https://doi.org/10.1007/s11227-012-0827-1Links ]

Calôba, L. O. M., Calôba, L. P., & Contador, C. R. (2001). Delta-Neutral Volatility Trading using Neural Networks F3. International Journal of Engineering Intelligent Systems, 9(4), 243-249. https://lps.ufrj.br/~caloba/Papers%20meus/forecasting_market_volatility.pdfLinks ]

Cao, J., Chen, J., & Hull, J. (2020). A neural network approach to understanding implied volatility movements. Quantitative Finance, 20(9), 1405-1413. https://doi.org/10.1080/14697688.2020.1750679Links ]

Chen, S., Härdle, W. K., & Jeong, K. (2010). Forecasting volatility with support vector machine-based GARCH model.Journal of Forecasting, 29(4), 406-433. https://doi.org/10.1002/for.1134Links ]

Chkili, W., & Hamdi, M. (2021). An artificial neural network augmented GARCH model for Islamic stock market volatility: Do asymmetry and long memory matter? International Journal of Islamic and Middle Eastern Finance and Management, 14(5), 853-873. https://doi.org/10.1108/IMEFM-05-2019-0204Links ]

Chung, S. S., & Zhang, S. (2017). Volatility estimation using support vector machine: Applications to major foreign exchange rates. Electronic Journal of Applied Statistical Analysis, 10(2), 499-511. http://siba-ese.unisalento.it/index.php/ejasa/article/view/17080/15510Links ]

Dash, G. H., & Kajiji, N. (2008). Engineering a generalized neural network mapping of volatility spillovers in European government bond markets. In C. Zopounidis, M. Doumpos, & P. M. Pardalos (Eds.), Handbook of Financial Engineering (pp. 201-230). Springer. https://doi.org/10.1007/978-0-387-76682-9_7Links ]

Di-Giorgi, G., Salas, R., Avaria, R., Ubal, C., Rosas, H., & Torres, R. (2023). Volatility forecasting using deep recurrent neural networks as GARCH models. Computational Statistics, 1-27. https://doi.org/10.1007/s00180-023-01349-1Links ]

Dixon, M. F., Halperin, I., & Bilokon, P. (2020). Machine learning in finance: From Theory to practice. Springer International Publishing. https://doi.org/10.1007/978-3-030-41068-1Links ]

Enke, D., & Thawornwong, S. (2005). The use of data mining and neural networks for forecasting stock market returns. Expert Systems with Applications, 29(4), 927-940. https://doi.org/10.1016/j.eswa.2005.06.024Links ]

Ewees, A. A., Abd Elaziz, M., Alameer, Z., Ye, H., & Jianhua, Z. (2020). Improving multilayer perceptron neural network using chaotic grasshopper optimization algorithm to forecast iron ore price volatility. Resources Policy, 65, 101555. https://doi.org/10.1016/j.resour-pol.2019.101555Links ]

Fadda, S. (2020). Pricing options with dual volatility input to modular neural networks. Borsa Istanbul Review, 20(3), 269-278. https://doi.org/10.1016/j.bir.2020.03.002Links ]

Ferrari, R. (2015). Writing narrative style literature reviews. Medical Writing, 24(4), 230-235. https://doi.org/10.1179/2047480615Z.000000000329Links ]

Fisher, I. E., Garnsey, M. R., & Hughes, M. E. (2016). Natural language processing in accounting, auditing and finance: A synthesis of the literature with a roadmap for future research. Intelligent Systems in Accounting, Finance and Management, 23(3), 157-214. https://doi.org/10.1002/isaf.1386Links ]

Fong, B., Fong, A. C. M., Hong, G. Y., & Wong, L. (2005, December). An empirical study of volatility predictions: Stock market analysis using neural networks. In X. Deng & Y. Ye (Eds.), Internet and Network Economics. WINE 2005. Lecture Notes in Computer Science (pp. 473-480). Springer. https://doi.org/10.1007/11600930_47Links ]

Ge, H., Xu, G., Huang, J., & Ma, X. (2019). A mine main fans switchover system with lower air flow volatility based on improved particle swarm optimization algorithm. Advances in Mechanical Engineering, 11 (3). https://doi.org/10.1177/1687814019829281Links ]

Ghoddusi, H., Creamer, G. G., & Rafizadeh, N. (2019). Machine learning in energy economics and finance: A review. Energy Economics, 81, 709-727. https://doi.org/10.1016/j.eneco.2019.05.006Links ]

Gong, X. L., Liu, X. H., Xiong, X., & Zhuang, X. T. (2019). Forecasting stock volatility process using improved least square support vector machine approach. Soft Computing, 23, 11867-11881. https://doi.org/10.1007/s00500-018-03743-0Links ]

Gupta, R., Nel, J., & Pierdzioch, C. (2021). Investor confidence and forecastability of us stock market realized volatility: Evidence from machine learning. Journal of Behavioral Finance, 24(1), 111-122. https://doi.org/10.1080/15427560.2021.1949719Links ]

Hamid, S. A., & Iqbal, Z. (2004). Using neural networks for forecasting volatility of S&P 500 Index futures prices. Journal of Business Research, 57(10), 1116-1125. https://doi.org/10.1016/S0148-2963(03)00043-2Links ]

Hein, P. H., Kames, E., Chen, C., & Morkos, B. (2021). Employing machine learning techniques to assess requirement change volatility. Research in Engineering Design, 32, 245-269. https://doi.org/10.1007/s00163-020-00353-6Links ]

Horvath, B., Muguruza, A., & Tomas, M. (2021). Deep learning volatility: a deep neural network perspective on pricing and calibration in (rough) volatility models. Quantitative Finance, 21(1), 11-27. https://doi.org/10.1080/14697688.2020.1817974Links ]

Hu, Y., Ni, J., & Wen, L. (2020). A hybrid deep learning approach by integrating LSTM-ANN networks with GARCH model for copper price volatility prediction. Physica A: Statistical Mechanics and its Applications, 557, 124907. https://doi.org/10.1016/j.physa.2020.124907Links ]

Hung, J. C. (2011). Adaptive Fuzzy-GARCH model applied to forecasting the volatility of stock markets using particle swarm optimization. Information Sciences, 181(20), 4673-4683. https://doi.org/10.1016/j.ins.2011.02.027Links ]

Hung, J. C. (2015). Robust Kalman filter based on a fuzzy GARCH model to forecast volatility using particle swarm optimization. Soft Computing, 19, 2861-2869. https://doi.org/10.1007/s00500-014-1447-xLinks ]

Jang, Y., Son, J., & Yi, J. S. (2021). Classifying the level of bid price volatility based on machine learning with parameters from bid documents as risk factors. Sustainability, 13(7), 3886. https://doi.org/10.3390/su13073886Links ]

Jerbi, Y., & Chaabene, S. (2020). European call price modelling using neural networks in considering volatility as stochastic with comparison to the Heston model. Journal of Statistical Computation and Simulation, 90(10), 1793-1810. https://doi.org/10.1080/00949655.2020.1747463Links ]

Jia, F., & Yang, B. (2021). Forecasting volatility of stock index: Deep learning model with likelihood-based loss function. Complexity, https://doi.org/10.1155/2021/5511802Links ]

Jobejarkol, M. P., Badamchizadeh, A., & Morales, M. (2018). Implied volatility parameterization based on a machine learning polynomial approach. Intelligent Data Analysis, 22(5), 1127-1141. https://doi.org/10.3233/IDA-173600Links ]

Jung, G., & Choi, S. Y. (2021). Forecasting foreign exchange volatility using deep learning autoencoder-LsTM techniques. Complexity . https://doi.org/10.1155/2021/6647534Links ]

Kakade, K., Mishra, A. K., Ghate, K., & Gupta, S. (2022). Forecasting commodity market returns volatility: A hybrid ensemble learning GARCH-LSTM based approach. Intelligent Systems in Accounting, Finance and Management, 29(2), 103-117. https://doi.org/10.1002/isaf.1515Links ]

Kamdem, J. S., Essomba, R. B., & Berinyuy, J. N. (2020). Deep learning models for forecasting and analyzing the implications of COVID-19 spread on some commodities markets volatilities. Chaos, Solitons & Fractals, 140, 110215. https://doi.org/10.1016/j.chaos.2020.110215Links ]

Khashman, A., & Nwulu, N. I. (2011) Support vector machines versus back propagation algorithm for oil price prediction. In D. Liu, H. Zhang, M. Polycarpou, C. Alippi, & H. He, (Eds), Advances in Neural Networks - ISNN2011. ISNN2011. Lecture Notes in Computer Science, vol 6677 (pp. 530-538) Springer. https://doi.org/10.1007/978-3-642-21111-9_60Links ]

Kaushik, R., Jain, S., Jain, S., & Dash, T. (2019). Performance evaluation of deep neural networks for forecasting time-series with multiple structural breaks and high volatility. CAM Transactions on Intelligence Technology, 6(3), 265-280. https://doi.org/10.1049/cit2.12002Links ]

Kim, J., & Baek, C. (2018). Neural network heterogeneous autoregressive models for realized volatility. Communications for Statistical Applications and Methods, 25(6), 659-671. https://doi.org/10.29220/CSAM.2018.25.6.659Links ]

Kim, Y., & Enke, D. (2018). A dynamic target volatility strategy for asset allocation using artificial neural networks. The Engineering Economist, 63(4), 273-290. https://doi.org/10.1080/0013791X.2018.1461287Links ]

Kristjanpoller, W., Fadic, A., & Minutolo, M. C. (2014). Volatility forecast using hybrid neural network models. Expert Systems with Applications, 41(5), 2437-2442. https://doi.org/10.1016/j.eswa.2013.09.043Links ]

Kristjanpoller, W., & Minutolo, M. C. (2015). Gold price volatility: A forecasting approach using the artificial neural network-GARCH model. Expert Systems with Applications, 42(20), 7245-7251. https://doi.org/10.1016/j.eswa.2015.04.058Links ]

Kristjanpoller, W., & Minutolo, M. C. (2016). Forecasting volatility of oil price using an artificial neural network-GARCH model. Expert Systems with Applications, 65, 233-241. https://doi. org/10.1016/j.eswa.2016.08.045Links ]

Kristjanpoller, W., & Minutolo, M. C. (2018). A hybrid volatility forecasting framework integrating GARCH, artificial neural network, technical analysis and principal components analysis. Expert Systems with Applications, 109, 1-11. https://doi.org/10.1016/j.eswa.2018.05.011Links ]

Kwak, S., Hwang, Y., Choi, Y., Wang, J., Kim, S., & Kim, J. (2022). Reconstructing the local volatility surface from market option prices. Mathematics, 10(14), 2537. https://doi.org/10.3390/math10142537Links ]

Kyoung-Sook, M. O. O. N., & Hongjoong, K. I. M. (2019). Performance of deep learning in prediction of stock market volatility. Economic Computation & Economic Cybernetics Studies & Research, 53(2). https://doi.org/10.24818/18423264/53.2.19.05Links ]

Lantz, B. (2019). Machine learning with R: expert techniques for predictive modeling. Packt publishing ltd. [ Links ]

Lei, B., Liu, Z., & Song, Y. (2021a). On stock volatility forecasting based on text mining and deep learning under high frequency data. Journal of Forecasting, 40(8), 1596-1610. https://doi.org/10.1002/for.2794Links ]

Lei, B., Zhang, B., & Song, Y. (2021b). Volatility forecasting for high-frequency financial data based on web search index and deep learning model. Mathematics, 9(4), 320. https://doi.org/10.3390/math9040320Links ]

Li, Y., Jiang, S., Li, X., & Wang, S. (2021). The role of news sentiment in oil futures returns and volatility forecasting: Data-decomposition based deep learning approach. Energy Economics, 95, 105140. https://doi.org/10.1016/j.eneco.2021.105140Links ]

Liao, R., Yamaka, W., & Sriboonchitta, S. (2020). Exchange rate volatility forecasting by hybrid neural network Markov switching beta-t-EGARCH. IEEEAccess, 8, 207563-207574. https://doi.org/10.1109/ACCESS.2020.3038564Links ]

Liu, Y. (2019). Novel volatility forecasting using deep learning-long short term memory recurrent neural networks. Expert Systems with Applications, 132, 99-109. https://doi.org/10.1016/j.eswa.2019.04.038Links ]

Liu, X., & Fu, H. (2016). Volatility forecasting for interbank offered rate using grey extreme learning machine: The case of China. Chaos, Solitons & Fractals, 89, 249-254. https://doi.org/10.1016/j.chaos.2015.11.033Links ]

Liu, F. Y., & Liu, F. X. (2006). Currency options volatility forecasting with shift-invariant wavelet transform and neural networks. In I. King, J. Wang, L. W. Chan, D. Wang (Eds.), Neural Information Processing. ICGNIP 2006. Lecture Notes in Computer Science, vol 4234 (pp. 461-468). Springer. https://doi.org/10.1007/11893295_51Links ]

Liu, S., Oosterlee, C. W., & Bohte, S. M. (2019). Pricing options and computing implied volatilities using neural networks. Risks, 7(1), 16. https://doi.org/10.3390/risks7010016Links ]

Medeiros, M. C., McAleer, M., Slottje, D., Ramos, V., & Rey-Maquieira, J. (2008). An alternative approach to estimating demand: Neural network regression with conditional volatility for high frequency air passenger arrivals. Journal of Econometrics, 147(2), 372-383. https://doi.org/10.1016/j.jeconom.2008.09.018Links ]

Mo, H., & Wang, J. (2013). Volatility degree forecasting of stock market by stochastic time strength neural network. Mathematical Problems in Engineering, https://doi.org/10.1155/2013/436795Links ]

Othman, A. H. A., Kassim, S., Rosman, R. B., & Redzuan, N. H. B. (2020). Prediction accuracy improvement for Bitcoin market prices based on symmetric volatility information using artificial neural network approach. Journal of Revenue and Pricing Management, 19, 314-330. https://doi.org/10.1057/s41272-020-00229-3Links ]

Ou, P., & Wang, H. (2012). Applications of Support Vector Machine in modeling and forecasting stock market volatility. International Information Institute (Tokyo). Information, 15(8), 3365-3376. [ Links ]

Ou, P., & Wang, H. (2014). Volatility modelling and prediction by hybrid support vector regression with chaotic genetic algorithms. The International Arab Journal of Information Technology, 11(3), 287-292. https://iajit.org/PDF/vol.11,no.3/4788.pdfLinks ]

Patnaik, S. (2020). Applied machine learning and management of volatility, uncertainty, complexity & ambiguity (VUCA). Journal of Intelligent & Fuzzy Systems: Applications in Engineering and Technology, 9(2), 1409-1416. https://doi.org/10.3233/JIFS-179915Links ]

Peng, J., & Liu, Z. (2011). pth Moment stability of stochastic neural networks with Markov volatilities. Neural Computing and Applications, 20, 543-547. https://doi.org/10.1007/s00521-011-0542-5Links ]

Petneházi, G., & Gáll, J. (2019). Exploring the predictability of range-based volatility estimators using recurrent neural networks. Intelligent Systems in Accounting, Finance and Management, 26(3), 109-116. https://doi.org/10.1002/isaf.1455Links ]

Pradeepkumar, D., & Ravi, V. (2017). Forecasting financial time series volatility using particle swarm optimization trained quantile regression neural network. Applied Soft Computing, 58, 35-52. https://doi.org/10.1016/j.asoc.2017.04.014Links ]

Qu, H., & Ji, P. (2014). Adaptive heterogeneous autoregressive models of realized volatility based on a genetic algorithm. Abstract and Applied Analysis. https://doi.org/10.1155/2014/943041Links ]

Qu, H., & Ji, P. (2016). Modeling realized volatility dynamics with a genetic algorithm. Journal of Forecasting, 35(5), 434-444. https://doi.org/10.1002/for.2386Links ]

Petrozziello, A., Troiano, L., Serra, A., Jordanov, I., Storti, G., Tagliaferri, R., & La Rocca, M. (2022). Deep learning for volatility forecasting in asset management. Soft Computing, 26, 8553-8574. https://doi.org/10.1007/s00500-022-07161-1Links ]

Rahman, Q. A., Janmohamed, T., Pirbaglou, M., Clarke, H., Ritvo, P., Heffernan, J. M., & Katz, J. (2018). Defining and predicting pain volatility in users of the Manage My Pain app: Analysis using data mining and machine learning methods. Journal of Medical Internet Research, 20(11), e12001. https://doi.org/10.2196/12001Links ]

Ramos-Pérez, E., Alonso-González, P. J., & Núñez-Velázquez, J. J. (2019). Forecasting volatility with a stacked model based on a hybridized Artificial Neural Network. Expert Systems with Applications, 129, 1-9. https://doi.org/10.1016/j.eswa.2019.03.046Links ]

Santamaría-Bonfil, G., Frausto-Solís, J., & Vázquez-Rodarte, I. (2015). Volatility forecasting using support vector regression and a hybrid genetic algorithm. Computational Economics, 45, 111-133. https://doi.org/10.1007/s10614-013-9411-xLinks ]

Seo, M., & Kim, G. (2020). Hybrid forecasting models based on the neural networks for the volatility of Bitcoin. Applied Sciences, 10(14), 4768. https://doi.org/10.3390/app10144768Links ]

Sermpinis, G., Laws, J., & Dunis, C. L. (2013). Modelling and trading the realised volatility of the FTSE100 futures with higher order neural networks. The European Journal of Finance, 19(3), 165-179. https://doi.org/10.1080/1351847X.2011.606990Links ]

Slim, C. (2004, May). Forecasting the volatility of stock index returns: A stochastic neural network approach. In A. Laganá, M. L. Gavrilova, V. Kumar, Y. Mun, C. J. K. Tan, & O. Gervasi (Eds.), Computational Science and Its Applications - ICCSA 2004. ICCSA 2004. Lecture Notes in Computer Science, vol 3045 (pp. 935-944). Springer. https://doi.org/10.1007/978-3-540-24767-8_98Links ]

Stone, H. (2020). Calibrating rough volatility models: a convolutional neural network approach. Quantitative Finance, 20(3), 379-392. https://doi.org/10.1080/14697688.2019.1654126Links ]

Tang, L. B., Tang, L. X., & Sheng, H. Y. (2009). Forecasting volatility based on wavelet support vector machine. Expert Systems with Applications, 36(2-2), 2901-2909. https://doi.org/10.1016/j.eswa.2008.01.047Links ]

Tino, P., Schittenkopf, C., & Dorffner, G. (2001). Financial volatility trading using recurrent neural networks. IEEE Transactions on Neural Networks, 12(4), 865-874. https://doi.org/10.1109/72.935096Links ]

Tseng, C. H., Cheng, S. T., Wang, Y. H., & Peng, J. T. (2008). Artificial neural network model of the hybrid EGARCH volatility of the Taiwan stock index option prices. Physica A: Statistical Mechanics and its Applications, 387(13), 3192-3200. https://doi.org/10.1016/j.physa.2008.01.074Links ]

Tung, W. L., & Quek, C. (2011). Financial volatility trading using a self-organising neural-fuzzy semantic network and option straddle-based approach. Expert Systems with Applications, 38(5), 4668-4688. https://doi.org/10.1016/j.eswa.2010.07.116Links ]

Vortelinos, D. I. (2017). Forecasting realized volatility: HAR against Principal Components Combining, neural networks and GARCH. Research in International Business and Finance , 39, 824-839. https://doi.org/10.1016/j.ribaf.2015.01.004Links ]

Vrontos, S. D., Galakis, J., & Vrontos, I. D. (2021). Implied volatility directional forecasting: a machine learning approach. Quantitative Finance, 21(10), 1687-1706. https://doi.org/10.1080/14697688.2021.1905869Links ]

Wang, A., & Liu, Y. (2020). Intelligent financial management of company based on neural network and fuzzy volatility evaluation. Journal of Intelligent & Fuzzy Systems, 38(6), 7215-7228. https://doi.org/10.3233/JIFS-179798Links ]

Wang, B., Huang, H., & Wang, X. (2013). A support vector machine based MSM model for financial short-term volatility forecasting. Neural Computing and Applications, 22, 21-28. https://doi.org/10.1007/s00521-011-0742-zLinks ]

Wang, C. P., Lin, S. H., Huang, H. H., & Wu, P. C. (2012). Using neural network for forecasting TXO price under different volatility models. Expert Systems with Applications, 39(5), 5025-5032. https://doi.org/10.1016/j.eswa.2011.11.038Links ]

Wang, F., Tang, S., & Li, M. (2021). Advantages of Combining Factorization Machine with Elman Neural Network for Volatility Forecasting of Stock Market. Complexity , 1-12. https://doi. org/10.1155/2021/6641298Links ]

Wang, Y., Liu, H., Guo, Q., Xie, S., & Zhang, X. (2019). Stock volatility prediction by hybrid neural network. IEEE Access, 7, 154524-154534. https://doi.org/10.1109/ACCESS.2019.2949074Links ]

Weerasingha, J. P., Bandara, Y. M., & Edirisinghe, P. M. (2021). Determining the invoicing dates for raw material order and finish product dispatch using neural networks under exchange rate volatility. International Journal of Logistics Research and Applications, 26(2), 211-231. https://doi.org/10.1080/13675567.2021.1945018Links ]

Wei, L. Y. (2012). An adaptive expectation genetic algorithm based on ANFIS and multinational stock market volatility causality for TAIEX forecasting. Cybernetics and Systems, 43(5), 410-425. https://doi.org/10.1080/01969722.2012.688687Links ]

Xia, A. G., Stroud, C. A., & Makar, P. A. (2011). Development of a simple unified volatility-based scheme (suvs) for secondary organic aerosol formation using genetic algorithms. Atmospheric Chemistry and Physics, 11(13), 6185-6205. https://doi.org/10.5194/acp-11-6185-2011Links ]

Xu, L. (2021). Stock volatility prediction based on convolutional neural network. Basic & Clinical Pharmacology & Toxicology, 128(S1), 178. [ Links ]

Yang, R., Yu, L., Zhao, Y., Yu, H., Xu, G., Wu, Y., & Liu, Z. (2020). Big data analytics for financial Market volatility forecast based on support vector machine. International Journal of Information Management, 50, 452-462. https://doi.org/10.1016/j.ijinfomgt.2019.05.027Links ]

Zeng, Y., & Klabjan, D. (2019). Online adaptive machine learning based algorithm for implied volatility surface modeling. Knowledge-Based Systems, 163(1), 376-391. https://doi.org/10.1016/j.knosys.2018.08.039Links ]

Zhai, J., Cao, Y., & Liu, X. (2020). A neural network enhanced volatility component model. Quantitative Finance , 20(5), 783-797. https://doi.org/10.1080/14697688.2019.1711148Links ]

Zhu, E., Yang, G., & Liu, J. (2013). Comments and further improvements on "pth moment stability of stochastic neural networks with Markov volatilities." Neural Computing and Applications, 23(3), 1179-1183. https://doi.org/10.1007/s00521-013-1396-9Links ]

1Other databases such as Scopus were not employed considering that the Web of Science social science citation index (SSCI) includes most of the top journals included in Scopus for the analyzed research field. Additionally, the obtained data provided enough information to develop the analysis.

2Natural language processing "is a theoretically motivated range of computational techniques for analyzing and representing naturally occurring texts at one or more levels of linguistic analysis for the purpose of achieving human-like language processing for a range of tasks or applications" (Fisher et al., 2016)

3For more details about the K-means model and the Bibliometrix package, please refer to Lantz (2019) and Aria and Cuccurrullo (2017).

4Neural networks and deep learning models can be defined as nonlinear techniques characterized by a set of input and output nodes connected using a structure that mimics the human brain (Enke & Thawornwong, 2005). Support vector machine models are a kind of supervised learning model used for classification and regression analysis (Khashman & Nwulu, 2011).

5Hybrid models correspond to techniques in which the results obtained from two or more individual models are combined (assembled).

Para citar este artículo: Molina Muñoz, J., & Castañeda, R. (2023). The Use of Machine Learning in Volatility: A Review Using K-Means. Revista Universidad & Empresa, 25(44), 1-28. https://doi.org/10.12804/revistas.urosario.edu.co/empresa/a.11969

Received: May 02, 2022; Accepted: April 14, 2023

Creative Commons License This is an open-access article distributed under the terms of the Creative Commons Attribution License