


 English (pdf)
 Article in xml format
 Article references
 Send this article by e-mail
 Cited by SciELO
  Cited by Google
  Similars in
SciELO
Similars in
SciELO  Similars in Google
 Permalink
Introduction
Roads and their traffic can affect wildlife over large areas and, in regions with dense road networks, may influence a high proportion of the ecological landscape (Cooke et al., 2020a). In Costa Rica, for example, 41.2 % of the protected areas are directly or indirectly influenced by the effect of roads, and 532.52 km of roads are adjacent to, or less than 2 km away from protected areas (Arévalo & Blau, 2018).
Due to the complexity of biotic communities in tropical ecosystems, roads generate a soaring pressure in their vicinity (Trombulak & Frissell, 2000). Among the negative impacts related to roads are: a) isolation of wildlife populations and road kills (Keller & Largiader, 2003); b) proliferation of exotic species along the roadside (Forman & Deblinger, 2000); c) changes in the microclimatic conditions at forest edges (Pohlman et al., 2009); d) exposure to chemicals pollutants (dust, heavy metals, nutrients, ozone and organic molecules; Laurance et al., 2009); e) invasions of hunters, miners, colonists and land speculators, which can be a cause of additional hunting pressure on wildlife (Laurance et al., 2009); and f) noise pollution (Francis & Barber, 2013).
Many studies have associated road disturbances with noise, since it can interfere with the acoustic communication, due to a masking effect from vehicular noise (Dooling & Popper, 2007). The masking effect occurs when the distance at which an acoustic signal can be heard is reduced by the anthropogenic background noise (Marten & Marler, 1977). Many bird species modify their vocalization behavior to overcome the masking effect by modifying the amplitude, frequency, duration, timing or rate of their vocalizations (Pieretti & Farina, 2013; Roca et al., 2016). Furthermore, noise can impose selective constraints and pressures on species using acoustic signals to communicate and reproduce (Pieretti & Farina, 2013). For instance, short-term noise exposure may decrease nestling body size and increase in the oxidative stress of Tree Swallows (Injaian et al., 2018).
Species spatial distribution can also be affected by road exposure. For example, bird movements, abundance, occurrence, and richness have been negatively correlated with road exposure (Reijnen et al., 1997; Laurance et al., 2004; Herrera-Montes & Aide, 2011; Cooke et al., 2020b). In Costa Rica, the number of biophonies (measured as the seconds occupied by bird vocalizations) was significantly lower near the road in Carara National Park (Arévalo & Blau, 2018). This difference was probably related to decreased bird density where road noise was highest (Arévalo & Newhard, 2011).
Other authors have used acoustic indices to characterize biotic communities relative to road disturbances, as they offer a relatively fast method of processing acoustic data (Sueur et al., 2008). For example, Pieretti & Farina (2013) used the Acoustic Complexity Index (ACI) (Pieretti et al., 2011) to quantify bird vocalization dynamics in a landscape influenced by road noise; they found a positive relationship between ACI and distance to the road. In Costa Rica, Tenez (2016) also found higher ACI values at the edge of the road in Santa Rosa National Park and attributed this result to bird vocalizations. In addition, sites located 10 m away from the road showed the highest proportion of anthrophonies, while sites located 500 m away presented the highest proportion of biophonies.
The Braulio Carrillo National Park (BCNP) is one of the most extensive protected areas in central Costa Rica, with 47 689 hectares. It holds approximately 6000 species of plants and thousands of animal species (Boza, 1992). This protected area is crossed by National Highway 32, through which 80 % of the country’s import and export goods are transported (Fernández, 2013). Furthermore, plans exist to expand Highway 32, which might increase vehicular flow through this protected area. Updated information about possible influences of Highway 32 on biodiversity is required to assess present and future impacts, and to support management actions.
The objective of this study was to assess the structural complexity of vegetation, soundscape and bird communities in two areas of BCNP with different anthropogenic alteration related to road exposure, as baseline information for park biodiversity conservation and management. The area near the Highway 32 was expected to show higher habitat disturbance, higher sound pressure level and more disturbed vegetation structure than the remote area. In addition, we expected also the bird community to be less diverse, the soundscape to have a lower proportion of biophonies than anthrophonies, and lower acoustic diversity or acoustic complexity.
Materials and methods
Study area. The BCNP is located in the Central Volcanic Mountain Range in Costa Rica. It receives almost 6000 mm of precipitation annually, with two brief dry periods between January-April and September-October (Blake & Loiselle, 2000). The park belongs to the Phytogeographic Unit of the Caribbean Foothill, characterized by abundant and heterogeneous vegetation, and an understory dominated by palms (Zamora, 2008). The park is crossed by the national Highway 32; this road was constructed in 1977 to connect the Central Valley with the Caribbean coast. The construction of the road implied the opening of forest cover in a radius of up to 1 km for the passage of machinery and storage of materials (Pérez et al., 2009). To avoid further destruction of the forest, the national park was created in 1978.
The study was conducted at two sites within the BCNP, each selected based on its distance from Highway 32 (Figure 1). The sites are named “Quebrada” (10°09’42.35”N- 83°56’16.11”W; on Highway 32 and “Ceibo” (10°19’14.25 ”N- 84°04’28.87”W; ~ 20km from Highway 32, and ~10 km from another paved road). Quebrada is a Ranger Station dedicated mostly to public use, and it is located on Highway 32. The area surrounding the trails belonged to cattle farms in the mid-20th century, thus the vegetation composition still maintains the characteristics of a regenerating forest (Pérez et al., 2009). Ceibo is a Sector of the BCNP devoted exclusively to protection and research and it is located at about 20 km away from Quebrada. The access to Ceibo is by a low-traffic unpaved road, and there is a minimum distance of 1.5 km from this road to the sampling points. Both Ceibo and Quebrada sites are included in the life zone “Very Humid Tropical Forest Transition to Premontane” and present an altitude between 500 and 600 m a.s.l. (TEC, 2014).
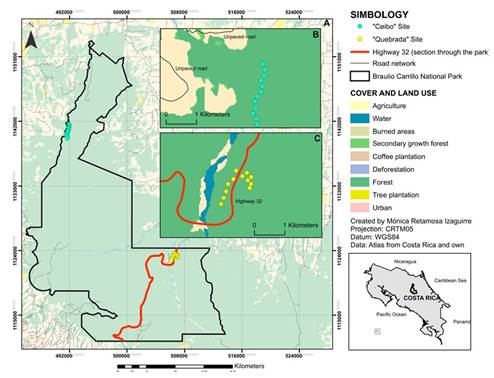
Figure 1 Location of Ceibo and Quebrada sites within the Braulio Carrillo National Park, Costa Rica, in reference to their distance from Highway 32. A, global view of the park; B, zoom view of Ceibo study site; C, zoom view of Quebrada study site
Sampling points:
At each study site we systematically placed 12 sampling points in transects along all available trails, where permission was granted by park rangers (Figure 1).
We placed the recorders 50 m away from the trail, on a central tree selected trying to avoid obstacles that could interfere with sound propagation. All sampling points were located at a distance of 200 m from each other, to reduce the superposition of sounds between two adjacent recording points and ensure a good spatial sampling of the soundscape (Farina et al., 2011). However, we did not quantify detection spaces of the sites (as recommended in Darras et al., 2015).
We made four visits to each study site between June 2017 and August 2018. Sampling periods were not simultaneous at both sites; however, we systematically alternated visits between sites, to get a representative sample of the bird and soundscape events that occur throughout the year. Two visits were conducted during the rainy season of 2017 (Quebrada: June and October; Ceibo: September and November), one visit during the dry season of 2018 (Ceibo: February; Quebrada: April), and one visit during the rainy season of 2018 (Ceibo: May; Quebrada: August).
Habitat Survey:
We measured the vegetation structure around each of the 12 sampling points. From a central tree we established four 3x20 m plots, to measure the stem diameter of trees greater than 5 cm of diameter at breast height (DBH). Within each plot, we established two 3x3 m subplots to measure the DBH of those individuals between 1 and 5 cm with an approximate height ≥1.30 m; otherwise, they were only counted for that diameter class. Within these subplots, we established two 2x1 m subplots to count individuals with less than 1 cm of DBH. With the vegetation data, we calculated three vegetation structure variables for each sampling point (Table 1).
Table 1 Description of the environmental variables, bird parameters and acoustic indices calculated for each sampling point at Ceibo and Quebrada sites of Braulio Carrillo National Park, Costa Rica
| Environmental Variable | Code | Description |
|---|---|---|
| Basal Area | basal_total | Total Basal Area |
| Abundance 5 cm | abund_ind_5 | Number of individuals more than 5 cm DBH |
| Abundances 1-5 cm | abund_1 to 5 | Number of individuals 1-5 cm DBH |
| Vertical canopy opening | GAP_v | Measures the opening of the forest in relation to the number of opening pixels and forest cover for pictures taken at 45° |
| Horizontal canopy opening | GAP_h | Measures the opening of the forest in relation to the number of opening pixels and forest cover for pictures taken horizontally. |
| Vertical Mean information gain | MIG_v | Vegetation vertical structural complexity |
| Horizontal Mean information gain | MIG_h | Vegetation horizontal structural complexity |
| Bird parameter | Description | |
| Bird abundance | Abundance | Number of individuals of all bird species. |
| Bird richness | Richness | Number of species. |
| Shannon index | Shannon | Shannon diversity (Shannon & Weaver, 1949). |
| Pielou index | Pielou | Evenness of Pielou (Pielou, 1984). |
| Acoustic Indices | Description | |
| Acoustic Complexity Index | ACI | Measures the variability of sound intensity over time and frequency. Higher values indicate more complex soundscapes (Pieretti et al., 2011). |
| Acoustic Diversity Index | ADI | Summarizes sound intensity distribution applying the Shannon index over the proportion of signals above an intensity threshold across the spectrum. High values indicate that sound intensity is spread evenly across frequency bands (Villanueva-Rivera et al., 2011). |
| Acoustic Evenness Index | AEI | Same as the ADI, but the Gini index is applied across all frequency bins (Villanueva-Rivera et al., 2011). High values indicate sound intensity is restricted to a narrow frequency. range. |
| Bioacoustic Index | BIO | Is a function of both amplitude and number of occupied frequency bands between 2-11 kHz. It is calculated as the area under each curve included all frequency bands associated with the dB value that was greater than the minimum dB value for each curve. The higher values indicate greater disparity between bands (Boelman et al., 2007). |
| Median Amplitude Envelope | MAE | Shows the median of the amplitude envelope normalized by the maximum value to give results between 0-1. Higher values reflect noisier soundscapes (Depraetere et al., 2012). |
| Normalized Difference Soundscape Index | NDSI | Calculates the ratio (biophony − anthrophony) / (biophony + anthrophony). Where biophony is the energy on the frequency range 2-8 kHz and anthrophony between 1-2 kHz. (Kasten et al., 2012). Higher values indicate a higher proportion of sound intensity in the biophony band. |
| Number of Peaks | NP | Counts the number of major frequency peaks obtained on a mean spectrum scaled between 0 and 1. Higher values indicates a greater frequency spectral complexity (Gasc et al., 2013). |
| Spectral Entropy | Hf | Divides intensity values by the sum of intensity in a frequency band. Calculates the entropy for these values using the negative sum of each value multiplied by the log of the value and divided by the log of the number of intensity values (Sueur et al., 2008). Higher values indicate evenly distributed sound across frequency bands. |
| Temporal Entropy | Ht | Divides intensity values by the sum of intensities in a time step. Calculates entropy for these values using the negative sum of each value multiplied by the log of the value and divided by the log of the number of intensity values. (Sueur et al., 2008). Higher values indicate evenly distributed sound over time. |
| Total Entropy | TE | It is the product of Hf * Ht. Quantifies the variation across time and frequency (Sueur et al., 2008). Higher values indicate evenly distributed sounds across frequency and time. |
| Mean Sound Pressure Level | SPLMean | Calculates the average sound pressure level in dB, using a decibel reference value of 2x10⁻⁵ Pa. Higher values indicate louder soundscapes. |
Additionally, we took four horizontal and four vertical photographs (at about 45° angle) at each sampling point, following the recommendations provided in Martin and Proulx (2016), with the modification that no photograph touched the ground. For this, we used a Canon 80D camera with an 18-135 mm canon lens (EF-S f / 3.5-5.6 IS USM, Canon Inc.) and the following settings: variable exposure, 15 mm focal length, f / 6.3 aperture, variable ISO, 2816-1880 resolution, automatic focus, image stabilizer on, and JPG type of compression. Each group of photographs was sorted by study site and sampling point to characterize the geometry of the forest using the following variables: MIG (average information gain, a measure of structural complexity; Proulx & Parrott, 2008) and GAP (opening fraction, which measures the opening of the forest in relation to the number of opening pixels and forest cover; Rosin, 2001). The estimation parameters were obtained by using the “gap_fraction” and “calculateHisto” functions of the “LAI and imagemetrics” package (https://github.com/cmartin/ImageAnalysisPrimer). Four vegetation structure complexity variables were obtained for each sampling point (Table 1).
Bird Community Survey. We conducted bird point counts on each sampling point at a distance of about 20 meters from the recorders, to avoid interference during recording times. We conducted two daily counting sessions (four counts per visit) during peak hours of bird activity (~ 6:00-8:00 and ~ 14:00-16:00). At each point, we recorded number of species and number of individuals of each species detected visually and aurally during 6 minutes in a 25 meters radius. We obtained four bird “parameters” for each sampling point (Table 1). However, these parameters do not represent actual estimated parameters at the population or community level, as we did not consider detectability. For example, richness represents observed richness (number of species) at each sampling point. Abundance represents observed total abundance, i.e. the total numbers of individuals of all species detected at each sampling point.
Soundscape Survey. We located 12 “Song Meter Digital Field Recorders 2 Plus” (SM2 +; Wildlife Acoustics Inc.) to make soundscape recordings. We installed recorders at the central tree of each sampling point at an approximate height of 1.30 m. In each recorder, two omnidirectional microphones were placed, so the recording was made through two channels (in stereo). Audio files were recorded in wav format (16-bit, 44.1 kHz) and stored on 64GB capacity SDHC memory cards. The recorders were programmed to make continuous recordings during bird activity peaks (4:00-6:59 and 15:00-17:59), and for periods of 10 minutes at the beginning of each hour between 7:00 and 14:59. This recording scheme was implemented for two consecutive days during each visit to each study site, for a total of four separate visits per site.
The soundscape recordings were previewed aurally and visually through a spectrogram to facilitate identification of undesired noise such as heavy rain in the audio file, using the Adobe Audition CC v.6 program. We removed the minute files showing heavy rains, keeping in total 81 060 minutes of recordings used in the analysis (42 480 minutes at Ceibo and 38 580 minutes at Quebrada). We analyzed soundscape recordings using eleven of the most commonly used acoustic indices, because they represent different components of the soundscape (Table 1). The acoustic indices ACI, ADI, AEI and BIO were calculated using a maximum frequency of 11 000 Hz. All acoustic indices were calculated for one-minute recording fragments and averaged for each study site, sampling point and time of day (4:00 to 17:00).
Data Analysis. To compare environmental variables, bird parameters and acoustic indices between sites, we conducted Welch tests for each of them, separately. This approach was chosen to take into account variance heterogeneity of the data. The results were represented graphically, showing P value, using an alpha of 0.05.
To conduct a multivariable description of variability at both sites, based on the measured variables, we used a multiple factor analysis (Pagès, 2002). Variables were assembled into three groups: environmental variables, bird parameters and acoustic indices (Table 1). All variables, except site, were numerical and therefore scaled to have a mean of 0 and a variance of 1 (each variable was subtracted from its mean and divided by its standard deviation).
All analyses and graphs were performed using the R programming environment (R Core Team, 2019). To calculate acoustic indices, we used the following packages for R: Sinax (https://rdrr.io/github/osoramirez/Sinax/), Soundecology (Villanueva-Rivera & Pijanowski, 2016) and Seewave (Sueur et al., 2016). We used the Biodiversity® package (Kindt, 2015) to analyze bird point count data; ggstatsplot for comparison of variables between sites (Patil, 2018), and FactoMine® for multiple factorial analysis (Lê et al., 2008).
Results
Comparison of variables between sites: Ceibo showed a higher density of trees with a DBH > 5 cm, and shrubs with a DBH of 1-5 cm, and higher complexity of forest structure (higher MIG, both vertically and horizontally). On the contrary, Quebrada showed more open vegetation structure, with larger gaps both vertically and horizontally. However, total basal area was similar at both sites (Figure 2).
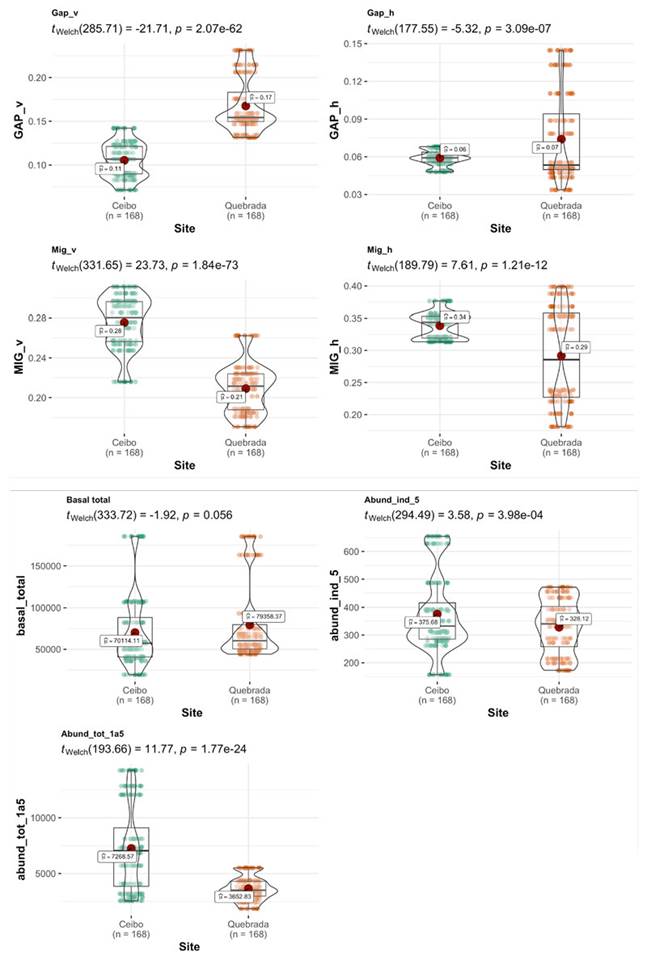
Figure 2 Comparison of environmental variables between Ceibo and Quebrada sites in the Braulio Carrillo National Park, Costa Rica. Graphic shows Welch test results, 95% confidence interval, p-value (for an alpha value of 0.05) and n.
Based on bird point counts, we found that bird community was more abundant, rich and diverse at Quebrada than at Ceibo; however, it was more even at Ceibo than at Quebrada (Figure 3). We detected 127 bird species in Ceibo (33 families and 111 genera), and 157 species in Quebrada (40 families and 124 genera). Of the total 170 species, 73 (43 %) were shared by both sites, 75 (44 %) were detected only in Quebrada, and 22 (13 %) were found only in Ceibo. Bird community at Ceibo was mainly composed of forest and forest-edge species, while Quebrada had several species from open areas as well (those preferring environments with reduced forest cover or early successional states).
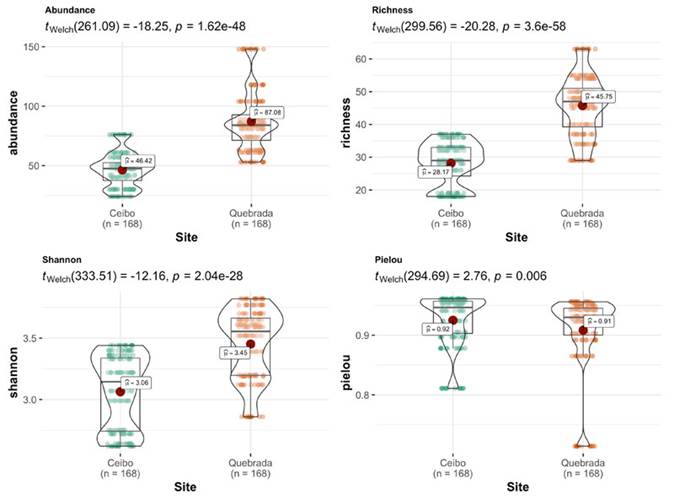
Figure 3 Comparison of bird parameters between Ceibo and Quebrada sites in the Braulio Carrillo National Park, Costa Rica. Graphic shows Welch test results, 95% confidence interval, p-value (for an alpha value of 0.05) and n.
Acoustic indices showed a community with higher complexity and bioacoustic activity in Quebrada than Ceibo; however, Ceibo presented higher proportion of biophonies than anthrophonies, and an acoustic community with higher diversity, higher frequency entropy, and total entropy than Quebrada. Indices SPLmean and MAE also showed higher sound pressure level in Quebrada than in Ceibo (Figure 4).
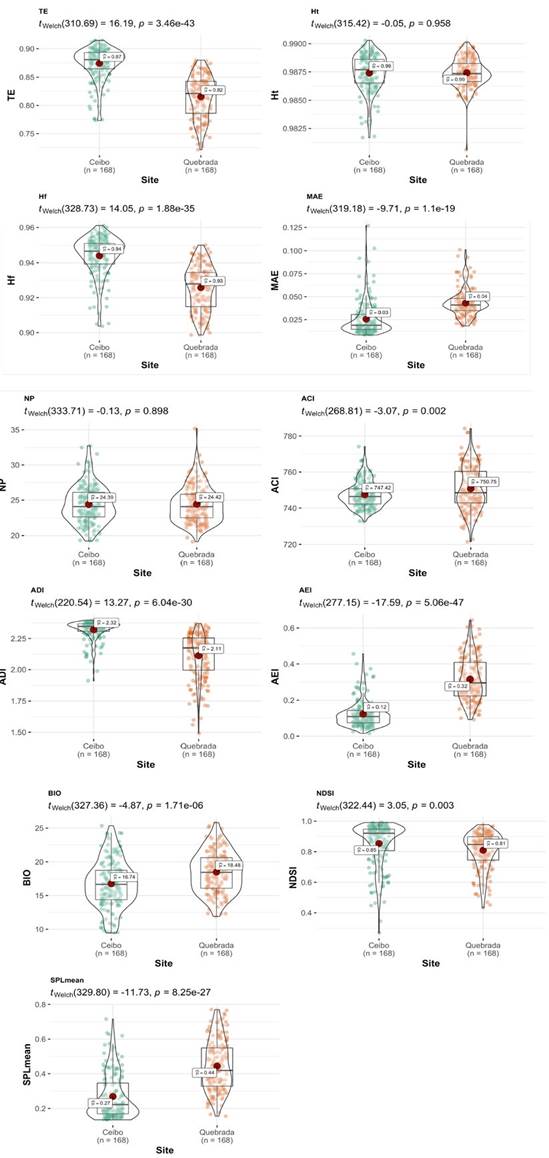
Figure 4 Comparison of acoustic indices between Ceibo and Quebrada sites in the Braulio Carrillo National Park, Costa Rica. Graphic shows Welch test results, 95% confidence interval, p-value (for an alpha value of 0.05) and n.
Multivariable description of variability at the study sites: Ceibo and Quebrada sites separated completely in the multiple factor analysis; besides, each of the sampling points clustered around the ellipse that represents the corresponding study site (Figure 5).
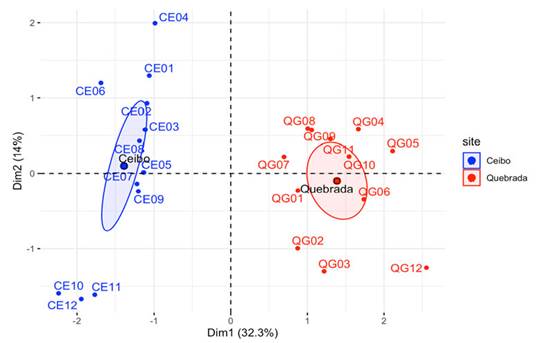
Figure 5 Multiple factor analysis in Ceibo and Quebrada sites at the Braulio Carrillo National Park of Costa Rica, according to 3 groups of variables used (environmental variables, acoustic indices, and bird parameters). Each sampling point is named on the graphic using 4 digits, the first two indicate the study site (CE = Ceibo and QG = Quebrada) and the last two refer to a consecutive number for each point from 1 to 12.
The first axis was mainly explained by bird indices (richness and abundance) and the vertical opening of the forest. The second axis was mostly explained by environmental variables representing abundance of shrubs 1-5 cm DBH and abundance of trees > 5 cm of DBH (Figure 6). The variables with the most explanatory value are those representing vegetation structure and complexity, and bird parameters. However, axis one and axis two together explain 47 % of the variance, meaning that there are still other factors explaining data variability, other than the ones measured in this study.
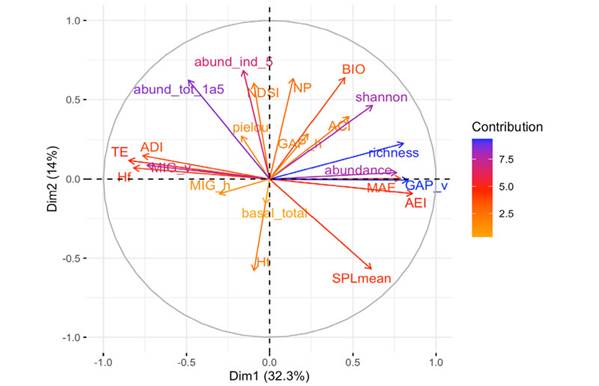
Figure 6 Multiple factor analysis in Ceibo and Quebrada sites of the Braulio Carrillo National Park of Costa Rica, according to three variable groups used (environmental variables, acoustic indices, and bird parameters). The variables with the larger value of contribution (darker color of arrow), contribute the most to the definition of the dimensions. Variables that contribute the most to Dim.1 and Dim.2 are the most important in explaining the variability in the data set.
Discussion
Our observations suggest that Ceibo was a more mature and preserved site than Quebrada, due to its higher horizontal and vertical complexity of vegetation structure, and higher density of trees and shrubs (Oosterhoorn & Kappelle, 2000; Proulx & Parrott, 2009). However, Quebrada presented a higher richness, abundance and diversity of birds than Ceibo, contrary to what we expected. This is inconsistent with other studies, which have found higher richness and abundance in sites with higher complexity of vegetation structure (Schulze et al., 2004; Mulwa et al., 2012); however, other authors have shown a higher bird diversity in secondary habitats, which provide a variety of niches for species with different habitat requirements (Becker & Agreda, 2005; Gray et al., 2007). Furthermore, our results are also inconsistent with other studies showing a negative correlation between abundance, occurrence and richness of birds and levels of vehicular noise (Reijnen et al., 1997; Herrera-Montes & Aide, 2011; Arévalo & Newhard, 2011).
We found bird species commonly inhabiting open areas, such as Dives dives, Myiozetetes granadensis, and Tyrannus melancholicus, only in Quebrada. These results could be related to a more disturbed vegetation structure in Quebrada, as a possible consequence of anthropogenic factors, such as road exposure, tourism activity, and historical management in the site (Pérez et al., 2009). Roads themselves create open gaps, favoring microclimatic edge gradients (Pohlman et al., 2007), and the proliferation of plant species that attract and sustain a higher diversity of birds in these areas (Levey, 1988; Flores & Dezzeo, 2005). Moreover, the nearby presence of the Río Sucio canyon could also contribute to explain the higher diversity of birds in Quebrada, since it connects the site with grasslands in the lower plains of the Caribbean slope (Gillies & Clair, 2008).
ACI and BIO were higher at Quebrada than at Ceibo, like bird parameters. ACI has shown mixed results regarding its ability as a bird indicator. Some studies found positive relationships between ACI and number of bird vocalizations (Pieretti et al., 2011), species richness and bird abundance (Eldridge et al., 2018; Retamosa et al., 2018), or bioacoustic activity in general (Towsey et al., 2014). Other studies found weak or negative relationships between ACI and species richness or biophonic activity (Mammides et al., 2017; Eldridge et al., 2018). Nevertheless, ACI has been more consistently associated with vehicular noise in other studies, showing a positive relationship with traffic noise (Pierreti & Farina, 2013; Tenez, 2016). These authors argued that birds may be attempting to propagate their signals with greater emphasis (e.g. amplified redundancy or song intensity) to offset noise masking effect. On the other hand, BIO has been tested in different environments, showing positive correlation with bird richness (Eldrigde et al., 2018), abundance (Retamosa et al., 2018), number of vocalizations (Pieretti et al., 2011) and biotic diversity (Fairbrass et al., 2017).
Despite higher bird diversity in Quebrada, this site seemed to be less acoustically diverse than Ceibo, with sound intensity spread unevenly across frequency bands (Villanueva-Rivera et al., 2011, Bradfer-Lawrence et al., 2019). Characteristics of some bird species found in Quebrada could help to understand these results. For example, many species in open areas rely more on visual signals compared to species that inhabit the interior of the forest, which rely primarily on acoustic signals (Laverde-R. et al., 2017, 2018). In fact, Laverde-R. et al. (2017) found evidence that birds that occupy closed or darker habitats have a greater variety of song syllables and less colorful plumages.
Furthermore, we observed bird flocks more frequently in Quebrada than in Ceibo, and they also included more individuals. Some species within the flock use special vocalizations to maintain group cohesion (Powell, 1985). However, these sounds are generally simple with notes designed for close-range communication to reduce predator detection risk (Greenberg, 2001). It has also been hypothesized that mixed flock species may have converged using similar vocalizations to mimic members of other species (Powell, 1985; Goodale & Kotagama, 2006). Based on this, presence of more abundant mixed flocks in Quebrada might help explain high bird abundance in this site, without necessarily resulting in higher acoustic diversity.
Presence of Highway 32 seemed to reflect in the acoustic environment. For example, SPLMean and MAE indices indicated an environment with higher sound pressure in Quebrada than Ceibo. Moreover, there was a higher proportion of anthrophonies than biophonies in Quebrada than in Ceibo. This is consistent with Tenez (2018), who found more anthrophonies near the paved entrance road to Santa Rosa National Park, Costa Rica. However, we found positive, high values in the NDSI index in both Ceibo and Quebrada, which indicated that soundscapes at both sites were mostly composed of biophonies.
In general, composition of both acoustic communities in Ceibo and Quebrada appears to indicate a better partitioned acoustic community in Ceibo. According to the acoustic niche hypothesis, soundscape is a limited resource, and individuals must compete to communicate effectively, resulting in sound niches, where the soundscape is spatially and temporally divided (Krause, 1987; Pijanowski et al., 2011). Therefore, the more complex the habitat, the more complex and specific the acoustic partition (Pieretti & Farina, 2013).
Some authors have criticized the use of population or community parameters as indicators of environmental disturbance (Temple & Wiens, 1989; Niemi et al., 1997; Campos-Cerqueira et al., 2019). For example, abundance of bird species fluctuates in a specific way, and may not represent the trend of other species (Venier & Pearce, 2004). Furthermore, changes in bird populations are generally associated with various factors, making it difficult to establish a cause-effect relationship with respect to the environmental changes evaluated (Temple & Wies, 1989). However, further insight could be attained by studying particular bird species, as well as other parameters related to communication behavior, condition, or reproductive success.
Overall, we could argue for an indirect effect of the road on the variables and parameters considered, through changes in the structural complexity of the vegetation surrounding it. Although bird parameters behaved unexpectedly in this study, soundscapes did seem to reflect well the habitat condition of both study sites, as seen in other studies (Do Nascimento et al., 2020), and are promising for evaluating the ecological condition of a site.

