![The development of the ideas of Thorstein Veblen in Ibero-America: 1944-2022. [A representative sample]](/img/en/prev.gif)


 English (pdf)
 Article in xml format
 Article references
 Send this article by e-mail
 Cited by SciELO
  Cited by Google
  Similars in
SciELO
Similars in
SciELO  Similars in Google
 Permalink
Crime is usually concentrated in places in cities called hotspots (Collazos, García, Mejía, Ortega, & Tobón, 2019). These areas reveal dynamics of criminal actors that can be prevented (Bond & Nader, 2018). In the United States, the place-based police surveillance model was implemented, which reduced drug trafficking, property crimes and improved police decentralization for the control of criminal gangs. Blattman, Ortega, Green & Tobón (2019) show the scope of the model in terms of deterrence or displacement of crime. In the same way, the police and community security models presuppose a knowledge of the interests and needs of the citizens, by the authorities, as well as mechanisms to verify the quality of police surveillance. (Frühling, 2007).
In Brazil, Ecuador, Guatemala, and Colombia, decentralization helped with territorial control and the development of citizen security programs (Frühling, 2007). In Rio de Janeiro, the Pacifying Police Units (UPP) and the Secretary of Security of Rio were implemented to reduce rates of violence and drug trafficking (Saborio, 2017). These units improved the perception of security and the respect of the police for human rights, given the decrease in police violence (Riccio, Ruediger, Ross, & Skogan, 2013). In Ecuador, the planned population approach model improved citizens' perception of the police and increased police presence in neighborhoods by 17.7% (Pontón & Rivera, 2016). These results reveal the effectiveness of the models mentioned in problem solving, as well as focusing on specific places such as neighborhoods or blocks (Bond & Nader, 2018).
In Colombia, the National Model of Community Surveillance by Quadrants (MNVCC, from the Spanish acronym) led the National Police to include the community as an actor in crime prevention and in the formation of communication networks (Frühling, 2007). The security models adopted by the National Police up to the MNVCC have evolved by proposing security work in conjunction with the community and citizens in general, giving police action a social character combined with security (Murillo, Sandoval and Escalante, 2020). Starting in 2016, patrolling in the streets was intensified, along with improvements in lighting and cleaning services (Blattman, Ortega, Green, & Tobón, 2019). The quadrants, or police districts, were grouped under the coordination of Immediate Attention Centres (formerly Commands) (CAI, from the Spanish acronym), which can support each other through reinforcements between patrols. This network of reinforcements and its scope on crime control is the object of analysis in this paper, with the city of Bogotá (Colombia's capital) as the epicentre. In addition to being the country's most important political and economic city, Bogotá was the first city to implement the current model of Community Surveillance in 2010 (National Police of Colombia, 2014).
The present analysis aims to offer inputs to encourage the debate on the potential use of the network of reinforcements as a tool for planning the police service in Colombia. So far, this type of patrol action is hardly mentioned in the Community Surveillance model. In practice, without a global vision of the set or network that all reinforcing ties would create, patrol action is limited to the support tied to criminal events that occur daily in different sectors of the city.
To develop the proposed analysis, the next section reviews the literature on the impact of community surveillance over crime fighting and hotspot control. The third section describes the analysis strategy, along with the data and variables used to develop it. The fourth presents and discusses the results of the first analysis block. The fifth presents the second block, focused on the network of reinforcements between CAI, its structure, and conditions. Section six closes with conclusions.
COMMUNITY POLICING, HOTSPOTS, AND POLICE ACTION NETWORKS
The community policing model in the United States, implemented in the 1970s, allowed for citizen participation in policy formulation and adopted problem-oriented policing approaches (Namgung, 2018). The community surveillance model allows a decentralized action of the authority and facilitates responses to the calls of citizens, by eliminating hierarchies in emergency responses (Fyfe, 1992). According to Riccio et al. (2013), the elimination of organizational pyramids improved communication channels among officers and enabled greater effectiveness in the deployment of police forces in territories with high crime rates. However, it is necessary to maintain coordination among institutions, police officers, and citizens to ensure consistent action on crime hotspots (Bond & Nader, 2018). Where the design of the support network can reduce the number of hotspots and their crime levels in cities (Sandoval, Velásquez and Riaño, 2023), as well as control their expansion and multiplication despite the scarcity of police resources and other urban and socioeconomic factors that promote the occurrence and spatial persistence of crime (Sandoval, 2018).
Community policing in recent years has been accompanied by geo-referencing of crime occurrence, which makes it possible to identify and analyze areas with high rates of victimization and the occurrence of crimes (Byrne & Pease, 2008) for police attention. This is observed, for example, in the results-oriented police program of the Military Police Command of Minas Gerais (Brazil), which focused on the deployment of force in small geographical areas impacted by crime and delinquency (Frühling, 2007).
This spatial strategy has a deterrent potential for criminal groups and with it seeks to increase the effectiveness in the allocation of troops, even more so if it is accompanied by a distribution of the number of patrollers in each area according to: response time, size, contiguity, compactness and convexity of the districts (D'Amico, Wang, Batta, & Rump, 2002). Other studies for the city of Buffalo (United States) allow us to appreciate the additional effect of minimization on patrol workers' workloads. With the redistribution of districts and the redefinition of police commands, the disparity in workloads is improved and the response times are optimized for emergency calls and conflict management (D'Amico et al., 2002).
In the Colombian context, the National Model of Community Surveillance by Quadrants (MNVCC) has facilitated communication between the citizen and the police, since it operates with a certain geographical delimitation (García, 2015), establishes quadrants within the city's localities, assigns them a police team that is responsible for their security and surveillance (Murillo, Sandoval and Escalante, 2020). Each quadrant is classified by geographic information, demographic, social and economic conditions along with the crime situation as determined by the National Police (Policía Nacional de Colombia, 2008, 2010, 2014). The action of the aforementioned Immediate Attention Centres (CAI), within the model, responds to socioeconomic factors, unemployment, and the presence of schools in each of their respective jurisdictions (Sandoval & Marin, 2017). However, the MNVCC is rigid as it is formed by static quadrants in the face of a crime that behaves dynamically, it responds to a geographic vision instead of prioritizing the attention to crimes, the quadrants present different sizes with no relation to the population or the incidence of crime, the quadrants are geographically defined and limited but there are gaps in their limits.
In the main Colombian cities of Bogotá and Medellín, where surveillance has been concentrated in hotspots, decreases in crimerates have been observed as a result of increased patrolling within each jurisdiction (Collazos et.al, 2019). These measures have direct effects on these points, in nearby neighborhoods and streets, places where citizens have a better perception of police action (Blattman et. al 2019). A similar situation occurred with the UPP in Rio de Janeiro, where the sense of security experienced by the middle and upper classes increased, given the effect of contiguity between neighbourhoods (Saborio, 2017). Hence, the tendency of hotspots to expand or move when they are intervened requires compensating for gaps in attention when police resources are scarce and need to be reorganized spatially (Sandoval, Velásquez and Riaño, 2023).
Despite the focused efforts in spatial terms, there is an analytical gap in the community policing strategy. This means, the deployment in a network through the set of reinforcing ties that police units (organized by sectors or urban districts) can provide to control crimes. This article aims to contribute to filling this gap through an analysis of the scope of the network of police reinforcements in the rates and distribution of crime in Bogotá (capital of Colombia).
The reinforcements have specific tasks such as conducting control posts (checkpoints, in popular jargon) or closure devices to prevent the escape of a suspect, as well as supporting requests that exceed the available police resource (Colombian National Police, 2014). However, reinforcements tend to follow a reactive pattern in the face of criminal events and do not necessarily respond to a systemic vision of the set of network ties as a tool for territorial order coverage and occupation of police presence.
ANALYSIS STRATEGY, VARIABLES, AND DATA USED
In a first stage, the analysis is developed through a statistical panel model to verify and discuss the effect of the police reinforcement network on the distribution of street crime among the CAI in Bogotá during the years 2016 and 2017, for which relevant information was available. Since street crime tends to concentrate in certain urban sectors, without corresponding to a normal distribution curve, a generalized linear model was chosen, whose flexibility of assumptions allows the analysis of the conditional distribution of the response variable (crimes) in light of a wide variety of possible adjustments. In addition, the predictor can be linearized with the mean using a link function, which facilitates the interpretation of the results (Hardin and Hibe, 2007).
In a second stage, given the partial and contradictory scope of the police reinforcement network regarding crime control, a detailed analysis of the network is carried out to highlight the group reinforcement schemes among patrols that underpin the entire set of ties, and their constraints, some of which may be the crimes themselves given the aforementioned reactive nature of police action. For this part, exponential random graph (ERG) models from social network analysis and sociometry, not necessarily in virtual environments, are used to study systems described by a structure of ties. A graph is the geometric representation of actors or nodes in the form of points and their links by lines.
These models are a useful tool for understanding and analyzing complex social networks. It requires knowledge of the subject to take advantage of sociological insights of the resulting networks in the study problem, appropriate data, choice of model to avoid specification problems, and consideration of the size of the resulting networks to optimize the interpretation of the problem.
The reinforcement ties between CAIs are taken from a previous study conducted by Sandovaland Marin (2017), in which the internal communication system of the Bogotá police was investigated, where a survey is conducted to members of all police stations and CAI in 19 localities of Bogota and questions are asked about communication between members of each quadrant and those closest to them. Subsequently, the databases are constructed in the period 2016-2017 to match the information collected in the fieldwork conducted in each shift of the quadrants by locality. Regarding criminal activity, the selected behaviours are homicides and personal thefts, both considered impactful to the perception of urban security. Homicide stands out among crimes against life and personal integrity, and its record is more reliable due to the difficulty in hiding corpses and the joint work of several justice entities in the collection of bodies and registration of events. Personal theft stands out among crimes against economic asset, and its occurrence is possible in different places in the city, depending on the modality with which it is carried out. The data in this regard come from the statistics of the crime information group (GICRI) of the National Police of Colombia 2010-2018.
The estimates made take as a reference a system of attention that revolves around the quadrants and the response that each police unit must make to respond to the problems of the assigned quadrant. Leaving aside dynamic movements between units and quadrants to respond to crimes that can give rise to a new dynamic model of quadrants that addresses crime by needs in each locality of Bogota.
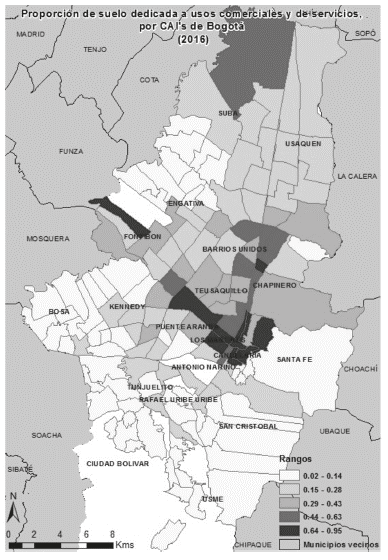
Regarding the control variables, socioeconomic and demographic characteristics were chosen based on their relevance in the literature on factors that may contribute to criminal behaviour, such as unemployment or the quality of employment in Latin America and the Caribbean; population composition and its changes; the role of illegal organizations; or the inadequacy of educational and employment programs for youth, among others (Gambi, 2007; Dix Carneiro, Soares, & Ulyssea, 2018; Freedman, Owens, & Bohn, 2018; España, 2014; Alesina, Piccolo, & Pinotti, 2016; Gómez & Almaraz Calderón, 2017; Bratsberg, Hernœs, Markussen, Raaum, & R0ed, 2018). The control variables finally incorporated in the analysis, and whose source of available information was the District Planning Secretariat of Bogotá, are commercial and service activity, low socioeconomic category housing, young male population, and population density. The first variable measured as the proportion of area destined for commercial and private and institutional uses of the land in 2016.
This variable is relevant due to the flow of the population, both service providing and consuming, exposed to criminal activity in public spaces, as well as the impact that some of these activities may have if they allow the sale of stolen goods or psychoactive substances, or produce noise, pollution, or vehicular congestion.
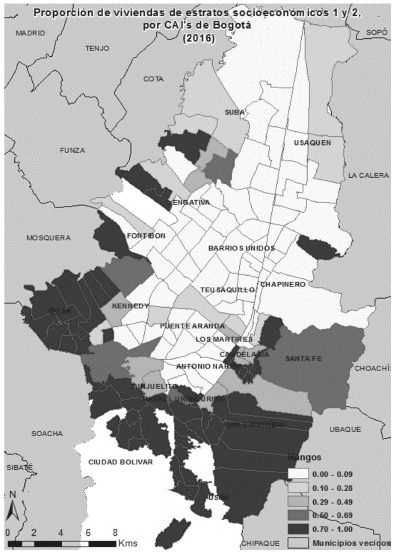
On the other hand, the proportion of housing units in socioeconomic category 1 and 2 (year 2016) is an approximation, within the socioeconomic scale used by the city government, for households that usually face difficulties in education, health, employment, and habitat among others. They would be exposed to offers from criminals for status and monetary gain, which may be even more attractive to their children and young people who may, more acutely, experience feelings of frustration about their future. Similarly, young males tend to be the population group that participates the most in criminal acts, either as perpetrators or victims. Hence the inclusion of the variable that accounts for the proportion of male inhabitants aged between 10 and 19 years old in the year 2017.
Finally, population density per urban hectare (year 2017) is included because neighbourhoodswith a high number of residents are expected to be more difficult for the police to monitorand protect than those with a relatively lower number. The basic unit of aggregation and analysis for all variables is the sectors delimited or under the responsibility of the Immediate Response Centres (CAI in Spanish).
CHARACTERIZATION OF THE CAI ACCORDING TO THEIR ATTRIBUTES
The average number of homicides per CAI is 8 and for personal thefts it is 364, their high standard deviations relative to the same average, allow to notice the existence of subgroups ofpolice CAIs that concentrate these crimes (Chart 1).
Chart 1 Descriptive statistics
| Homicides | Personal Thefts | Commercial and service land use (Area ratio) | Categories 1 y 2 (Housing proportion) | Population aged 10-19 years (Proportion) | Population Density / Ha. Urban | |
| Mean | 8.0 | 364.0 | 0.2 | 0.4 | 0.1 | 206.0 |
| Standard deviation | 7.0 | 354.0 | 0.2 | 0.4 | 0.0 | 121.0 |
| Variance | 52.0 | 125,281.0 | 0.0 | 0.2 | 0.0 | 14,634.0 |
| Minimum | 1.0 | 1.0 | 0.0 | - | - | - |
| Maximum | 31.0 | 2,884.0 | 1.0 | 1.0 | 0.1 | 678.0 |
| Count Confidence | 132.0 | 147.0 | 147.0 | 147.0 | 147.0 | 147.0 |
| Interval (95,0%) | 1.0 | 58.0 | 0.0 | 0.1 | 0.0 | 20.0 |
Source: Authors' calculation.
On the other hand, the mean and standard deviation of the area of the CAI for commercial usei s 20%, and the proportion of low category housing has a mean and standard deviation of40%.
The high dispersion of the data reveals the existence of a significant number of police CAIs with proportions that are much higher or lower than the average for these socioeconomic variables. The geographic proximity between these CAIs (police nodes in network language), that stand out from the average, formed out of larger areas in the city, approaching the limits of the political-administrative management of the Bogota government's Localities (boroughs). These Localities coincide with the jurisdictions of the police stations, within which the sectors (comprised by the CAIs) are located (Annexes, maps 1 and 2.) Additionally, positive correlations were verified between these variables and other dummy variables which account for the distribution of these same characteristics at the Locality (borough) level. Thus, it can be said that at the CAI level, an already verifiable pattern of socio-spatial segregation is reproduced in terms of Localities.
The proportion of the population that is considered young (10 to 19 years old) has a mean of 10%, without a statistically significant range of variation. The average density per urban hectare is 206 inhabitants with (+/-) 20 additional inhabitants, in a 95% confidence interval.
CAI NETWORK AND THEIR EFFECTS ON CRIME IN BOGOTÁ
According to the language of generalized linear models, if the parameter of interest is only one (homicides or thefts), the involved distribution belongs to the uniparametric exponential family."Therefore, the sequence of components to be analysed is:
1) (Y i | X i ) ~ ef (Θ) such that Θ = θ 1
2) Ƞ = Xβ in such a way that Ƞ = f (μ) fulfilling that 2
3) (Ƞ)-1 = μ = E [Y i | X i ] 3(McCullagh y Nelder, 1989).
The selection criteria for the specific model are its goodness of fit and empirical knowledge of the situational context. The former is measured using Akaike (AIC) and Bayesian (BIC) information criteria, which simplifies the selection when the decision boundary is fuzzy (Burnham and Anderson, 2004). Empirical knowledge is used to avoid spurious relationships.The final model obtained is estimated using maximum likelihood and computational iterations, such as Fisher scoring, aimed at locating its convergence (Cuervo and Achcar, 2010).
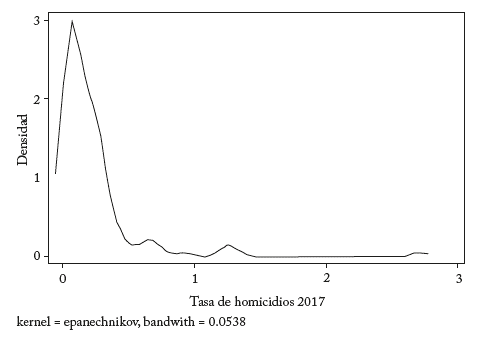
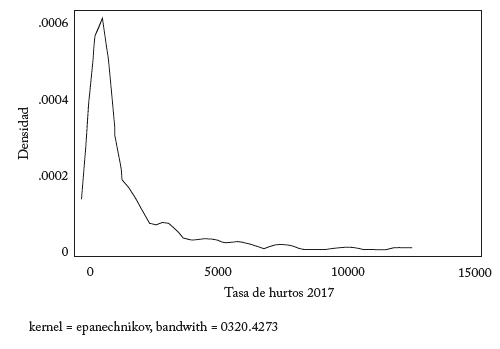
In this model it has been chosen in order to analyse the behaviour of crimes in terms of rates per 10,000 inhabitants, rather than in levels, to avoid biases induced by population size (Table 2). The data in rates also does not show a normal distribution (Graphics 1 and 2), which confirms the suitability of the chosen estimation model.
Chart 2 Descriptive statistics on crime rates
| Homicides | Personal thefts | |
| Observations | 131 | 147 |
| Mean | 2.3 | 165.5 |
| Standard deviation | 2.7 | 317.2 |
| Minimum | 0.0 | 0.0 |
| Maximum | 16.0 | 2335.0 |
Source: Authors' calculation
MODEL 1: HOMICIDE RATE
Finally, a Gamma-type model has been used as it showed the best fit (AIC and BIC) and prediction results. The estimated functional relationship is given by:
Ƞ = X? = HomRate17
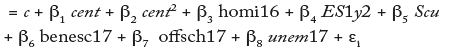
The network of ties is introduced as the centrality indicator (cent) of each CAI in the sub- network of the police station to which they belong, given that the variables are expressed here as attributes of the CAIs. This highlights the degree of interaction between patrols from different CAIs, since the indicator is defined as the effective ties with respect to the potential ties. The same centrality variable squared (cent2) has also been used in the estimation to capture its marginal effects.
Within the group of control variables, the homicide rate from the previous year (homi16) was added to verify the temporal inertia of homicides. Other indicators at the Locality level were used to capture the patterns of socioeconomic segregation, previously mentioned, that persist in the CAI context. This is how the number of sports school's beneficiaries (benesc17), the number of official schools or campuses (offsch17), and the unemployment rate (unem17), in 2017 were introduced. All of them were taken from the statistical repository of the District Planning Secretariat. Greater coverage of recreational and cultural activities would allow young people to find alternatives for free time and socio-psychological development, away from offers of criminal activity. Schools would function as an indicator of educational opportunities and greater opportunities for social advancement through legal activities.
Finally, the unemployment rate would serve as a reference for the scarcity of opportunities to capture economic income legally. Population density is excluded for now since the number of inhabitants has been incorporated into the homicide rates as their calculation base.
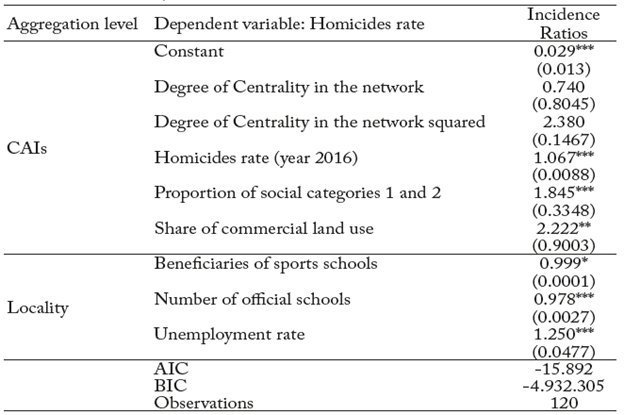
Using the link function of the generalized linear model, we obtain incidence rate ratios (IRR) .Ratios greater than 1 indicate direct relationships, while those between 0 and 1 indicate inverse relationships. Table 3 below is the result of transforming the beta coefficients (ß) according to the link function.
Chart 3 Estimation Results, Homicides rate vs. Covariates
Source: Calculation performed by the authors.
Standard errors in parenthesis p<0.01, **p<.05, *p<0.1
The incidence of the degree of centralization of the CAI, simple and square root, is not significant. In the previous section it was verified that the support ties between CAI were partially aimed at controlling the availability of firearms. Perhaps the flow of these weapons connects more extensive areas of the city, than those covered by CAI or local areas, thus police efforts on the matter are insufficient and this reflects in the in the control of the number of murders in a specific CAI. In the same sense, there is a temporary inertia of the homicides that occurred in the CAI, since the corresponding variable illustrates a positive and significant relationship. On the other hand, the relevance of the local areas is reflected in the significant and direct influence of the unemployment rate, with the highest coefficient; and the inverse relations with the educational and cultural offer.
The variables with the greatest incidence are the rates of low-income housing and commercial use and land services at the CAI level, although they also include patterns that also work at the local area or Station level. The land use variable is the one that stands out compared to its socio-economic type counterpart; What is striking is that, in the previous section of the analysis, commercial activity was more linked to the occurrence of theft to person than to homicides.
MODEL 2: RATE OF PERSONAL THEFTS
When analysing the functional form of thefts, it fits a gamma regression as follows:
Ƞ = X? = TheftRate17
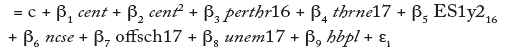
In the context of the CAI, the following variables were used for analysis: degree of centrality of the CAI in the network and its squared centrality in 2017 (cent and cent2, respectively); proportion of homes in category 1 and 2 in 2016 (ES1y216); theft rate in the previous year, 2016 (perthr16); and theft rate in neighbouring CAIs in 2017 (thrne17). In the context of the locality, the number of cultural and sporting events in 2017 (ncse17); number of official schools in 2017 (offsch17); employment rate in 2017 (unem17); and households be-lowthe poverty line in 2013 (hbpl) were used as variables. Unlike the previous model on homicides, some variables were replaced by similar ones that resulted in better model fit. The number of sports school beneficiaries was replaced by the number of cultural and sporting events, and the unemployment rate was replaced by the employment rate. In contrast to the latter, the employment rate would have an inverse relationship with theft. Additionally, the households below the poverty line complement the information provided from category 1 and 2 homes, and, like them, would exhibit an inverse incidence since they form unattractive neighbourhoods for thieves (Chart 4).
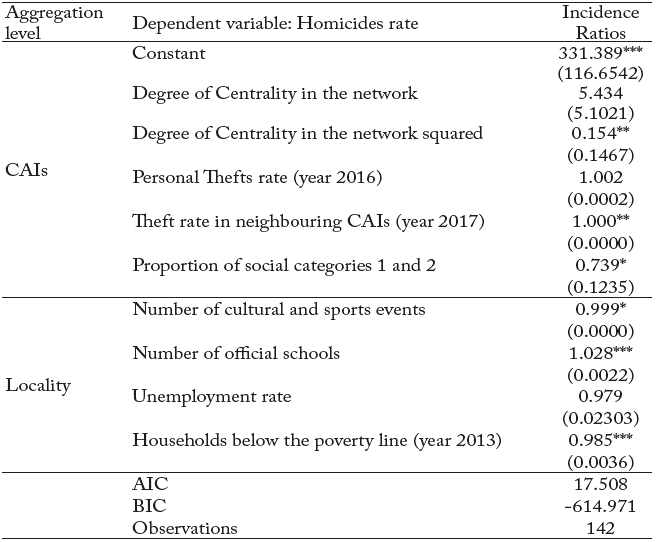
Chart 4 Estimation Results, Personal thefts rate vs. Covariates
Source: Calculation performed by the authors.
Standard errors in parenthesis ***p<0.01, **p<.05, *p<0.1
In this model, the police reinforcement network reveals a significant coefficient only in its marginal effect, which is inverse. Although not significant, the simple indicator of the network presents a direct relationship, its ratio being the highest magnitude and the one that stands out from the estimation. That is to say, when observing the joint influence of the two indicators, the expected effect of the network would only be achieved from a critical number of reinforcements. At the beginning, the concentration of reinforcements towards the CAI ofa Station would not have an impact on thefts and may perhaps even stimulate them.
Thefts from individuals are more widespread, fortuitous, and easily committed with any object that can function as a weapon. This is reflected in the tendency towards a direct and significant relationship with thefts in neighbouring CAIs, without significant temporal inertia according to the ratio of thefts that occurred in 2016. Therefore, it is possible that an increase in police controls, towards a specific CAI, may produce unusual increases in multiple sectors of the same police node as a reaction. That is until the police identify more precise action profiles of the thieves and thus the neutralization capacity of the officials meets expectations. In other words, until the initial advantage of the offenders is reversed.
A similar analytical logic could even be applied to homicides themselves. In the previous model, and despite its lack of significance, the centrality of the CAI in the Station's network revealed an inverse relationship with murders and a direct relationship when squared. That isa situation opposite to that described in the model on thefts, where initial reinforcements would help limit homicides up to a level, beyond which they would no longer work as expected. Here, then, learning is on the part of the offenders, and it is the police who would lose the initial advantage.
This would be associated with the fact that homicides are often committed with firearms, a scarce and elaborate means compared to bladed weapons. Consequently, police controls over firearms could yield effective advantages only at the beginning.
On the other hand, the influence of local hierarchical variables is significant, except for the employment rate. Meaning that the educational offer of official schools is directly related. It would indicate that these places, and their student population, function as a target for thieves. For their part, poor households and low category housing record the expected inverse relationships significantly.
The limited and speculative impact of the police reinforcement network on homicide andrates of theft raises the question of why it has relatively little importance compared to other socioeconomic variables.
REINFORCEMENT NETWORK BETWEEN CAIS: CHARACTERISTICS
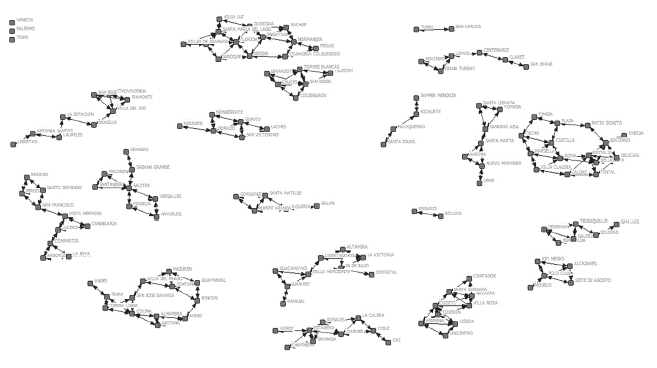
The main characteristic of the reinforcement network in Bogotá is its fragmentation (Figure 1), especially because the CAIs operate grouped by Stations whose geographical boundaries coincide with the so-called "Localities" into which the city is divided from a political-administrative management perspective.
Source: Authors' calculation.
Figure 1 Network of reinforcements between police CAIs in Bogotá, organised by Stations or Localities.
Each grouping or subgraph of CAIs in the network reveals a substructure of interaction within a Station, without connections between CAIs belonging to different stations. As a global result for the city, the proportion of pairs of CAIs that do NOT connect with eachother, directly or indirectly, is 94.6%, which means that just over 5% of pairs establish effective connection (Chart 5, indicators 1 and 2).
Chart 5 Characteristic network indicators
| 1 | Fragmentation | 0.946 |
| 2 | Connectivity | 0.054 |
| 3 | Components | 23.000 |
| 4 | Component Ratio | 0.151 |
| 5 | Average Degree | 2.721 |
| 6 | Density | 0.019 |
| 7 | Degree of centralization | 0.023 |
Source: Authors' calculation
Another reflection of the fragmentation is the number of components in the set of thenetwork, which amounts to 23 (Table 5, indicator 3) and includes those of the 18 police stations described in the network. Each component is composed of pairs of nodes linked by some path of police reinforcements or ties. Of the 5 components additional to the stations, itis revealed that, in general, the interactions within each station are sparse, that is, with a reduced effective number of ties compared to the total possible ties or pairs of direct connection. In fact, each component uses an average proportion of 15% of possible pairs to connect in the global network of the city (Chart 5, indicator 4).
The global fragmentation of the network into stations and the low relative interaction within each station is reflected in the low levels of other indicators (Chart 5, indicators 5, 6, and 7), also global. Each CAI or node, in network language, interacts with an average of 3 other nodes; the density of ties in the complete network in Bogotá is only 1.9%; and the degree of centrality or connections that any CAI establishes as a proportion of its total possible, in the hypothetical case of interaction with any other in the city, is 2.3%. Given the degree of disconnection observed in the global network, a more detailed look is necessary from the neighbourhoods (also called ego networks) that each police node has formed, through its interactions, and the average behaviour of the measured characteristics in each of these same neighbourhoods.
The average size of ego networks, or the number of police nodes with which each CAI sharesreinforcements, is also 3, with a range between 2 and 4. While the average density of ties in ego networks is just over half (54.9%), which is low considering that it is an indicator of neighbourhoods, i.e., the set of relationships between, and with, the nodes with which each CAI establishes connections of mutual support (Chart 6, indicators 1 and 2). Similarly, the ties between the neighbours, or alters, of each CAI in the network are, on average, fewer in number. The average number of components formed by the alters is between 1 and 2, and each component groups around half (54.3%) of the total possible pairs of alters (Chart 6, indicators 3 and 4). As an additional measure, the average percentage of connection for each police node with the neighbours of its neighbours in the network stands out, reaching up to 62.5%, which again is reduced when considering the already mentioned sizes of the ego networks (Chart 6, indicator 5).
REINFORCEMENT NETWORK: MODEL, GROUP SCHEMES BETWEEN CAIS AND THEIRCONSTRAINTS.
In this part of the analysis, ERG models are used, in which the probability of the occurrence of the network is an exponential function of group interaction schemes, statistically weighted, and can be reproduced and multiplied as a pattern to form an entire structure of ties. In these models, ties are assumed to be interdependent. Their mechanics are given by a Markov-type process in which a given number of actors or nodes to be connected is started and a set of random graphs is generated, each with the same probability of occurrence, called the sample space. The idea is for the graph of the observed network with the available data to be central in this simulated space; that is, it approximates the mean value of the quantity of each group relationship scheme under analysis.
Thus, from the sample space of graphs, statistics are calculated on the frequency with which each group scheme occurs. On this distribution of frequencies, the null hypothesis of equality between the quantity of a particular scheme in the observed network and the mean value of the quantity of this same scheme in the random sample space of graphs is evaluated. If the observed quantity is well above or well below (with a 95% probability, for example) the mean value of the random distribution, it can be stated that the scheme is statistically relevantor not for the formation of the observed network. The mathematical expression of ERG models is:

Where: X is the sample space of random graphs; x the observed network; θ1, θ2 ... θ p , the weighting coefficients; z 1 (x), z 2 (x), ... z p (x), the statistics of each relationship scheme evaluated; P θ (x) the probability mass function; k (θ) = Σy∈x) exp{θ1 z 1 (y) + θ2 z 2 (y) + ... + θ p z p (y)} is a normalisation term to ensure that the sum of the probability mass function P θ (x) over the entire set of random graphs is 1.
The results of the ERG model are divided into two main blocks of effects: structural and contextual. In the first block, the group interaction patterns that support the network are identified, while in the second block, the patterns associated with individual characteristics of the nodes or CAIs are identified, including the levels of crime (homicides or personal theft), which can also influence the probability of the existence of network ties. Regarding themodel based on homicides, the structural results reveal the following significant patterns, with their own names in network language and explained below: adjacency, two-star, triangle, alternating triangles, and alternating path of two ties (Chart 7).
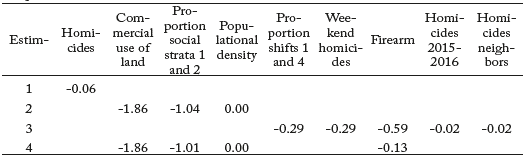
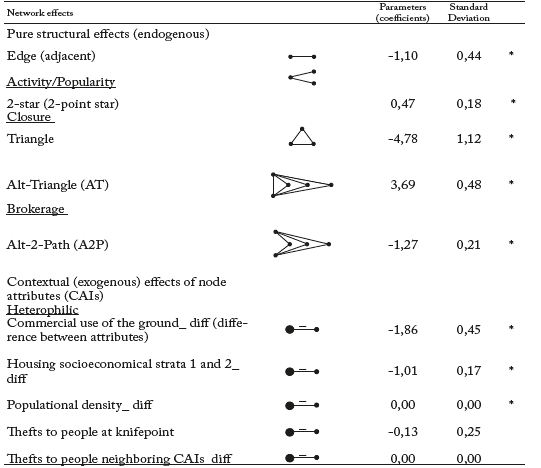
Chart 7 Structural and contextual model of the network as a function of homicides
Source: Calculation performed by the authors
The adjacency scheme serves as a mathematical intercept and, from a conceptual point of view, accounts for the degree of difficulty in the appearance of a tie between CAIs, which is also expressed in the negative sign of the accompanying coefficient. For its part, the two- point star integrates the type of mechanisms that characterize the activity or popularity of the nodes in the network; that is, nodes that extend several ties to others will be active and, conversely, those that channel ties from others will be popular. When the ties are bidi-rectionalor reciprocal, as is the case with the CAI network, the roles of active and popular are equivalent.
The mentioned star points to mutual support relationships of one CAI with two other CAIs, or two points, which are relatively frequent given the positive sign of its coefficient. Its observed frequency is significantly higher than the expected average randomly, and therefore constitutes a trend within the network.
On the other hand, three-way interactions in the form of triangles constitute the most basic representation of the clustering mechanism, in that they indicate the effective realization of all potential ties in larger gatherings of two nodes; in this sense, they also reveal a reproduction of ties or relationships of the same class. Triangles can be deepened or thickened based on a common base or tie, as they involve more and more third parties. This is the scheme present in the alternating triangles, which functions as one of the fundamental trends in the network of police nodes. This means that within each police station in Bogotá, there is generally a pair of CAIs that concentrate mutual support with the remaining CAIs of the same team integrated in the station. This clustering scheme is the most important in the network, as expressed in its positive associated coefficient of 3.69, which is also higher than the 0.47 of the two-point star.
In addition to the adjacency scheme, simple triangles, and the alternating path of two ties have negative coefficients since their observed frequency is significantly lower than what would be expected randomly. Therefore, they do not constitute a trend and occur in the network only a few times, in one or another police station, and their function is to serve as a model adjustment factor so that it is a suitable representation of the city's overall network. Simple triangles would be rare to find as an isolated clustering scheme, and the alternating path of two ties would apply in cases, in some stations, where the pair of CAIs that concentrate the police reinforcement ties do not cooperate with each other.
Regarding the second block of effects in the model, contextual effects are significant, and heterophily has a negative coefficient, indicating that it is rare in the network. Therefore, homophily is statistically frequent and a trend in the network. The term "homo" refers to reinforcement ties between CAIs with similar levels in the respective characteristic or variable; in this case, commercial and service activity, socioeconomic category, and population density variables. However, the effect of population density is practically null, with a coefficient of 0.00. Two alternative explanations are possible here. On the one hand, the police may have a preventive orientation by acting on factors related to crime before they occur, considering the socio-economic characteristics of their CAIs to activate reinforcements between similar nodes. On the other hand, as it has been verified before that the socio- economic variables at the CAI level reproduce the most extensive segregation patterns of Localities or police stations, CAIs within the same station share a similar socio-economic profile. Thus, it would be logical to find that reinforcements between them occur based on homophily.
In a previous sequence of estimations (Annexes, Chart A1), it was evidenced that the preventive character of the police network was found in the homophilic relationships between CAIs with similar proportions of homicides committed with firearms (coefficient of 0.59); meaning that support is provided to reinforce surveillance in neighbourhoods containedwithin CAIs where the circulation and use of firearms may be frequent, and the similarity in the crime profile of CAIs in a Station is taken into account to share police resources. In another estimation, the incidence of total homicides in terms of homophily was also verified, albeit relatively minor (coefficient of -0.06). However, when socioeconomic and demographic variables are incorporated (Chart A1, final estimation), the significance of the effect of homicides with firearms is lost, and the coefficients (1.86 and 1.01) of theseincorporated variables even stand out above the aforementioned coefficient of total homicides. Therefore, the statistical fact of the reproduction of the city's segregation patterns is imposed, which leads to the CAIs of the same Station revealing similar living conditions of their inhabitants.
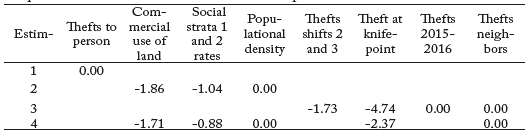
On the other hand, in the ERG model based on personal thefts (Chart 8), the preponderant importance of socioeconomic variables around homophily within the contextual effects blockis also evident. Once again, these variables absorb the significance that a specific type of crime, such as thefts committed with a knife, may have had at a given time in the allocationof police reinforcements (Annexes, Chart A2). Additionally, in this sequence of estimates thatpreceded the final model, the total levels of personal thefts did not show significance as a criterion for organizing the police network (Annexes, Chart A2). Thus, the reproduction of socioeconomic segregation patterns among the CAIs of the Localities (or stations) is confirmed, so that police support configures homophiles between the nodes of the same station.
Chart 8 Structural and contextual model of the network as a function of personal thefts
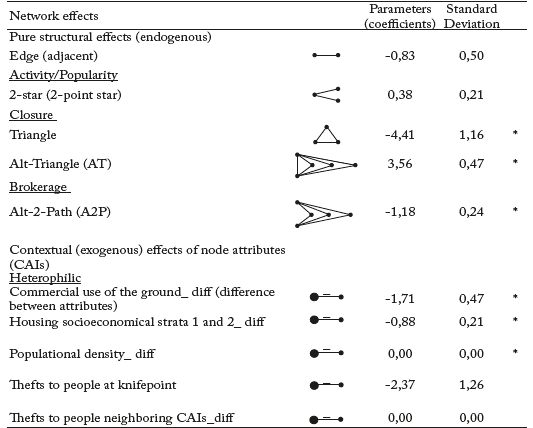
Source: Calculation performed by the authors.
Regarding the structural block of the model, the importance of the alternate triangles persists, as was the case in the results based on homicides. Consequently, the network centrality of certain CAIs in their respective station, based on this triangular scheme, confirms the logic of assistance around nodes considered problematic in already demanding areas. In particular, where commercial and service activities tend to be predominant, if one thinks about controlling personal theft, and where low category housing is prominent when the focus is on controlling homicides, given the relative importance of these variables in one or the other model.
CONCLUSIONS
The community policing approach involves the design and implementation of units that are closer to the population, with reduced spatial and scale coverage. This requires efforts towards operational decentralization, with local responsibilities accompanied by an organizational and territorial overview. Otherwise, there is a risk of fragmentation of the police force and the isolation of its units focused on addressing criminal problems. Hence, theimportance of considering network designs for police units or nodes that ensure their flexible articulation to the variable spatial and temporal scales with which these problems persist.
The ties formed by reinforcements between CAIs represent an attempt to maintain operational coordination of crime control. However, the principle joint action scheme described by alternating triangles (with a focus on hotspots in Bogotá, within each neighbourhood or police station) presents contradictory results regarding the decrease in homicides and thefts from persons. The influence of the network is relatively low, statisticallysignificant only with respect to thefts, and from a certain number of ties. An explanation is that the unique pattern of densifying police presence via reinforcements on hotspots leads to an over-focus of patrols' actions, losing sight of the broader context in which criminalbehaviour develops, and the possibilities of multiplication or displacement of hotspots. This becomes even more problematic if one considers that this context tends to exceed the limitsof CAIs and even Localities.
Beyond the attributes of the sectors delimited by the CAIs, the idea of a critical threshold (from which the ties would have the expected effect of controlling crime) is a marker of the importance of comprehending ties as the unit of observation and analysis in the field deployment of the reinforcement network as an articulated system. To put it in network language, it is about guaranteeing not only dyadic efficiency (or efficiency by pairs) but also structural efficiency. The latter is based on the interdependence between ties, which, in this case, reflects the systemic effects or sacrifices of police coverage every time it is reinforcedin another sector of the network stationed in the field. This is a reason to propose a model of attention by mobile quadrants, more appropriate to the dynamic behavior of crime in Bogota and in other cities where the MNVCC is implemented, in order to respond more quickly to the needs of the population affected by crime.
And yet, the situational attributes of crime (e.g., type of weapon used, day, and time of occurrence) that police attention and reinforcement are directed towards, are surpassed by therealities of socioeconomic order present in their surveillance sectors. The typical homophilic ties between police nodes in each Station and the weight of socioeconomic variables throughout statistical estimates, measured at levels of spatial resolution of CAI or Localities, reflect that hotspottype neighbourhoods are inserted and sustained in geographic areas of more extensive criminal activity that encompass the entire Station or beyond its borders. It is clear then that the situational nature of reinforcements, focused on controlling criminal events rather than the roots of transgressive behaviour, is insufficient for socioeconomic factors to operate only as constraints and not as determinants.
To avoid the erosion of community policing, which is restricted to the spatial disposition of patrol tasks and control operations, requires a territorial vision through the extension of tiesor networks of police work towards the exchange of experiences and activities with other public entities, whose mission is to address social problems related to crime and proximate to the daily life of local populations. In this sense, station commanders play a key role along with local authorities. Additionally, CAI commanders must complement these types of articulations with guidance to the patrols under their command in order to become facilitatorsin addressing collective demands relevant to criminogenic contexts, which ensures greater well-being of the population.
The CAIs can represent a level of resolution in the analysis that is still very dependent on the trends of the Localities and prevents capturing more micro scenarios of urban neighbourhoods. The development of this paper lacks some information that has prevented more diverse and complete characterizations of the neighbourhoods within the CAIs. However, the absence of studies on the possible networks of ties between spatial policing units, such as CAIs or quadrants, is surprising given their importance in a surveillance program that aspires to be truly community based. This paper represents an initial exploration in that direction.