


 Inglês (pdf)
 Artigo em XML
 Referências do artigo
 Enviar este artigo por email
 Citado por SciELO
  Citado por Google
  Similares em
SciELO
Similares em
SciELO  Similares em Google
 Permalink
Introduction
On tropical regions, the temperature is perhaps the most important climatic factor, but others factor can influence grazing distribution. Daily, the large herbivore must decide where to graze, rest and drink 1. They use grazing patterns in function of different king of resources biotic and abiotic; those resources include distance and allocation of water, slope and weather. Others factors include quality and quantity of fodder and tree cover as shade 2.
Global Positioning System (GPS) have been usually used to study animal behavior on range systems, mainly to quantify positions and movements of cattle and others ungulate species, and derive measurements about their grazing and resting activities 3,4,5.
Different studies have obtained data using a varied number of animals equipped with GPS acopled to collars, depending on the research objectives. Thus, studies in the USA used six collars and other study in Israel used two collars 6; Also, Mora-Delgado 7 has used six collars to study the preference of the animals for grazing sites at paddock scale. Ganskopp use 4 collars for each group of animals 8 and Schwager 9 used 3 collared cows to categorize animal tracking data into various classes of behavior. As well, other studies have used a greater number of collars, which implies higher costs.
When a small number of devices are used, the increase in sampling is necessary. In this regard, in the study of Ungar et al. 6 two GPS collars were deployed, one in each paddock; they were moved from one cow to another twice a week to increase the cow sample size.
In addition, with the implementation of differential correction in data from GPS collars, accuracy will increase by about an order of magnitude, with an expected 95% confidence interval of about 12 m, 10 some studies found a radius of 5.5 m from the mean locale, encompasses 90% of the coordinates 11.
The study of Liu et al. 12 suggest that a small subset group may be adequate for identifying areas visited by cattle and larger subset group size (e.g. subset group containing more than 75% of animals) is recommended to achieve better accuracy of group movement characteristics and spatial occupancy for the use of correlating cattle locations with other environmental factors.
In Colombia, there is a little information about the interaction between tree cover and cattle behavior, using remote sensor. Thus, this study aimed at evaluating the movement of cattle grazing under different biotic (tree cover and fodder supply) and abiotic factors (ambient temperature) for searching for food and comfort areas, under warm and hot periods, in a silvopastoral system, using GPS in an SIG ambient.
Materials and methods
Analyses were conducted in Pajonales farm, located in the municipality of Ambalema (lat. 4° 45' 25.9" N; 74° 52' 20.8" W) in Colombia, from December 2009 and January 2010. It has an average elevation of 300 masl. Mean precipitation is 1270 mm.year-1. The data of precipitation and air temperature in the study area were monitoring during December (2009) and January (2010) by the weather station Pajonales Company SA.
A paddock of 54 ha was used for this study, consisting of five ranges of tree cover (TC): Poor (≤20), Low (≥20% ≤40%), Intermediate (≥ 40% ≤60%), High (≥60% ≤80%) and Very High (≥80%). Each one, corresponding to 47%; 21%; 16%; 12% and 4% of the total area, respectively. Topography was flat to gently sloping. There were two drinking water locations on the south-east end of this pasture. TC was determined from digital orthophotos Quick Bird using a software ArcGIS® 9.1 of the Universidad Nacional de Colombia. Estimation of the TC was made with Hwths Tools for ArcGIS® 9.1 by polygons and after that, these were represented by points (5x5 m). Thus, the paddock was segmented into a 0.25 ha grid cell lattice, and sapling canopies within grid cells were mapped.
To estimate the biomass production of herbaceous stratum, sampling sites were selected in function of tree cover. For this, the grid superimposed on the satellite image of tree cover was used in a GIS environment, using ArcGIS 9.2. Thus, 19 cells were selected, each of which is 2500 m2 (Figure 1). In the field, the plots were demarcated and proceeded to estimate biomass, using wooden frames (50 x 50 cm), adapting the methodology of Haydock and Shaw 13 and t'Mannetje and Haydock 14. The measurement of biomass was done at different times (twice per dry and twice per rainy period) from 25 November 2009 to December 25, 2010. Forage biomass was expressed in DM.ha-1.
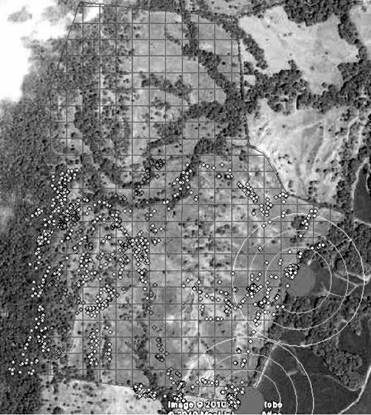
Source: Authors based on satellite image of GoogleEarth, 2010. Note: Color points indicate positions of cows; the concentric circles were used to determine proximity to the water source at 50, 100, 150 and 200 m.
Figure 1 Grid superimposed on the satellite image Quick Bird of tree cover in a GIS environment, using ArcGIS 9.2.
Six cows (3 Brahman and 3 F1, Brahman x Holstein; 450 kg LW) equipped with GPS-collars (Garmin eTrex-Vista) configured to record and store cattle positions (CP), were tracked during 60 days at 5-min intervals. Experimental animals were assigned randomly to each treatment, but the collared cows were assigned randomly to each treatment and they grazed together with a herd of young cows. Visual scans of foraging activities and recording of locations and foraging activity were conducted at 5 minute intervals by 4 trained observers, during 4 daylight periods of 12 hours. Scanned activities were grazing, traveling and resting. Daily travel distance was calculated for each animal in the herd by summing euclidean displacement between positions with a recorded distance and differentially corrected GPS data using ArcGIS 9.3. Distance between positions was compared to visual scans of foraging activities using statistical program Infostat 15.
The average runs per cow per day were analysed with descriptive statistics. To compare the means of the routes by breed and period, t-Student's test for independent samples was used. To assess the frequency of visits of cows to sources of water, cattle position recorded in a concentric circle (within 50 m) around each trough was quantified. These measurements were made in the two days of highest temperature (31.4aC) and the two lower temperatures (27°C) of the monitoring period.
Based on total CP recorded and processed on a work sheet in excel, a classification of movement of cows was done. For that, using the third quartile as up class limit of the distance (m) registered by GPS in each activity (Resting, Grazing and Traveling) of cows, were defined classes of observed activities. Thus, three classes (<4 m, resting; 4-12 m, grazing, and > 12 m, traveling) were obtained. Those class limits were used to classify distances registered with GPS along complete day. After that, a comparison between observed activities with predicted activities was done; these data were statistically analyzed with Chi-square test.
With the t-Student test for independent samples, the daily routes (km) were evaluated by breed composition (F1 and Br) and by seasons (warm and hot) for the two days with higher temperatures and the two days with lower temperatures, respectively.
The statistical evaluation for the data of Activity (T + G) and No Activity (R) and the behavior of the cows in relation to the visits to the area of hydration of the paddock, by racial composition and by time, was analyzed with the test of nonparametric comparison of Mann Whitney U because the analyzed data do not have a normal distribution.
The Pearson correlation coefficient was calculated with the objective to investigate if there is an association between the number of visits (PC) and the tree coverage (TC) and a regression was made to determine the functional relationship between a response variable (CP) and a regression (TC). The data was represented by dispersion diagrams. The statistical analysis was performed with the SPSS v.20 program and regression model was done with Infostat software 15.
Results
Precipitation accounted 60 mm on December, while, on January it was only 4.4 mm. On the other hand, average temperature during experimentation period was 29°C, thus the analysis of mean daily temperature and precipitation allowed to define a posteriori two distinct periods: on December (2009) 25% of total days were below to the temperature average, while, on January (2010) the 48.4% of total days presented temperatures above to average. So, we had two different periods: warm days and hot days, respectively (Figure 2).
Source: Authors based on the weather station from Pajonales Company SA.
Figure 2 Temperature variation in the study area during the months December (2009) and January (2010), Ambalema (Colombia).
The average values indicates that cows generally traveled longer distances in warm period (7.4 km) vs. 6.1 km in the hot period. Data show that the animals traveled further under warm period, particularly the Brahman cows; there are also statistical differences between
F1 and Br cows in the lower temperatures (p ≤ 0,05). Average distances traveled by the animals (both F1 and Br) at higher and lower temperature, in the hot period were not statistically different (Figure 3).
Figure 3 Distance traveled (km. Day-1) by cows (F1: Holstein x Brahman, Br: Brahman) in warm period and hot period under maximum (Max) and minimum temperatures (Mín.) in Tolima, Colombia. (Authors of this research)
Result show that a total amount of 2441 observations classified as activity (T and G) and No Activity (R) were performed. An analysis between observed positions and predicted data shows that 72% were coincident in the observations of No activity (resting). The data, statistically analyzed with Chi-square test, shown a dependence between observed and predicted data (p = 0.001). In average, cows devoted 6 h (25%) traveling; 8h (33%) grazing and 10h (42%) resting. Generally, on both warm and hot period, cows prefer to devote more proportion of time in resting.
Table 1 show statistical differences between warm and hot periods in the different activities of cow's performance. Non statistical differences were detected between breeds and interaction breed * period weather (p>0,05).
Tabla 1 Animal activity under warm and hot period of F1 (Holstein x Brahman) and Brahman cows in Tolima, Colombia.
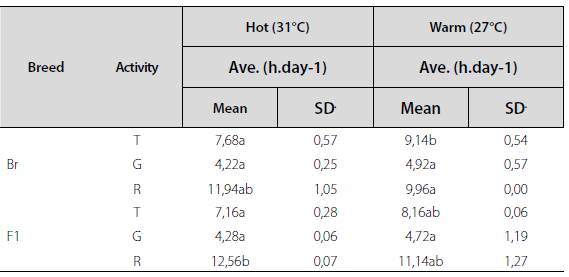
Note: Different letters in the same row mean significant differences between weather periods (P<0.05). Ave. average; T Traveling; G Grazing and R Resting. Source: Authors of this research.
Mainly, Br cows showed statistical differences in the time spent traveling, with a significant advantage in the warm period versus the hot period. On the contrary, the time dedicated to rest is greater under the hot days compared to warm days. There were no statistical differences between the two periods for the grazing activity. The F1 cows no presented statistical differences in the daily activities between the weather periods.
On the other hand, the results of TC analyze, shown that the silvopastoral system had a gradient of tree cover from <20% to >80%, in a design of scattered trees on a monospecific pasture of Bothriochloa pertusa. Thus, 47% (25.4 ha) of pasture had a poor tree cover (<20%), which means that almost half of the paddock has a tree cover oscillating between low and very high coverage.
Analyzing the 45,755 CP, which ones represent CP every five minutes, the data indicate that the cows were kept longer on areas with poor TC, but, retention of animals at Low TC is not negligible. However, the CP/area ratio showed a higher presence of cows in the Low TC, taking into account that this area (TC: 2040%) represents only 21% of the field; it is suggest that this area was the most visited, as it presented 1035.19 CP.ha-1, compared to 923.68 CP.ha-1 on poor tree cover. Actually, it is related with the availability to produce edible bio-mass, as was evidenced that, these areas had more quantity of fodder dry matter (Figure 4) with statistical differences (p = 0.0001) under different TC.
Source: Authors of this research.
Figure 4 Edible biomass (t. ha-1) and animal positions under different tree cover in a pasture from Tolima, Colombia.
Statistically it is confirmed that there is an inverse relationship of dependence between the positions of the cows and the tree canopy cover (R -0,73). The coefficient of determination of (R2 0,53) indicates that the tree cover can explain in 53% the positions of the cattle on the greed, by mean an exponential model: 28095,82 *exp(-0,09 *TC)+ 5161,44 *exp (-0.01*TC) (Figure 5).
Figure 5 Relationship between animal positions and tree cover represented in an exponential model. Source: Authors of this research.
On the other hand, the results indicate that there were statistical differences (p<0.05) in the number of visits to water trough area, between high temperatures and low temperatures days. There were no differences between breeds (p > 0,005) (Table 2).
Table 2 Permanence of cows on surroundings water trough (50 m diameter), in days of higher and lower temperatures.
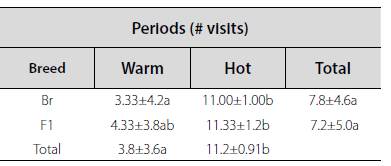
Source: Authors of this research.
Note: Means with the same letter in the row are not significantly different (p> 0.05).
Discussion
This study, based on the comparison between the data of direct observation and data obtained from GPS, demonstrated effectiveness of remote sensors for tracking of cows on the field and to determine the grazing distribution, similar to report of Putfarken et al. 16. Also, the relationships between TC and CP shows an association, similar to data reported by Mora-Delgado 17, whom suggest that the animals prefer areas of pasture with low and intermediate canopy cover. They found a significant negative exponential relationship between TC and relative use of grid cells by cattle (y=450,41 e -12.329 x); thus, tree cover explained 50,1% of the variation in relative use by cattle of the 1 ha woodland grid cells.
On the other hand, similarly to others studies, in this research work our results suggest that the breeds most adapted to less favorable environmental conditions, present a behavior that indicates a better capacity to search for food and welfare. Peineti et al. 18 affirm that mestizo cattle with indicus or Creole breed blood make better use of extensive desert fields, if compared with the more common British breeds. Also, has been documented testimonies of New Mexican ranchers that animal adapted to aggressive conditions seem better performance to the hot temperatures 19. Some reports of scientific literature support this statement: British cattle grazed longer per day than creole cattle (10.6 versus 9.82 hours/day, respectively; P < .0001); British cattle also traveled less each day (6.87 versus 8.08 km/day, respectively; P < .0001) 20.
Data of this work are consistent with other studies in subtropical and tropical areas. In New Mexico (USA), Lipka et al. 21 reported bulls Angus traveling 10.0 km.day-1 ± 0.7 SE, while cows (Angus and Angus x Hereford) traveled 7.0 km.day-1 ± 0.2 SE. Distance traveled by bulls per day varied among days of the breeding season, but there was no consistent pattern during the season distances traveled under subtropical conditions; another report showed that daily travel distance was about 5, 17 km day-1 in Oregon, USA 22.
Respect to activity of cattle used in this research, the data are not very far from of daily activity reported in studies with Charolais cattle of 6.1 h.day-1 in grazing and 9.2 h.day-1 resting 23, unlike those reported by Mora-Delgado et al. 7 with Holstein cows in the temperate area of United States, where the cows were grazing (51%), resting (43%) and traveling(6%). Probably, the variability in the activity is governed by both biotic and abiotic conditions. Thus, other authors report that both breed and season affect the behavior of cattle foraging in semi-natural grasslands. Weather is the most important factor, although genetic composition also showed differences, thus, traditional breeds had a higher level of total activity and traveling than the commercial heifers 24. The bos taurus grazing activity decreases in hot environments, being more marked in animals with black layer 25.
Although in this study there were no statistical differences in daily activity, between breed lines, the data suggest a slight tendency in Br animals to have more activity under less favorable environmental conditions, similar to desert, expressed in a longer time spent in both foraging and pick up food (T + G).
But the cattle try to keep a trade-offs between decisions related to feed consumption or select shaded areas for to get comfort. This trend is confirmed by the findings of Polania 26, who reports that animals prefer more coverage areas at night, where there is less dry matter available. This may be explained in a strategy to protect themselves from the cold, as suggested by the study of Black-Rubio et al. 3 in subtropical areas Chihuahua desert, where cows were kept in wooded areas when temperatures fell below 4 ° C for four consecutive days. To this, Peineti et al. 18 report that better adapted animals (Creole) avoided sites with high woody density while non-adapted animals (Angus) did not avoid these sites.
Likely, cattle, in a trade-offs situation, randomly selects both habitats, searching greater availability of biomass and shade for to get comfort.
Brizuela et al 27 and Stafford-Smith 28 agree that grazing decisions occur within a hierarchy of physiological needs of an animal, according to this author, demands for thermoregulation, for example, take precedence over nutritional needs. Under intense heat, exceeding 32 °C, cattle may take up to 8 h in the vicinity of water sources, ruminating, resting and drinking 29. This behavior was documented by Polania et al. 26, who reported that cows remained during the hours of more intense heat in surrounding areas to drinking. In fact, it has been reported that cattle can spend only 4 minutes a day consuming water but may spend 10 times more time lounging around the water source 28. Comparing between breeds, British cattle remained closer to water and had significantly smaller home ranges than creole cattle 20.
Peineti et al. 18 suggest that water is an important factor determining foraging distribution, as either to adapted and non-adapted breeds to landscape, mainly, distance to water was the most important foraging predictor of animal grazing distribution. In arid and semi-arid areas, sources of water and shade are often limited, which also affects selection of feeding sites. After watering and resting, animals must decide where to begin the next grazing bout 29.
Implications
The study of bovine performance in terms of biotic and abiotic factors is an important contribution to understanding the dynamics of animals in search for food under grazing conditions and plan production systems compatible with animal welfare. Cattle regulate its daily activity as a function of the weather conditions, especially ambient temperature. It is noteworthy that Bos indicus animals have greater ability to travel more distances in hot seasons, unlike F1 who prefer to stay more time resting. Results suggest that the animals prefer areas of pasture with low and intermediate ca nopy cover, however, additional studies are required to clarify the relationships of grazing cattle and weather conditions and tree cover, and how determinant these are in the animal performance in different breed's cattle.

