Services on Demand
Journal
Article
Indicators
-
 Cited by SciELO
 -
 Access statistics
Related links
-
 Cited by Google
 -
 Similars in
SciELO
 -
 Similars in Google
Share
Ciencia e Ingeniería Neogranadina
Print version ISSN 0124-8170
Cienc. Ing. Neogranad. vol.25 no.1 Bogotá Jan./June 2015
ASPHALT MIXTURE DIGITAL RECONSTRUCTION BASED ON CT IMAGES
RECONSTRUCCIÓN DIGITAL DE MEZCLAS ASFÁLTICAS BASADA EN IMÁGENES DE TOMOGRAFÍA COMPUTARIZADA
Wilmar D. Fernández1, Jeison D. Pacateque2, Miguel S. Puerto3, Manuel I. Balaguera4, Fredy Reyes5
1 Civil Engineer, Ph. D., Associate Professor, Facultad de Medio Ambiente y Recursos Naturales, Universidad Distrital Francisco José de Caldas, Bogotá, Colombia, wfernandez@udistrital.edu.co.
2 Systems Engineer, Student, Facultad de Ingeniería, Universidad Distrital Francisco José de Caldas, Bogotá, Colombia, sjdps001@gmail.com.
3 Systems Engineer, Student, Facultad de Ingeniería, Universidad Distrital Francisco José de Caldas, Bogotá, Colombia, santiago.puerto@gmail.com.
4 Physicist, Ph. D., Associate Professor, Facultad de Ingeniería, Universidad Konrad Lorenz, Bogotá, Colombia, manueli.balagueraj@konradlorenz.edu.co.
5 Civil Engineer, Ph. D., Titular Professor, Departamento de Ingeniería Civil, Pontificia Universidad Javeriana, Bogotá, Colombia, fredy.reyes@javeriana.edu.co.
Fecha de recepción: 15 de Septiembre de 2014 Fecha de aprobación: 16 de Diciembre de 2014
Referencia: W.D. Fernández, J.D. Pacateque, M.S. Puerto, M.I. Balaguera, F. Reyes. (2015). Asphalt mixture digital reconstruction based on CT images. Ciencia e Ingeniería Neogranadina, 25 (1), pp. 17 - 25
ABSTRACT
More than 80% of pavements in Colombia and worldwide are made of asphalt mixtures. Those mixtures have usually been studied as a single material, but they are actually a three phase material, since they are composed of rocks, mastics and air voids. In addition, the behavior of the asphalt mixtures depends on the characteristics of each phase. The aim of this project is to make an asphalt mixture real sample reconstruction from X-Ray Computerized Axial Tomography (CAT). The reconstruction process has three stages: Scanning, Segmentation, and Data Scaling. All these stages were developed in Python under Object Oriented Programming (OOP) and were implemented through the use of several tools, such as Numpy, Scipy, Pydicom, Scikit-learn, Matplotlib and Mayavi. As a result, a tridimensional digital model called ToyModel was developed. This model is a 3D digital solid represented by a set of 1 mm3 voxels. The reconstructed ToyModel accurately represented the real sample, since the ToyModel air void volume was 3.98% and the real sample air void content volume was 4%. This Python implementation is a good tool to model any asphalt mixtures, not only to extract sample composition, but also to simulate different processes, e.g., Finite Element Method (FEM) analysis.
Keywords: Asphalt mixtures, X-Ray CT images, ToyModel, scanning, segmentation, scaling.
RESUMEN
Las mezclas asfálticas son materiales con los que está construido más del 80% de los pavimentos en Colombia y en el mundo. Por lo general, para su estudio, se consideran como un solo material aunque están compuestas por rocas, mastic y vacíos con aire, y su comportamiento depende de las características de cada una de las fases. El objetivo de este proyecto es realizar la reconstrucción tridimensional de una muestra de mezcla asfáltica a partir de imágenes de tomografía axial computarizada. El proceso de reconstrucción consta de tres etapas: escaneo, segmentación y escalamiento de la imagen. Estas se implementaron en Python bajo el paradigma de programación orientada a objetos (OOP) y en el que se utilizaron herramientas como Numpy, Scipy, Pydicom, Scikit-learn, Matplotlib y Mayavi. Como resultado se reconstruyó un modelo digital tridimensional denominado ToyModel, un sólido tridimensional representado en voxeles de 1 mm3. El ToyModel reconstruido tuvo una representación altamente significativa con respecto a la original, ya que el volumen de vacíos con aire de la muestra real debe estar entre 4 y 8% según la normatividad del Instituto de Desarrollo Urbano (Bogotá, Colombia) y se obtuvo un valor de 3.98%. Este proceso es una buena herramienta para representar la composición de las mezclas asfálticas y con el modelo reconstruido se pueden realizar diferentes procesos de simulación, como por ejemplo análisis de Elementos Finitos.
Palabras clave: Mezclas asfálticas, imágenes de tomografía axial de rayos X, ToyModel, escaneo, segmentación, escalamiento.
INTRODUCTION
Digital image processing techniques and digital reconstructions are a fundamental step to perform materials simulations and to study their phenomena, e.g., asphalt mixture aging. Despite the complex heterogeneous asphalt mixtures composition of aggregates, binder, and air voids, they have been traditionally modeled as a homogeneous material [1]. However, their components (materials) have different mechanical behaviors and present different responses to environmental variables and mechanical loads. Therefore, when processing the image, it is necessary to identify the asphalt concrete components in order to do a reliable reconstruction and perform more accurate simulations on this reconstruction.
The scientific literature contains a significant amount of works of asphalt mixtures models viewed as a homogeneous material, in combination with FEA (Finite Element Analysis) and other numerical simulations. Other studies focus on the characteristics of certain components, such as the one carried out by Zhang et al. [1] that analyzed the angularity of coarse aggregate by performing a histogrambased segmentation over aggregates images. However, in recent years, some authors have taken into account asphalt mixtures heterogeneous composition. Caro et al. [2] developed a model in order to study asphalt oxidation effects. This model includes coarse aggregates, a Fine Aggregate Mixture (FAM), and air voids. The first two elements were extracted directly from the image while the air void phase was incorporated into the model by following probabilistic principles. Likewise, other researchers have used statistical methods to develop heterogeneous asphalt models [3-4]. Hao et al. [5] developed a threshold selection scheme for Hot Mixture Asphalt (HMA) images, using Shuffled Frog Leaping Algorithm (SFLA) to optimize the search procedure in multilevel Kapur entropy. In addition, Zhang et al. [6] applied X-Ray Computerized Tomography (X-Ray CT) in order to build a 3D digital asphalt mixture reconstruction and then they took this data as an input for FEA software Abaqus® [7]. It is important to highlight that few studies have been done regarding 3D modeling of asphalt mixtures since more researches have been developed using one or certain amount of 2D asphalt specimen cross sections.
This project sought to develop a 3D reconstruction of a cylindrical asphalt mixture sample from a set of images on a Dicom file format, a typical X-Ray CT scan output (for detailed information refer to Pacateque et al. [18]). The components of asphalt mixture were identified through three-phase segmentation. Additionally, the 3D model was rescaled in order to prepare the data for subsequent FEA. This process was implemented on the Python programming language [8] by using the open-source libraries Numpy, Scipy [9], Pydicom [10], Scikit-learn [11], Matplotlib [12] and Mayavi [13].
1. MATERIALS AND METHODS
The asphalt mixtures used for this project were made of the same materials employed to build asphalt pavements in Bogotá, Colombia. Asphalt cement samples were taken from vacuum bottoms processed in an oil refinery located in Barrancabermeja, Colombia, and mineral aggregates (rocks) came from the Coello River, located in Tolima, Colombia. In order to build the cylindrical samples (asphalt concrete), the Superpave method was used. This method defines the air void tolerance level of the asphalt mixture between 4% and 8%. The asphalt mixture was prepared using the proportions recommended by the Instituto de Desarrollo Urbano de Bogotá (IDU as per the acronym in Spanish) for the MD-12 mixture and it was built with a diameter of 100 mm and a height of 700 mm. Those samples were made at the Civil Engineering Laboratory at Pontificia Universidad Javeriana.
1.1 SCANNING PROCESS
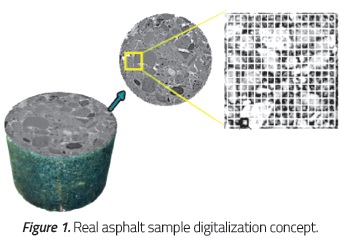
X-Ray CAT was used for the scanning process. The cylindrical asphalt mixture sample was transformed into digital information, from now on called ToyModel (Figure 1). Using a Toshiba Aquilion tomography scanner from the San Ignacio Hospital (Bogotá, Colombia), the scanning was executed on different planes: transaxial, sagittal and coronal. The specific energy level used was 135 KVP (Kilo-Voltage Potential) with a configuration of 0.5 mm slice width. Then, raw data obtained were stored as several sets of Dicom images, a typical file format for CAT scans. The transaxial set of images was chosen since it was more suitable given the field conditions and had a better mathematical condition for the scaling process. The raw data were 211 images, which represented slices, each one with a size of 514.4 Kb and a total of 345 Mb for the complete ToyModel. Taking into account the physical configuration of the real sample, three phases were established: rocks, mastic, and air voids. The rock phase was the material larger than 1 mm, while mastic corresponded to the mixture of asphalt cement and fine rocks with a size up to 1 mm. To match the real sample with the ToyModel, the digital unit used for the reconstruction was the voxel (cubic shape) with 1 mm side.
1.2 DATA SCALING
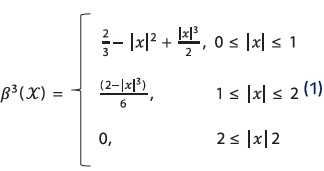
Since each image has a matrix of 512 by 512 pixels, an interpolation process was developed to construct the digital ToyModel in the dimensions of the aforementioned voxels. For this purpose, the C-Spline algorithm was applied. It consists in finding a function which is the linear combination of piecewise defined functions known as Basis Splines (B-Spline) [14].
Those B-Splines are smooth functions whose first, second, and third derivative pass through one point of the given discrete set, i.e., the set of equations (1). This method has some advantages over the traditional methods (polynomial interpolation): the approximation is more accurate; the result is guaranteed to be a continuous function, which uniformly converges to the target function; and finally, it does not have the effect of propagation as in polynomial interpolations, in which if the function to be interpolated varies rapidly in some interest region, the whole function is affected. The linear combination of the B-Spline functions can be expressed by the next equation:
1.3 SEGMENTATION
Thereafter, to classify the materials from the sample, a segmentation algorithm was implemented. In this case, the K-means algorithm, which is based on the Lloyd's algorithm [15], was used. The k-means algorithm takes a dataset X of N values from every pixel of the X-ray CT slices denominated the Hounsfield Units [16]. A parameter K specifies how many clusters to create. The output is a set of K clusters centroids and a labeling of X that assigns each of the points in X to a unique cluster. K-means finds evenly-spaced sets of points in subsets of Euclidean spaces called Voronoi diagrams. Each of the partitions found will be a uniformly shaped region denominated Voronoi cell, one for each material. This process is executed in two steps:
- The assign step consists in calculating a Voronoi diagram having a set of centroids µ_n. The clusters are updated to contain the closest points in distance to each centroid as it is described by the equation (3):
- The update step, given a set of clusters, recalculates the centroids as the means of all points belonging to a cluster.
- The k-means algorithm loops through the two previous steps until the assignments of clusters and centroids no longer change. The convergence is guaranteed but the solution might be a local minimum as shown in the equation (5):
2. COMPUTATIONAL IMPLEMENTATION
For data computation, Object Oriented Programming (OOP) resulted convenient because it easily represents the entities involved in physical phenomena. The aim of OOP is to represent systems through objects with attributes, and the objects' state can be updated by routines denominated methods [17]. There are several programing languages that support OOP, e.g., Java, Ruby, and C++. However, the Python programming language has become a useful tool for scientists and scientific computing over the last few years because of two important libraries: Numpy and Scipy. Numpy is an extension to Python, which adds support for large, multidimensional arrays and matrices, along with a large library of high-level mathematical functions to operate on these arrays. In addition, Scipy is a Python-based environment of open-source software for mathematics, science, and engineering.
To be precise, the Pydicom library was used to inspect data from Dicom files and the Numpy data structure supported this large data matrix. The K-means algorithm was implemented through the Scikit-learn library from its clustering module algorithms. As far as C-Spline is concerned, the Scipy module of interpolation was applied for the rescaling process. Likewise, the open source plotting tool Matplotlib was used for the visualization of the ToyModel slices, with the advantage of direct Numpy data input. This tool is also compatible with Qt, a widely used platform to develop software with Graphic User Interfaces (GUI). When the slice is being rendered, Matplotlib can handle many color maps, since this library sets a range of colors based on the given Hounsfield Units. Once the interpolation and segmentation of the data were finished, the Matplotlib color-maps were modified to represent the three labels to differentiate the aggregate elements, the mastic, and the air voids in the asphalt mixture sample. Finally, in order to obtain a 3D view of the segmented data, the Mayavi library was employed. It provides an easy and interactive visualization of 3D data with seamless integration with Python scientific libraries.
3. RESULTS
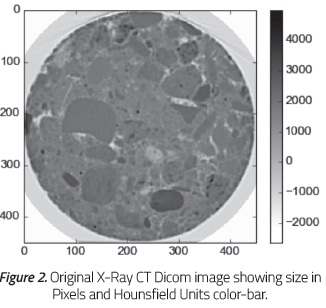
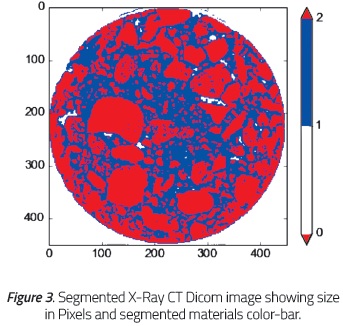
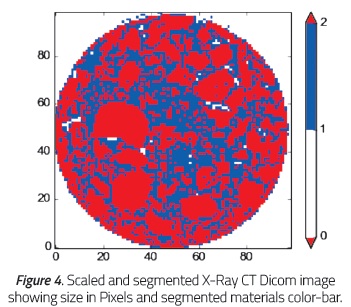
By using a single X-Ray CAT slice (Figure 2) from the sample as a reference for comparison, Figure 3 shows the output from the segmentation process and Figure 4 shows the result once the rescaling and segmentation were applied before the 3D reconstruction.
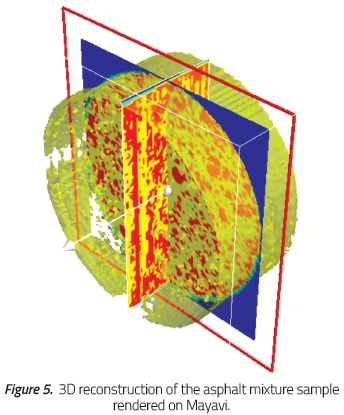
The color red is used to show the aggregates in the asphalt mixture, the color blue represents the mastic, and the color white the air voids. In the original image, the seismic color map was chosen to match the selected colors on the processed images. While the original image had 512 square pixels of area and pixel values from -2048 to 4000, the segmented image (with the same size) only has 3 pixel values from 0 to 2 representing the sample voids, mastic, and aggregates, respectively. The reduced image, by applying an interpolation factor of 100/450, has 100 square pixels of area and the 3 pixel values from the segmentation process, which reduces the amount of data by 96.2% for each image. Once the interpolation and segmentation processes over the X-Ray CAT samples are done, the 3D representation can be seen using Mayavi library as shown in Figure 5. The asphalt mixture materials are red for the aggregates, yellow for mastic, and green for air voids. The translucent yellow regions are 3D representation of air voids.
After the digital reconstruction, a count of the sample elements was performed as a method for model validation. The number of pixels for each material and its percentages were: 3.98% of air voids, 37.5% of mastic and 58.5% of aggregates. These percentages match the Superpave specification. Considering the need to differentiate the air void pixels within the cylinder from the air void space outward, a blue mask (on Figure 5) was applied to label the outward pixels, isolating them from the reconstruction.
4. DISCUSSION
The X-Ray CT energy levels were set to highlight the three target materials. Knowing the general proportions of asphalt mixtures and the corresponding Hounsfield units for aggregates, mastics and air voids represents an advantage of the image processing techniques over digital photography (even high resolution photography).The K-means algorithm was applied on the raw data considering three different material components (mastic, aggregates and air voids) of asphalt mixtures since, for this algorithm, the number of clusters has to be known and taken as an input. This is different from the strategy used by Hao et al. [5], who developed a more general algorithm suitable for other kind of images (with n clusters). As a result of the implementation of the aforementioned algorithm, we collected 211 segmented Dicom images in 1.9 seconds using a laptop with a Core i3® 380 M Processor, 4 Gb of RAM, Python 2.7 and GNU/Linux 3.13.0-35-generic Kubuntu 14.04 64 bits.
The methods applied are more accurate than models with probabilistic assumptions, as mentioned in Caro [2] and other authors [4-6], even though a rescale process was performed. Regarding the scaling of the voxels to the required size (1 mm * 1 mm * 1 mm), there is not enough evidence of applicable methods over digital reconstructions of asphalt mixtures. The C-Spline algorithm is a trustworthy approach since the volumetric reconstruction compared to the real sample has a coincidence of 95%. In addition, the computation performance produced 211 scaled images in 7.5 seconds.
The implementation was made in a self-written application using Python and open-source libraries rather than other traditional and copyrighted programming languages or software applications, e.g., Matlab ®. This was due to the fact that copyrighted software and libraries hide details of the implementation of algorithms. On the other hand, open-source code allows and stimulates researchers to replicate the methods and results, contributing to validation through collaborative work of the academic community.
5. CONCLUSIONS
The three-phase segmentation executed on the original Hounsfield values and [1] the resulting air void percentages ensure comparable digital recreations to the samples employed in the laboratory. The developed application can be used on different asphalt mixture samples to obtain reliable digital reconstructions as well.
Digital reconstructions allow not only to identify the amount and proportions of [2] the materials on the ToyModel, but also to obtain its exact distribution, which is a relevant factor in asphalt mixtures aging, as Caro et.al. [2] pointed out. It is possible to achieve a higher degree of complexity in the physical phenomena reconstructed on subsequent simulations. The scaling [3] process reduces the amount of data obtained from the scanning of the real sample without losing reliability, hence, the materials of the sample (rock, mastic and air voids) remain proportioned, whereas [4] the computational cost of subsequent simulations is decreased.
Python constitutes an easy-to-learn open-source software ecosystem in which the academic community can work on scientific [5] computing, in contrast to privative software in which the results are available, but the implementation of the methods is hidden and, therefore, irreproducible, preventing the validation of scientific findings.
ACKNOWLEDGMENTS
Special acknowledgments to the San Ignacio Hospital for providing the X-Ray CAT scanner that made this project possible.
REFERENCES
[1] Zhang, J., Huang, X., Wu, J. and Xie, M. (2009). The Application of Digital Image Processing Technology in the Quantitative Study of the Coarse Aggregate Shape Characteristics. 2009 1st International Conference on Information Science and Engineering (ICISE) (pp. 1471-1475). Nanjing, China: IEEE. [ Links ]
[2] Caro, S., Diaz, A., Rojas, D. and Nuñez, H. (2014). A micromechanical model to evaluate the impact of air void content and connectivity in the oxidation of asphalt mixtures. Constr. Build. Mater.,61, 181-190. [ Links ]
[3] Zaitsev, Y. B. and Wittmann, F. H. (1981). Simulation of crack propagation and failure of concrete. Matér. Constr., 14(5),357-365. [ Links ]
[4] Yang, S.-F., Yang X.-H., and Chen, C.-Y.(2008). Simulation of rheological behavior of asphalt mixture with lattice model. J. Cent. South Univ. Technol., 15(1), 155-157. [ Links ]
[5] Hao, Y., Qiu-sheng, W. and Hai-wen, Y. (2011). An improved image segmentation algorithm and measurement methods for asphalt mixtures. 2011 IEEE 5th International Conference on Cybernetics and Intelligent Systems (CIS), (pp. 36-41). Qingdao, China: IEEE. [ Links ]
[6] Zhang, X.-N., Wan, C., Wang, D. and He, L.-F. (2011). Numerical simulation of asphalt mixture based on three-dimensional heterogeneous specimen. J. Cent. South Univ. Technol., 18(6), 2201-2206. [ Links ]
[7] Abaqus Overview - Dassault Systèmes [Online]. (n.d.). Retrieved Oct 30, 2013 from http://www.3ds.com/products-services/simulia/portfolio/abaqus/overview/. [ Links ]
[8] Python [Software]. (n.d). Available from http://www.python.org/about/. [ Links ]
[9] Jones, E., Oliphant, T., Peterson, P., et al. (2001). SciPy: Open source scientific tools for Python [Software]. Available from http://www.scipy.org/. [ Links ]
[10] Pydicom - Read, modify and write DICOM files with python code - Google Project Hosting. (n.d.). Retrieved Sep 01, 2014 from https://code.google.com/p/pydicom/. [ Links ]
[11] Pedregosa, F., Varoquaux, G., Gramfort, A., Michel, V., Thirion, B., Grisel, O., Blondel, M., et al. (2011). Scikit-learn: Machine Learning in Python. [ Links ] J. Mach. Learn. Res., 12, 2825-2830.
[12] Hunter, J. D. (2007). Matplotlib: A 2D graphics environment. Comput. Sci. Eng.,9(3), 90-95. [ Links ]
[13] Ramachandran, P. and Varoquaux, G. (2011). Mayavi: 3D Visualization of Scientific Data. Comput. Sci. Eng., 13(2),40-51. [ Links ]
[14] Unser, M. (1999). Splines: a perfect fit for signal and image processing. IEEE Signal Process. Mag., 16(6), 22-38. [ Links ]
[15] Arthur, D. and Vassilvitskii, S. (2007). K-means++: The Advantages of Careful Seeding. Proceedings of the Eighteenth Annual ACM-SIAM Symposium on Discrete Algorithms (pp. 1027-1035). Philadelphia, PA, USA: SIAM. [ Links ]
[16] Patiño, J. F. R., Isaza, J. A., Mariaka, I. and Zea, J. A. V. (2013). Unidades Hounsfield como instrumento para la evaluación de la desmineralización ósea producida por el uso de exoprótesis. Rev. Fac. Ing., 0(66), 159-167. [ Links ]
[17] Tucker, A. B. (2004). Computer Science Handbook (Second Edition). Boca Raton, FL, USA: Chapman and Hall/CRC, 21262152. [ Links ]
[18] Pacateque, J., and Puerto, S. (2014). Asphalt Mixtures Aging Simulator Prototype. Available from https:/github.com/JeisonPacateque/Proyecto-de-Grado-Codes. [ Links ]


