


 English (pdf)
 Article in xml format
 Article references
 Send this article by e-mail
 Cited by SciELO
  Cited by Google
  Similars in
SciELO
Similars in
SciELO  Similars in Google
 Permalink
Introduction
Smart Grid is a concept that aims to provide mechanisms for energy generation and consumption in a more efficient and intelligent manner. This concept proposes the adoption of data network advantages for grid operation in the areas of control, communications and monitoring [1]. For this purpose, the modernization of the infrastructure that supports power generation, transmission, distribution, and consumption has caused the emergence, within the communications network, of a variety of IP compliant devices that are interconnected by an Ethernet technology-based network [2].
Although the communication networks of IEC 61850 modern electrical substations [3] provide better benefits than the communication networks of traditional substations, companies are being cautious with their implementation due to the vulnerabilities noted by various research articles [4]. For example, in [5] and [6] Denial of Service (DoS) attacks were implemented. Also, in [6] network traffic was intercepted (sniffing). Interception and modification of critical traffic (tampering) were attained in [7] and [8], while a spoofing attack was achieved in [9].
In this context, anomaly or intrusion detections within power substation communication networks have become an important research topic, as a consequence of the serious damage that failure may cause in this critical infrastructure. The majority of intrusion detection systems are focused on the detection of signatures (characteristic patterns associated with a particular intrusion or attack). However, for obvious reasons, this detection does not cover new types of attacks [10]. Hence, the study of unsupervised classification techniques that, through the wide recognition of normal network traffic, can allow the identification of possible abnormal states of operation is of special interest.
The main contribution of this paper is to determine the application of hierarchical clustering algorithms in the identification of anomalous operation scenarios, specifically in IEC 61850 power substation communication networks.
Conceptual framework
The main notions of IEC 61850 communication networks, as well as the operating fundamentals of hierarchical clustering techniques, are presented below.
Communication networks in power substations
In general, we can define a communications network of an automated power substation as a set of IP-supported devices, exchanging information via an Ethernet network that uses switches as interconnecting elements. This network is set up to ensure a communication platform supporting management, monitoring, synchronization, protection, control and sensing operations within power substations. Currently, the substation automation process is guided by IEC 61850 [3], which covers almost all aspects of a Substation Automation System (SAS). This standard provides recommendations to guarantee the interoperability of devices from different manufacturers. Also, the standard defines how management, control and protection, and measurement devices intercommunicate inside a substation. As shown in Fig. 1, the model proposed by IEC 61850 is hierarchical, in which three levels are identified: station, bay, and process, interconnected via the process bus and the station bus.
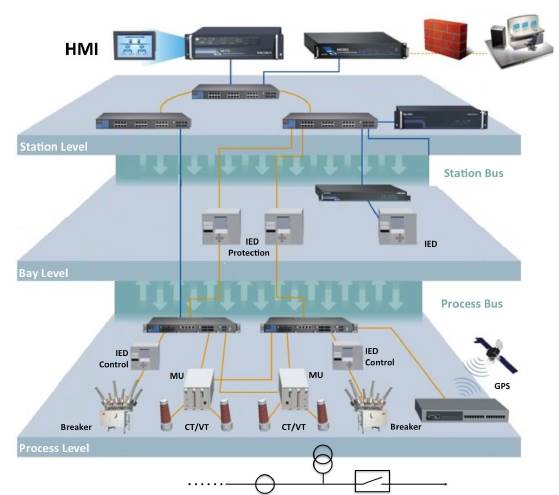
The process level is composed of actuators, measuring devices called MUs, Ethernet switches and yard equipment such as Current Transformers (CTs), Voltage Transformers (VTs), and breakers. At the bay level, we find protection and control IEDs (Intelligent Electronic Devices), while at the station level Ethernet switches and communications network management devices are located. IEC 61850 also defines four types of communication services in order to ensure the correct operation of the network (Table 1) [2].
Table 1 Communication services defined in IEC 61850
| Type of Service | Description |
|---|---|
| ACSI (Abstract Communication Service Interface) | Defined in IEC 61850-7-2 to address the basic requirements for the process of exchanging information. With this aim, the MMS (Manufacturing Message Specification) protocol is used to transport operational information for managing the substation between the user interface system and IEDs. |
| GOOSE (Generic Object- Oriented Substation Event) | Defined in IEC 61850-8-1 for the purpose of distributing event data (commands, alarms, indications, trip messages) among IEDs across the entire substation network. |
| SMV / SV (Sampled Measured Values) | Specified in IEC 61850-9-2 and used to transmit analog values (current and voltage) from the Mus to the IEDs. |
| TS (Time Synchronization) | Uses the PTP (Precision Time Protocol) for ensuring clock synchronization among devices of a distributed system. |
Source: The author.
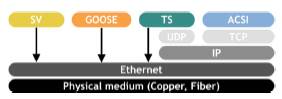
Pursuant to IEC 61850-5 and IEC 61850-8, it is recommended that communication services be mapped to different communication stacks according to their performance requirements (Fig. 2).
Hierarchical clustering algorithms
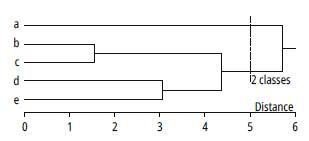
A clustering algorithm is a multivariate statistical procedure aiming at grouping or classifying the elements of a data space into compact, separate, and homogeneous groups called clusters or classes. In particular, unsupervised clustering algorithms intend to discover the composition of the classes or groupings to which elements belong without having prior information about data structure. This clustering should guarantee that the degree of natural association is high among members of the same group and low among members of diverse groups [11]. Unsupervised clustering algorithms are divided into two major categories: hierarchical and partitional. Partitional algorithms divide data space into a specified number of groups, following an optimization criterion. Meanwhile, hierarchical algorithms generate a structured organization of nested groups, which is represented by a classification tree known as a dendrogram (Fig. 3). The dendrogram illustrates how the algorithm groups elements step by step and, observing the structure of their branches and the distance among them, the diagram shows the degree of similarity between different clusters. In addition, depending on where the cut level of the dendrogram is established, the number of classes for the classification algorithm is defined [11].
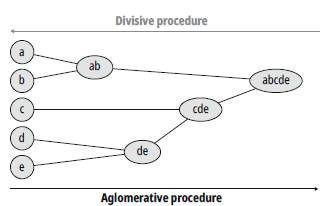
Hierarchical clustering techniques are classified into two categories: agglomeration-based and division-based (Fig. 4). Agglomerative algorithms, or bottom-up approach, start the analysis with as many groups as there are elements in the data space. From these initial units, groups are formed in ascending order, until all treated cases are within a single set at the end of the process. With an opposite approach, division-based algorithms, also called top-down, begin with a set that encompasses all observations, and from this initial cluster, smaller and smaller groups are formed through successive divisions. At the end of the process, there are as many groupings as cases have been treated.
The operation scheme of agglomerative hierarchical algorithms, a classification mechanism used in our approach, is simple (Table 2). However, for its execution, it is necessary to define previously: 1) what the association actions are that will allow measuring the proximity of individuals (distance/ similarity), and 2) how it can be determined when two clusters or classes can be grouped [11].
Table 2 Agglomerative hierarchical algorithm
| 1: Calculate the distance matrix |
| 2: Define each element as a class |
| 3: Repeat |
| 4: Group the two closest classes |
| 5: Update distance matrix |
| 6: Get a single cluster as a result |
Source: The author.
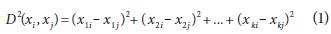
There are different metrics to determine the proximity of the individuals to be classified, considering their qualities. For example, if the characteristics of individuals are quantitative, a measure of distance will be used as an indicator of proximity. On the contrary, if the attributes of individuals are qualitative, a similarity index will be used as a proximity metric. The most used distances include Euclidean distance, Manhattan distance, Minkowski distance, Pearson correlation, cosine similarity, among others. The distance used in this approach is the Euclidean distance (Equation 1).
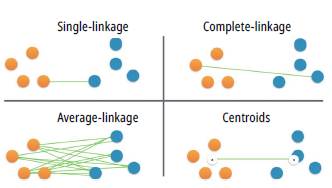
Having defined the proximity measure (Euclidean distance), it is necessary to define the criteria for identifying which are the closest classes to their corresponding grouping. In agglomerative hierarchical clustering, diferent mechanisms are distinguished to achieve this objective. These include Minimum or single-linkage clustering, Maximum or complete-linkage clustering, Mean or average-linkage clustering, and Centroid linkage clustering. Fig. 5 shows the clustering criteria used in these techniques. For example, in single-linkage, clusters are joined considering the shortest distance between the closest members of different groups, while, in complete-linkage, clusters come together considering the shortest distance between the more distant members of different groups. In the average-linkage technique, clusters are united considering the shortest average distance among all the pairs of elements of both sets [11].
Method
To illustrate the effectiveness of hierarchical algorithms as a mechanism for the classification of operation scenarios in power substation communications, a test scenario was designed and implemented in an isolated and controlled environment. A description of the implemented testbed, defined operating scenarios, descriptors used and the classification process carried out are discussed below.
Data capture
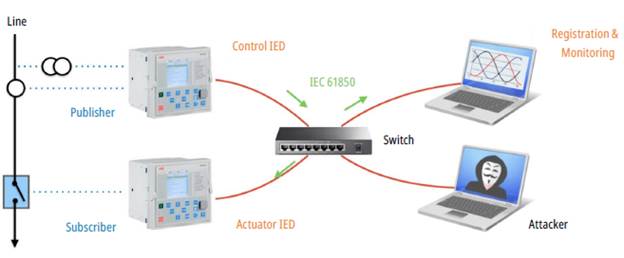
To capture network traffic, a prototype of a test communications network (testbed) was implemented in an isolated and controlled environment (Fig. 6). This network topology was composed of a generic interconnection device (Ethernet switch); two IEDs (ABB REM630 and ABB REG620) operating in the modes described in Fig. 6; a PC for registering and monitoring the events transmitted by IEC 61850 and the capture of network traffic through the WIRESHARK application; and a PC (attacker) to execute intrusions such as network topology discovery through the NMAP, carrying out a DoS attack using HPING3, and fabricating an spoofing attack for Goose messages sent by the publisher using the OSTINATO application. The behavior of the high voltage line was emulated by ISA DRTS66 test equipment.
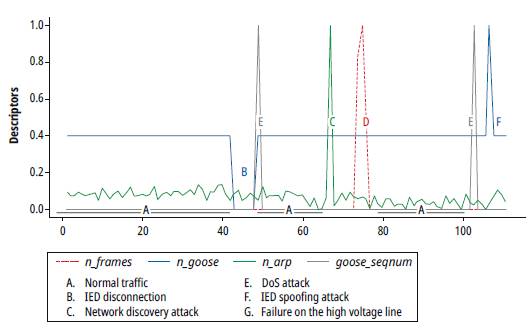
On the communications network described in Fig. 6, six different operating scenarios were defined: 1) normal traffic, 2) IED disconnection, 3) network discovery attack, 4) DoS attack, 5) IED spoofing attack, and 6) failure of the high voltage line. The operating conditions of the described scenarios were generated sequentially and captured by the equipment called Registration and Monitoring in order to capture 20 minutes of traffic with 226,000 frames (PCAP file).
Descriptor identification
At this stage, a specific set of characteristics or attributes should be defined, so that each element of the data space is represented by a collection of descriptors. These descriptors will allow identifying the features that affect the classification problem. This initial choice reflects the researcher's opinion about the purpose of their classification [11].
In the field of network traffic pattern detection through unsupervised classification mechanisms, studies use two types of attributes as illustrated in Table 3: 1) attributes based on network flow, i.e., on the value of a communication protocol field (IP, UDP, TCP) or MAC address, and 2) statistical attributes, such as the average of a particular type of packet, the distribution function that the parameters of a packet perform, among others.
Table 3. Descriptors used in the recognition of traffic patterns through non-supervised algorithms
| Title | Algorithm | Descriptors |
|---|---|---|
| Learning rules and clusters for anomaly detection in network traffic [10] | Outliers detection with k-NN | Probabilistic. P (W|U) where U = {SrcIp=128.1.2.3, DestIp=128.4.5.6} and W = {DestPort=80} |
| Traffic anomaly detection using k-means clustering [12] | K-means | Protocol type, source IP address, destination IP address, source port, destination port |
| P2P traffic identification and optimization using fuzzy c-means clustering [13] | Fuzzy c-means | NumberofPacketsSent/ReceivedforaFlow, Protocol, DurationoftheFlow, SourcePort, DestinationPort TotalNumberofPackets, MeanPacketLength, MeanPayloadLlength, MeanPacketInter-arrivalTime, AverageSent/ReceivedPacketSize, Variances, ByteRatio’s |
| CoCoSpot: Clustering and Recognizing Botnet Command and Control Channels using Traffic Analysis [14] | Hierarchical clustering | Transport layer protocol l4p (TCP or UDP), source IP address sip, destination IP address dip, port destination dp |
| PeerShark: flow-clustering and conversation generation for malicious peer-to-peer traffic identification [15] | X-means (K-means that does not require previously knowing the number of classes) | Src. IP, Dest. IP, Src. port, Dest. port, Proto (TCP or UDP), Protocol, Packets per second (f/w), Packets per second (b/w), Avg. Payload size (f/w), and Avg. Payload size (b/w), with ‘f/w’ and ‘b/w’ signifying forward and backward direction of the flow, respectively |
| An unsupervised approach for traffic trace sanitization based on the entropy spaces [16] | K-means | StartTime, EndTime, source IP address, source port number, destination IP address, destination port number, number of packets and number of bytes in the flow. |
| Classification of Network Traffic Using Fuzzy Clustering for Network Security [17] | Fuzzy c-means (FCM) | Duration (seconds of the connection), src_bytes (data from src to dst), num_failed_logins, root_shell, num_access_files (operationsonaccesscontrolfiles), serror_rate (percentofconnectionswith”SYN” errors), same_ srv_rate (percent of connections to same service), srv_count (connections to same service in past 2 seconds). |
| Network Intrusion Detection with Threat Agent Profiling [18] | K-means, PAM (Partitioning Around Medoids), and CLARA (Clustering LARge Application) | ID, source IP address, target IP address, category, category count, protocol, protocol count, port, duration, start timestamp, end timestamp, and ISP. |
| Bot detection using unsupervised machine learning [19] | K-means, X-means, and EM (Expectation- Maximization) grouping | Dstport (destinationport), maxbpktl (largestpacketsentinthebackwarddirection), maxfptkl (largest packet sent in the forward direction), fpsh cnt (times the PSH flag was set in packets traveling in the forward direction (0 for UDP)), and min fptkl (smallest packet sent in the forward direction). |
Source: The author.
Our study identified that four descriptors are enough for an adequate classification of the proposed operation scenarios since we get identical results using different classification algorithms.
Table 4 shows the descriptors used, three of the statistical type (n_frames, n_goose, n_arp) and one based on network flow (goose_seqnum).
Table 4 Descriptors used in this study
| Descriptor | Identified situation |
|---|---|
| n_frames, the average of the total number of frames captured in the time window (10 seconds) | DoS attack. This attack, independent of the service to attack, generates a huge amount of traffic on the network in a truly short period of time. |
| n_goose, an average of GOOSE packets captured in the time window (10 seconds) | IED Publisher disconnection or failure in the high voltage line. When an IED is disconnected, the average of GOOSE packets in the time window goes to zero. Similarly, when there is a fault in the high voltage line, the average of GOOSE messages increases as a consequence of the event. |
| n_arp, an average of ARP packets captured in the time window (10 seconds) | Execution of a network discovery by an intruder. Most network discovery attacks use the ARP protocol operation scheme as a strategy to discover the stations connected to the network. |
| goose_seqnum, SeqNum field of the GOOSE packet header | Spoofing attack of an IED Publisher. Evidence of this attack is the anomalous change of the SeqNum field values in the GOOSE header. These values are registered in sequence; therefore, any value out of order implies an intrusion. This descriptor will take the value of one if there is an anomalous change in this field. Otherwise, its value will be zero. |
Source: The author.
Data pre-processing
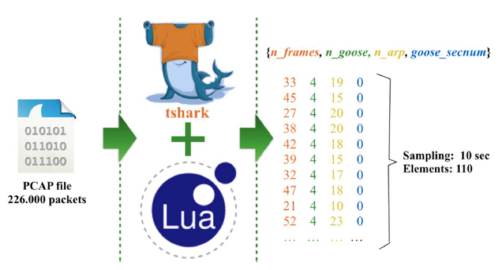
Once the descriptors that will characterize the elements of our data space were identified, the traffic capture file (PCAP) was processed in order to obtain this set of elements. For this purpose, we developed a script in the LUA programming language [20] to be executed into the TSHARK application. In this way, it was possible to get a set of 110 elements. Each element, with four descriptors, shows the behavior of the network traffic in a time window of 10 seconds (Fig. 7).
Exploratory data analysis
Fig. 8 shows the behavior of normalized descriptors along the data space obtained, for each of the described operation scenarios.
Classification process
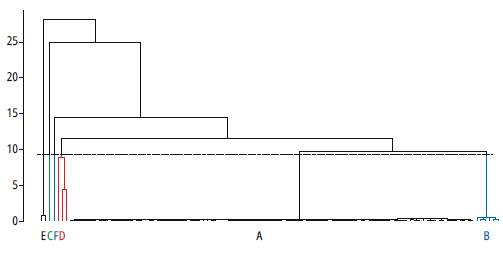
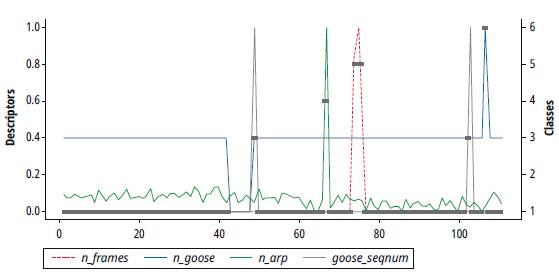
At this stage, the clustering algorithm is responsible for assigning to each element of the data space a category or class (set of elements that share certain characteristics, which also allow differentiating them from the rest). The classification process of this study was carried out using the hclust function of the software for R statistical analysis. Although there is no single criterion to determine which measure of association is the most appropriate to measure the proximity of individuals (distances/similarity), and which is the most convenient mechanism for grouping classes, it is recommended that results be tested and compared with different methods. Here, we opted to experiment with Euclidean distance and Gower distance as proximity metrics [21], along with single-linkage, complete-linkage, and average-linkage techniques as strategies for grouping classes. From the tests carried out, the best classification scheme was achieved using single-linkage and Euclidean distance. This combination allowed identifying the six operation scenarios described through six classes, while the other schemes required at least seven classes to correctly identify the six scenarios. Fig. 9 and Fig. 10 illustrate the structure of the dendrogram and the classification process obtained according to the behavior of descriptors.
Analysis of results
The tests carried out show that Gower distance and Euclidean distance exhibited similar base structures, but different clustering structures. In the same way, despite the fact that the class clustering scheme was changed (simple, complete and average), at the base of the dendrogram, it was always possible to identify each of the proposed scenarios; what changes in the structure is the way they clustered. It becomes clear that by fixing a cut-off point of the dendrogram to six or seven classes, it was possible to identify all the defined operating scenarios. However, the best result was reached using Euclidean distance with single-linkage clustering.
The analysis of the dendrogram structure (Fig. 9) shows that all operating scenarios can be clearly recognized. Yet, we expected that all the clusters related to anomalous operation scenarios were grouped in a dominant single class of failure (failure root class), i.e., completely separating the normal traffic class (A) from failure classes (B, C, D, E,F).
Validation
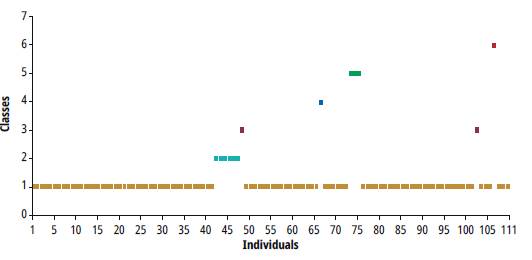
The results reached through an agglomerative hierarchical algorithm motivate a very qualitative interpretation, which can be subjective from the researcher's perspective. Hence, it is recommended that the achieved results be compared with other types of solutions, in which comparable results will indicate the presence of a structure in data. Thus, we explored other solution strategies using partitional and diffuse unsupervised algorithms: K-means [22] and LAMDA (Learning Algorithm Multivariable and Data Analysis) [23]. The results obtained using K-means (Fig. 11), defining in advance that the k parameter equals six (number of operation scenarios), shows how this algorithm identifies all the proposed scenarios.
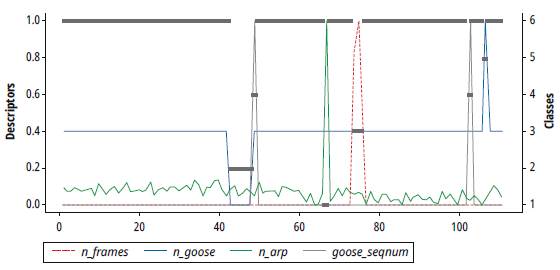
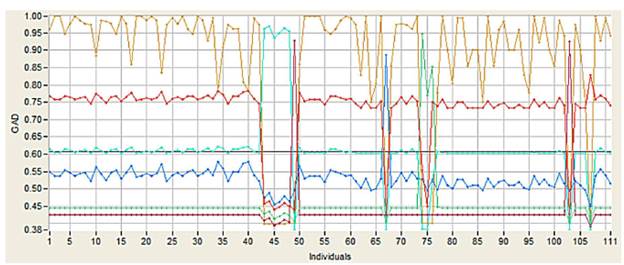
Fig. 12 illustrates the classification achieved using the LAMDA algorithm with a Gaussian adaptation function, Min-Max fuzzy logic connectors and a required level of 0.6. The LAMDA algorithm is incorporated in the P3S application (DISCO Group, LAAS-CNRS), which also allows extracting the membership graphic associated with each of the classes, Global Adequacy Degree (GAD) (Fig. 13). The results obtained were in line with the K-means classification.
Discussion
The selection of descriptors is key in a classification process; therefore, a preliminary analysis to determine their level of contribution is necessary. Likewise, data transformation or pre-treatment may be required, just like in this work, in which three statistical descriptors (averages) and one network flow descriptor (SeqNum field in the GOOSE packet header) were used.
Through the dendrogram, the hierarchical clustering strategy allows for a preliminary exploration of possible grouping structures present in the data space, when the number of descriptors is greater than three. In this way, hierarchical clustering techniques are an excellent tool to deal with completely unknown data.
Results evidence the strength of unsupervised classification mechanisms to identify all the proposed operating scenarios by using different techniques (partitional, hierarchical and diffuse). Also, Results demonstrate that these algorithms can be useful in several scenarios, for example, traffic classification in power substation communication networks.
Finally, the fact of getting identical results from different classification algorithms proves the strength of the selected descriptors for the identification of patterns in this particular application.
Conclusion
This paper presents a practical case of how unsupervised clustering algorithms can be used as an effective tool for the identification of operation scenarios in IEC 61850 power substations communication networks. However, there are still numerous application fields to explore in this area. Particularly, the detection of new anomalies, or unknown operation scenarios, is a difficult task for a classification algorithm. In our approach, descriptor selection was successful, given the prior knowledge of operating scenarios. Descriptors proved to be robust in obtaining identical results with other unsupervised clustering techniques such as K-means (partitional-type clustering) or LAMDA (diffuse-type clustering). The challenge then is to ensure that the clustering algorithm is able to classify the normal traffic scenario in a robust manner. In this way, other scenarios will be used to notify anomalous processes in the communications network.

