


 English (pdf)
 Article in xml format
 Article references
 Send this article by e-mail
 Cited by SciELO
  Cited by Google
  Similars in
SciELO
Similars in
SciELO  Similars in Google
 Permalink
Introduction
Traditionally, the seismic damage in buildings and infrastructure systems has been associated with the horizontal components of ground motions. Nonetheless, reconnaissance reports after major earthquakes like Loma Pieta (USA, 1989, M W = 6.9), Kobe (Japan, 1995, M W = 6.9), and L'Aquila (Italy, 2009, M W = 6.1) showed that the vertical earthquake component can generate significant damage to structural and non-structural elements. The damage caused by the vertical motions is attributed to substantial variations in the axial forces and the associated reduction of the shear resistance in vertical members like columns or walls, and to significant amplification of bending moments and shear forces in beams and girders [1]-[4]. The extent of those magnifications depends on the structural system and the characteristics of the ground motion. The latter are generally referred to as seismic intensity parameters and lie within three categories: amplitude, duration, and spectral responses [5], [6].
The main acceleration amplitude characteristics for the ground motions are the vertical peak ground acceleration (PGAV) and the V/H ratio, which is the ratio between PGAv and the PGA of the horizontal components. Past studies developed in seismotectonic environments different than Colombia have demonstrated that the PGAV and V/H ratios depend on the magnitude of the seismic event, site conditions, source-to-site distance, fault mechanism, among others [7]-[10]. The V/H ratios are larger than 1.0 and 2/3 for source-to-site distances lesser than 5 km and 25 km, respectively ([7], [10]) and seem to be weakly related to the earthquake magnitude and faulting mechanism but highly influenced by the local site conditions [9].
The factors mentioned above suggest that structural systems should be designed to include the effects of the vertical ground motions, especially for near-fault locations. Despite this, insufficient attention is given to the vertical earthquake component in the Colombian codes for the design of buildings (NSR-10 [11]) and bridges (CCP-14 [12]). For example, Section A.2.8 of the NSR-10 Code indicates that the minimum vertical seismic design motion may be taken as two-thirds of the horizontal design motion, being the latter represented by a pseudo-acceleration response spectrum or a family of accelerograms. The V/H ratio equal to 2/3 is a rule-of-thumb that has been adopted in practice after that ratio was proposed by Newmark et al. [13] using data from 33 earthquake records in California, USA.
This study focuses on characterizing the acceleration amplitude parameters, PGAV and the V/H ratio, of the moderate-to-strong ground motions in Colombia recorded between June 1993 and April 2020. These intensity parameters were correlated to the moment magnitude and epicentral and hypocentral distances of the events to determine potential relationships among the parameters. In light of the results, the adequacy of the minimum V/H ratio equal to 2/3 recommended in NSR-10 is assessed.
Materials and methods
This section describes the main steps in the selection and pre- and post-processing of the earthquake records. The seismic intensity parameters and the steps used to determine their relationship are also described.
Selection and processing of ground motion records
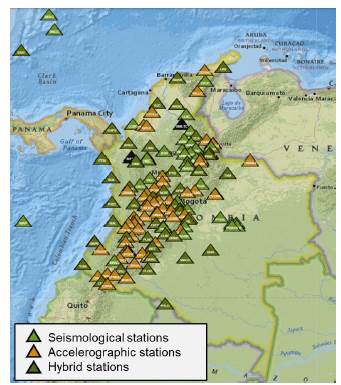
The Servicio Geologico Colombiano (SGC) monitors the seismic activity in Colombia through the national accelerograph seismic network. As of April 2021, the network consisted of 176 active stations (Fig. 1): 88 with an accelerometer only, 38 with a seismometer, and 50 hybrid accelerometer-seismometers sensors [14]. The accelerations records from those stations are compiled in two seismic catalogs available at [15]. For the interested reader, the characteristics of each station, including its location, elevation, topographic condition, and type of sensor and instrumental response, can be obtained by clicking on the station of interest in the map provided by [14]. The first catalog contains the acceleration records of the seismic events between June 1, 1993, and December 31, 2017. The second catalog contains the records of the events that have occurred since January 1, 2008. A negative aspect of the available information in the SGC database is that the local soil conditions of the stations are not detailed. Thus, instead of categorizing the soil profiles within any of the typical A to E profiles (based on the average shear wave velocity of the upper 30 m), only a basic classification like "rock," "soil," "soil-rock," is provided. Moreover, the faulting mechanism of each seismic event is not reported.
The initial and final dates used for selecting the seismic events investigated in this paper were June 1, 1993, and April 30, 2020, respectively, covering approximately 27 years. The selection criteria for the seismic events and ground motion records comprised three conditions. First, a minimum moment magnitude (M w ) of the events of 4.0 was set to guarantee that only moderate and strong earthquakes were included in the analysis. Second, the maximum epicentral distance (Repic) between the epicenter and the seismic station was set to 50 km. This threshold was selected because the vertical earthquake component is more relevant for near-site locations. Last, a minimum peak ground acceleration (PGA) of any of the two horizontal components of the records of 0.05g was set, where g is the acceleration due to gravity. This criterium was applied to avoid the inclusion of noise-like recordings that could lead to unrepresentative V/H ratios. The 0.05g umbral coincides with the acceleration threshold used to determine the absolute bracketed duration [16]. No limit was imposed to the hypocentral distance (R hypo ) to avoid significant reduction of the dataset and evaluate the depth effect on the acceleration amplitude of the vertical motions.
Each record has three acceleration signals, two for the horizontal components and one for vertical. The signals were pre-and post-processed using a script developed by the authors in the software Matlab [17]. Instrumental correction was not applied to the records because the SGC website [15] states that such correction had already been performed. The accuracy of the Matlab script was determined by calculating several seismic intensity parameters for the Loma Prieta earthquake records at Gilroy Arrays #1 and #2 and comparing them to those determined using the commercial software SeismoSignal [18], and those reported [19]. The largest difference obtained was 6.5%, indicating that the script was satisfactory. Further verifications performed for two earthquake records from the Córdoba, Quindío, 1999 earthquake (event #4 in Table 1) resulted in differences less than 1%. The comparisons are available at [20], while the script can be downloaded from [21].
Table 1 Selected events and records.
| Event # | Date (M/D/Y) | Mw | Epicenter | Station | Soil Type | R epic (km) | R hypo (km) |
|---|---|---|---|---|---|---|---|
| 1 | 02/08/1995 | 6.8 | Calima, Valle del Cauca | CTRUJ | Rock | 47.44 | 112.49 |
| 2 | 08/19/1995 | 6.6 | Risaralda, Caldas | CANSE | Rock | 18.43 | 122.30 |
| 1 | 07/18/1998 | 4.6 | Ricaurte, Nariño | CRICA | Soil | 13.70 | 13.70 |
| 4 | 01/25/1999 | 6.2 | Córdoba, Quindío | CCAST | Soil | 39.20 | 39.20 |
| CARME | Soil | 13.02 | 13.02 | ||||
| CFLAN | Soil | 28.85 | 28.85 | ||||
| CBOCA | Rock | 38.48 | 38.48 | ||||
| 5 | 06/01/1999 | 5.1 | El Calvario, Meta | CVIL1 | Rock | 17.27 | 17.28 |
| 6 | 03/08/2005 | 5.1 | Toro, Valle del Cauca | CVERS | 13.77 | 14.65 | |
| CPOST | Soil | 47.13 | 47.39 | ||||
| 7 | 06/22/2005 | 4 | Córdoba, Quindío | CPOST | Soil | 14.31 | 14.41 |
| CCALA | Rock | 12.48 | 12.60 | ||||
| CARME | Soil | 14.31 | 14.41 | ||||
| 8 | 11/25/2006 | 4.7 | Ricaurte, Nariño | CSAMA | Rock | 29.04 | 29.32 |
| 9 | 05/24/2008 | 4 | Fómeque, Cundinamarca | CQUET | Rock | 12.60 | 13.22 |
| 10 | 05/24/2008 | 5.6 | Quetame, Cundinamarca | CQUET | Rock | 9.57 | 9.58 |
| CBOG2 | Soil | 35.35 | 35.35 | ||||
| CVIL1 | Rock | 31.66 | 31.66 | ||||
| 11 | 05/24/2008 | 4.4 | Fómeque, Cundinamarca | CQUET | Rock | 10.94 | 12.63 |
| 12 | 05/24/2008 | 4.3 | El Calvario, Meta | CQUET | Rock | 14.67 | 20.28 |
| 13 | 05/24/2008 | 4 | El Calvario, Meta | CQUET | Rock | 16.04 | 18.85 |
| 14 | 05/25/2008 | 4.2 | Quetame, Cundinamarca | CQUET | Rock | 9.21 | 10.04 |
| 15 | 09/13/2008 | 5.2 | Palestina, Caldas | CPER2 | Soil | 20.58 | 138.93 |
| 16 | 12/18/2009 | 5.2 | Caloto, Cauca | CPTEJ | Soil | 19.86 | 152.50 |
| 17 | 10/29/2014 | 4.6 | Cumbal, Nariño | CCUMB | Rock | 20.45 | 20.45 |
| 18 | 03/10/2015 | 6.4 | Los Santos, Santander | CGIR2 | Rock | 20.89 | 161.36 |
| CBUCF | Rock | 27.65 | 162.37 | ||||
| 19 | 10/12/2015 | 4.7 | Juradó, Chocó | CPTAR | Rock | 45.14 | 45.35 |
| 20 | 02/06/2017 | 5.4 | Colombia, Huila | CCOLO | Soil | 9.24 | 9.24 |
| 21 | 08/18/2018 | 5.8 | Mar Caribe | CAP2 | Rock | 3 | 14 |
| 22 | 10/04/2018 | 5.1 | Mar Caribe | PRV | Rock | 28 | 29 |
| 23 | 10/29/2018 | 5 | Mar Caribe | CAP2 | Rock | 15 | 21 |
| 24 | 11/23/2018 | 4.5 | Océano Pacífico | PTA | Rock | 38 | 39 |
| 25 | 11/25/2018 | 6 | Mar Caribe | PRV | Rock | 24 | 28 |
| 26 | 11/25/2018 | 5.7 | Mar Caribe | PRV | Rock | 29 | 29 |
| 27 | 03/23/2019 | 6.1 | Versalles, Valle del Cauca | PAL | Rock | 31 | 130 |
| 28 | 05/24/2019 | 5 | Juradó, Chocó | PTA | Rock | 34 | 42 |
| 29 | 12/24/2019 | 6 | Mesetas, Meta | CLEJA | Soil | 18 | 22 |
| URMC | Soil | 32 | 35 | ||||
| 30 | 12/24/2019 | 5.8 | Mesetas, Meta | CLEJA URMC | Soil Soil | 15 35 | 19 37 |
| 31 | 12/25/2019 | 4.7 | Mesetas, Meta | CLEJA | Soil | 18 | 20 |
Source: Servicio Geológico Colombiano [15].
The basic steps performed by the Matlab script are as follows. First, the acceleration data from the SGC files (in ANC format) are read. Then, the velocity and displacement of each component are calculated by single and double integration of the acceleration, respectively. A cubic-polynomial baseline correction is then applied to the acceleration histories using the command "detrend." Subsequently, the Fourier spectra of the acceleration histories of each component are plotted to determine potential spurious frequency content such as noise that should be dampened or removed. When needed, a 0.2-50 Hz bandpass Butterworth filter was applied to the acceleration signal. The Fourier spectra and the acceleration, velocity, and displacement traces are then plotted to compare the original and processed data to confirm that the main characteristics of the original record had not been removed. The processed records are then used to determine the seismic intensity parameters described next.
Seismic intensity parameters
The parameters used to characterize the acceleration amplitude of the vertical earthquake motions in Colombia are the PGA, the V/H ratio, and V/ HGM. The V/H ratio was determined separately for each of the two horizontal components, while the V/HGM ratio was introduced to obtain a general relationship between the vertical and the horizontal motions. For this parameter, the geometric mean (GM) of the PGA of the horizontal components was selected to describe the overall horizontal motion. The geometric mean is an output of ground motion prediction equations [22] and is an intensity measure used to perform probabilistic structural response analyses [23]. Subscripts "V," "EW," and "NS" are used in this paper to differentiate the parameters for the vertical and the two horizontal components (East-West and North-South), respectively.
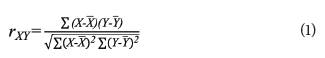
Relationships among parameters and regression analyses
The relationships among the PGAS and the V/H ratios and the magnitude (Mw), epicentral distance (Repic), and hypocentral distance (R hypo ) were determined through the Pearson correlation coefficient (rXY). This coefficient measures the linear dependency between two random variables X and Y, and is calculated using (1), in which X and Yare the mean of the two variables. The Pearson correlation coefficient ranges between -1 and 1, with the two extremes indicating direct positive and negative linear correlations, respectively. An RXY = 0 indicates no linear correlation between the two variables, although this does not mean that the variables are independent. In this paper, the linear relationship between two parameters was regarded as strong when |r XY | ≥ 0.8, moderate when 0.5 ≤ |rxY| < 0.8, and weak if |rxY| < 0.5. The statistical significance of the linear correlation was calculated through p-values to test the null hypothesis that no linear relationship existed. The null hypothesis was therefore rejected when the p-value was smaller than 0.05. The correlation coefficient and the p-value were calculated using the open-source software R [24].
The Pearson coefficients were assembled in a cross-correlation matrix to visualize the relationships among the parameters. The cross-correlation matrix was determined and plotted using the software R [24] and the library "Performance Analytics" developed by [25]. Then, multivariate regression analyses were performed to propose simplified equations that predict the PGAV and V/H ratios. The models were based on the results of the cross-correlation analysis and the models proposed by other authors. Significance levels of the coefficients associated with the predictor variables were calculated to assess if any of the predictors could be removed. Lastly, the determination coefficient (R2) and significance level of the models were calculated. The models and their significance levels were determined using the function "lm" (fitting linear models) available in the software R. Library "ggplot2", developed by [26], was used to plot the correlation between the models and the measured data.
Results
Selected ground motions
Table 1 lists the resulting seismic events (31) and associated records (42) after applying the selection criteria discussed in the previous section. The relatively low ratio between the number of records and seismic events (equal to 1.375) suggests a shortage of seismic stations located in sites near active sources. Despite the continuous addition of seismic stations in the last few years by the SGC, further efforts are still needed to enhance the Colombian seismic network.
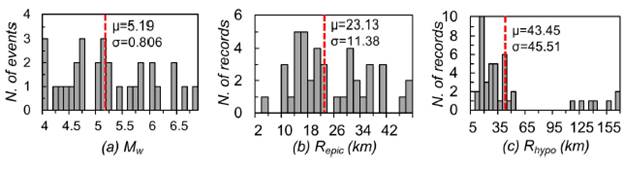
Fig. 2 shows the frequency distributions for the magnitude and the epicentral and hypo-central distances of the earthquake records. Also shown in the plots are the mean value (μ), marked as a dashed line, and the standard deviation (a). The 31 seismic events have moment magnitudes ranging between 4.0 and 6.8, and their mean and mode are 5.19 and 5.10 (three events), respectively. Most of the records correspond to epicentral distances smaller than 27 km (25/42), and the closest and farthest distances among all cases were 3 km and 47.44 km, respectively. The hypocentral distances (Rhypo) are shallower than 50 km in 35 out of the 42 records, meaning that most of the records are superficial or have intermediate depth.
Correlation among parameters
Fig. 3 shows the cross-correlation matrix for the seismic intensity parameters and the earthquake measurements M w , R epiCi and R hypo . Each of these variables occupies the diagonal of the matrix. The upper triangular section of the matrix shows the Pearson correlation coefficient between two parameters. For example, the Pearson coefficient between M w and PGA V should be read at the position i = 1, j = 4 in the upper triangular section (ri,4 = 0.31). The symbols on top of the coefficient indicate that the p-value lies in the following ranges: for range [0, 0.001]; for (0.001 to 0.01]; "**" for (0.01 to 0.05]; and "•" for (0.05 to 0.1]. A coefficient without a symbol means that the p-value is in the range (0.1 and 1.0]. For the example, the associated p-value is in the range (0.05 to 0.10). The lower triangular section of the matrix shows the relationship between two parameters and a segmented mean line that helps visualize whether a linear relationship between the two parameters is appropriate.
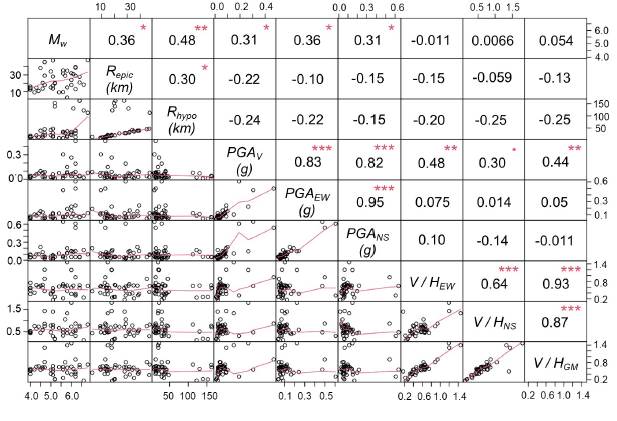
Fig. 3 shows that the PGAV increases with the magnitude of the ground motion and decreases with epicentral and hypocentral distances. These trends coincide with those reported by other authors using data from other seismotectonic environments. The relatively low values (less than 0.31) of the Pearson coefficients for the pairs PGA V -M W , PGA V -R epiC: and PGA V -R hypo suggest that attenuation equations for the PGAV should involve non-linear relationships among those parameters. The PGA of the horizontal components also exhibited a weak linear correlation with M w , R epiCi and R hypo . However, the relationship between the horizontal PGAS and M W is slightly stronger than that observed for the vertical component. Fig. 3 shows a strong linear relationship between PGA V and the peak ground accelerations of the horizontal components. The Pearson coefficients for the pairs PGAV-PGAEW and PGA V -PGA NS are r 4,5 = 0.83 and r 4,6 = 0.82, and the p-values of these relationships are smaller than 0.001, validating their linear relationship.
The linear correlation of the V/H ratios, including v/HGM, with the earthquake measurements is significantly low, especially with M w . This result agrees with the findings reported by [9]. The Pearson coefficients for the V/H-Repic pair, which are smaller than |-0.13|, do not indicate that these variables are not correlated but that their linear correlation is low. For a dataset of 113 near-field and shallow worldwide earthquakes records, [8] also found that the linear relationship between the V/H ratio and Repic was not strong. The V/H ratios of the records studied in this paper showed larger Pearson coefficients with the hypocentral distance, although they were smaller than |-0.25|. The negative value of the coefficient signifies that the V/H ratios decrease as R hypo increases. The slightly larger correlation coefficients for the pair V/H-R hypo mean that the rupture plane depth (h) also influences the amplitude of the vertical earthquake motions (recall that both h and Repic are used to calculate R hypo ).
Vertical peak ground acceleration
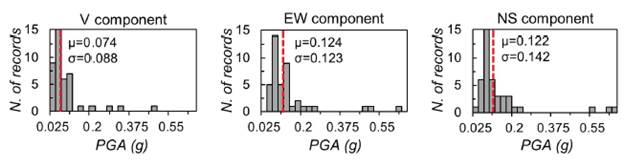
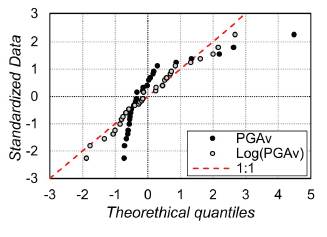
Frequency distribution plots for the PGA of the three components of the records studied in this paper are shown in Fig. 4. The mean PGAv is 0.074g, while the three highest PGAv values are 0.47g, 0.30g, and 0.27g, measured during events #4 (at CARME station), #10 (CQUET), and #29 (CLEJA), respectively. These three records are "near-site" records as their Repic was equal to or smaller than 18 km. Fig. 4 shows that the PGAS of the three components seem to have a Gaussian distribution and that they are biased towards the lower values. A closer look at the PGAV values showed that this data is not normally distributed, but its logarithmic transformation is. This was verified by plotting Quantile-Quantile plots, also known as Q-Q plots, which usually compare distributed independent data versus the standardized data of interest. The resulting Q-Q plots for the PGAV and log(pgAv) are shown in Fig. 5. Note that the latter is closer to the line with a 1:1 slope, indicating that it fits better to a normal distribution. Similar results were obtained for the PGA of the two horizontal components but are not shown in the paper due to space constraints.
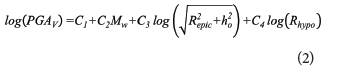
The result described above was utilized to determine a model that describes PGAV as a function of Mw, R ep , or R hypo .Equ. (2) provides the overall form of the prediction model used in this study. This model is based on that by [8], but the last term was added in this study because the PGAV showed a slightly better correlation with R hypo . Therefore, this predictor variable was also investigated. In their prediction model, [8] introduced the term ho to account that the source of the peak motion is not necessarily the closest point on the projection surface of the fault. Nonetheless, ho was not intended to incorporate the effect of the depth on the PGAV. In this study, ho was varied from 0.0 to 10 km every 0.5 km, which is similar to the range used by [8]. The resulting relationships were not intended to be proposed as attenuation models for implementation in seismic hazard analysis. This statement is especially true given the relatively small number of earthquake data that was used. Thus, the obtained models can be improved in the future as the dataset is enlarged.
The resulting coefficients (C 1 to C4), determination coefficients (R2), and p-values for six different models are listed in Table 2. Asterisks (*) are used again to indicate the significance range level of each coefficient. The ranges are the same as those used to describe Fig. 3. A dash (-) in Table 2 denotes that the variable was not included in the model.
Table 2. Resulting coefficients for the prediction models.
| Model | C1 | C2 | C3 | h0 (km) | C4 | R2 | p-value |
|---|---|---|---|---|---|---|---|
| 1 | -3.675*** | 0.420* | -0.518* | 0.0 | - | 0.1563 | 0.01370 |
| 2 | -3.388** | 0.441** | -0.637* | 5.5 | - | 0.1635 | 0.01168 |
| 3 | -3.084** | 0.446** | -0.727* | 10.0 | - | 0.1600 | 0.01259 |
| 4 | -4.262*** | 0.714*** | 0.0161 | 0.0 | -0.745*** | 0.4352 | 1.62x10⁻⁵ |
| 5 | -4.265*** | 0.714*** | - | - | -0.745*** | 0.4496 | 3.31x10⁻⁶ |
Source: The authors.
The first three models show the effect of R epic and h o , with models 1 and 3 respectively corresponding to the upper and lower limits of ho, with model 2 with the largest R2 value for ho. These three models show that the intercept (C1) and M w were more statistically significant in describing the variation of log(pGAy). The marks "***" correspond to a significance level range of [0, 0.001], whereas "*" corresponds to (0.01 to 0.05]. R epic , h o , and R hypo were then integrated into the next model. After varying ho, the largest determination coefficient of the new model set occurred when ho = 0.0 km (model 4). Although R2 in model 4 was larger than that in models 1 to 3, the low significance level of coefficient C 3 indicates that the increment was mainly due to variable R hypo . Model 4 was indeed rejected despite the larger R2 obtained because the positive value of C 3 was not realistic (e.g., the PGA V is expected to be smaller with a larger R epic ). Accordingly, variables Repic and ho were removed, resulting in model 5. This model showed high stat istically significant coefficients for the predictor variables and the largest determination coefficient of all the models (R 2 close to 0.5). The overall improvement resulted from the moderate relationship observed for the pair PGA V -R hypo , discussed above.
V/H ratios
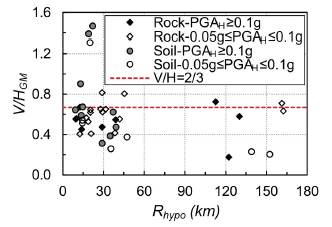
As shown in Fig. 4, the mean PGA ofthe vertical component is smaller than that of each horizontal component. The V/H ratios between those means are 0.574 (V/H EW ) and 0.658 (V/H NS ). These values are close to that adopted in NSR-10 as a minimum (V/H = 2/3). However, their standard deviations (σ= 0.263 for V/H EW and σ = 0.337 for V/H NS ) are approximately 50% of the mean, exposing a relatively large variation. The dispersion can be observed in Fig. 6, in which the V/H ratios are plotted versus R hypo . Note that different markers are used in that figure to differentiate the soil profile (either soil or rock) and the intensity of the horizontal motion. For the latter, the motions were categorized in two ranges, 0.05g ≤ PGA H < 0.1g and PGA H ≥ 0.1g, where PGA H is the largest between PGA NS and PGA EW for a given record. The V/H ratios were larger than 2/3 in ten records, corresponding to approximately 24% of the cases. Moreover, the earthquake motions with V/H larger than 2/3 correspond to R hypo shallower than 30 km (70% of the cases) and epi-central distances smaller than 21 km (70% of the cases). The soil profile effects were not evident in these records as half of them corresponded to rock sites and the remaining to soil sites.
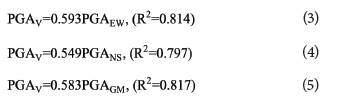
Linear regression analyses were used to determine simple prediction equations for PGA V as a function of PGAEW, PGANS, and PGAGM. These equations can estimate the intensity of the vertical movements in cases where the accelerometer is biaxial or uniaxial (or even when it is triaxial, but one or two channels are damaged). The resulting relationships and determination coefficients (R2) are presented in (3) to (5). All p-values of the prediction models were smaller than 2.2x10 16, meaning that they are statistically significant. The R2 and p-values indicate that those equations explain approximately 80 % of the variance of the PGA V with a 95 % confidence level.
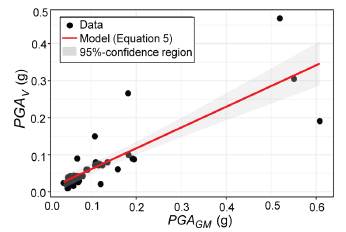
The reason why the coefficients of the predictor variables in (3) to (5) are close to each other can be explained by two factors. First, PGA EW and PGA NS have a strong linear correlation (Fig. 3) and their mean ratio is close to one (μ = 0.98, σ = 0.35). Second, the difference between the mean V/H EW (0.567) and the mean V/H NS (0.658) is statistically insignificant. The latter was validated by performing a t-test for the differences between the means of the two ratios (p-value = 0.0614) and an F-test for the difference in the variances (p-value = 0.519). The null hypothesis of both tests is that no significant difference existed; hence, the p-values larger than 0.05 mean that the null hypothesis cannot be rejected. Fig. 7 shows the relationship between the measured PGAV and PGAGM and that resulting from (5) along with the 95 %-confidence region. The more considerable differences between the predicted and measured data occur as the intensity of the vertical ground motion increases, which corresponds to larger amplitudes of the horizontal motions.
The mean V/H ratios and the coefficients of the prediction models are close to the v/H = 2/3 suggested in NSR-10 as a minimum ratio to construct the vertical acceleration design spectrum based on the horizontal design spectrum. This closeness could indicate that the recommendation in NSR-10 is sufficient to construct the entire vertical acceleration design spectrum. However, as discussed next, a single value for the V/H ratio may not be adequate.
Three earthquake records were selected as examples to demonstrate the issue mentioned above. The records correspond to ground motions #4, #10, and #29, recorded at CARME, CQUET, and CLE-JA stations, respectively. These stations are located on soil, rock, and soil profiles, respectively, and their respective epicentral distances are 13.02 km, 9.57 km, and 18 km. Fig. 8 shows the acceleration traces and corresponding 5 %-damped pseudo-accelerations spectra (PS a ) of each component. As shown in the lowermost plots of the figure, the amplitude of the vertical PS a changes substantially in the period range between 0 and 0.5 s (or less), which corresponds to vertically rigid structures. This response is consistent with the acceleration histories for the vertical component of those records, in which high-frequency content is more noticeable than in the horizontal components. The plots also show that the vertical pseudo-acceleration can even exceed 1g (Fig. 8a).
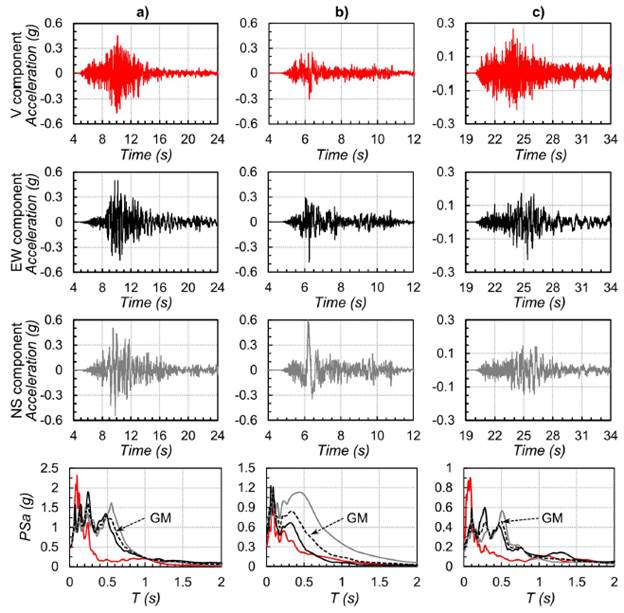
Source: The authors.
Fig. 8 Acceleration histories and pseudo-acceleration response spectra for the three components of records measured for events (a) #4 at CARME station, (b) #10 at CQUET station, and (c) #29 at CLEJA station.
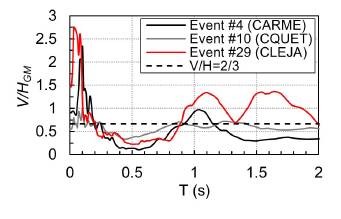
Fig. 9 presents the spectral V/H GM ratio for the three motions. The spectral V/H GM ratio was calculated for each motion by dividing the vertical PS A spectrum over the geometric mean of the PS A spectra of the horizontal components. By comparing the spectral V/H GM ratios of the three motions with V/H = 2/3, it can be concluded that the recommendation in NSR-10 is too low for structures with vertical periods shorter than 0.25 s. These periods may correspond to the first vertical mode shapes of short-span bridges with simply-supported or continuous superstructures or the first vertical periods in most buildings [27]. Moreover, as occurred for event #29 at CLEJA station, the V/HGM ratio can exceed 2/3 at periods longer than 1 s, which may be due to a local soft soil effect.
Conclusions
The main conclusions drawn from the results discussed in this paper are:
1) The peak ground acceleration of the vertical component (PGA V ) of the Colombian earthquakes is, in general, smaller than that of the horizontal components. On average, the PGA V is 0.6 times the PGA of the horizontal components. The vertical PGA increases as the epi-central distance decrease and can reach values ranging from 0.3g to 0.5g in sites closer to 20 km to the source during strong seismic events.
2) The PGA V and the V/H ratios had a slightly stronger linear relationship with the hypocentral distance (R hypo ) than to the epicentral distance or the moment magnitude (Mw). However, the linear relationships were weak, indicating that non-linear prediction equations must be used to relate those parameters.
3) Simplified models were proposed to estimate the vertical PGA based on the dataset selected in this study. In the first model, the PGA V is calculated as a function of an intercept, M w , and R hypo . Te large variability of the data resulted in a determination coefficient (R2) of approximately 0.5 for this model. Te other models provide relatively good estimations (R2 ~ 0.8) of the PGAv as a function of PGA of each horizontal component or the geometric mean of the PGA of the horizontal components.
4) The V/H ratio equal to 2/3 suggested as a minimum in NSR-10 was found appropriate to estimate the PGA V . This is supported by the results of the regression models mentioned above and by the fact that only 24% of the analyzed earthquake records showed V/H ratios larger than 2/3. Nonetheless, the NSR-10 recommendation is not acceptable to construct the entire vertical acceleration response spectrum based on the horizontal acceleration design spectrum. Tis is because the spectral V/H ratio changes substantially with the vertical stiffness of the structure (or its vertical period), and therefore a single value is not deemed appropriate. Further studies are required to develop functions of spectral V/H ratios that may be safer than the rule-of-thumb of V/H = 2/3.

