


 Inglés (pdf)
 Articulo en XML
 Referencias del artículo
 Enviar articulo por email
 Citado por SciELO
  Citado por Google
  Similares en
SciELO
Similares en
SciELO  Similares en Google
 Permalink
INTRODUCTION
Sugarcane is a raw material of great scientific and technological interest for the scientific community because it is a renewable energy source. Indeed, it is possible to obtain different products from their physical and chemical transformation. In [1], raw materials are used to produce sugar, ethanol, and electricity. Biorefineries could produce many products and use them as biomass from different sources. The decision to use a specific raw material for developing a product portfolio depends on the economic, environmental, and social aspects of the production processes. Currently, mathematical models are used to evaluate biorefineries for maximum economic benefits and, in some cases, reduction of the environmental impact.
In [2], an optimization model considering multiple production paths for a given product has been proposed. A simple structure for a biorefinery is presented in this work, and the flow of raw material for making different products is explained. The considered objective function is the maximization of the gross margin. [3] have used mixed-integer linear programming to optimize the set of products. Different paths to obtain a given product are considered. The main goal of the optimization problem is to decide how to maximize gross profit.
A mathematical model to maximize the net profit for a company that simultaneously produces sugar, ethanol, and electricity from two raw materials: sugar cane and sweet sorghum grass (product with similar characteristics of the sugar cane), has been developed by [4]. In the proposed model, the constraints are related to the maximum production capacity of the sugar, ethanol, and electricity; and the availability of land to grow the raw materials.
A mixed-integer linear programming model for a biorefinery that simultaneously produces ethanol, butane, succinic acid, and lactic acid has been considered by [5]. The proposed model is called Stakeholders Value (SKV) and is based on a given company's Free Cash Flow (FCF). In [6], an optimization model is proposed to maximize the economic benefit and minimize the environmental impact. In this paper, the optimal operation processes for a hydrocarbons biorefinery are addressed via fast pyrolysis and physical separation. A non-linear mathematical model is proposed by considering two objective functions: maximizing the net present value (NPV) and minimizing the global warming potential (GWP). An epsilon constraint scheme is proposed to optimize the proposed model [7]-[8]. A set of optimal Pareto solutions determines the solution scheme.
The paper's main contribution is the structure of the proposed approach considering two objective functions: maximization of the gross margin and minimization of the environmental impact. Indeed, no attempts have been proposed considering all these aspects. A multiobjective deterministic model (MODM) is proposed for the considered problem. Then, stochastic elements are introduced, such as the price and demand for the products. Therefore, a multiobjective stochastic model (MOSM) is obtained. This model is solved using the concept of Pareto dominance on a stochastic scenarios scheme. The proposed methodology has been evaluated on a real case Colombian company.
LITERATURE REVIEW
Although modern sugar mills have diversified their products, there is an opportunity to develop more products. For example, in Brazil, the concept of sugarcane biorefinery has been introduced as an opportunity to transform sugar mills. The model of a future biorefinery has been proposed in [9]. The future sugarcane biorefinery could produce substitutes for the oil and chemical industries with social, economic, and environmental benefits [9].
The sugarcane biorefinery of the future could produce substitutes for petroleum products such as polyethylene. It could provide high efficiency at low cost, due to the full potential of sugarcane biomass. The new possibilities for using sugarcane biomass require evaluating economic, social, and environmental aspects, prioritizing scientific and technological developments to implement new processes [10]. In Colombia, studies have been developed on the technical and economic evaluation of the application of biorefineries. The evaluated scenarios consider production of sugar, ethanol, electricity, polyhydroxybutyrate (PHB), and anthocyanins [11].
Bioplastics are chemical compounds of great interest in the chemical industry because they can be manufactured from renewable raw materials to replace petroleum-derived plastics, generating economic and environmental benefits [12]. The most investigated biopolymers are starch-derived thermoplastics (TPS), polylactides (PLA), PHB, and polyhydroxyalkanoate copolymers (PHAS). PHB is considered the strongest candidate for biopolymers because it is similar to synthetic polymers [13]. Polyhydroxybutyrate is a biodegradable polymer produced from renewable raw materials such as sugarcane and corn [14].
A characteristic of bioplastic is that its production process needs less energy than polyethylene and polypropylene production. Its chemical properties make it compatible with many human body tissues, expanding its uses in the future [15]. From an environmental point of view, PHB production is more convenient than plastics such as polypropylene because it has several environmental benefits [13]. An advantage of PHB is that it degrades quickly compared to conventional plastics, which could take up to 200 years. This property is related to its natural products resulting from the metabolism of microorganisms [16].
Integrating the PHB manufacturing process with the conventional production of sugar and ethanol represents a significant advantage in searching for environmental benefits. This is because the carbon dioxide generated in bagasse combustion does not exceed the carbon dioxide consumed by sugarcane in photosynthesis processes, which does not occur with fossil fuels [17].
Bioethanol is produced from raw materials containing fermentable sugars and beets. It is also produced from some polysaccharides that can be hydrolyzed to obtain sugars converted into alcohol. Sugarcane is the most used raw material for first-generation ethanol production in Brazil, India, and Colombia [18]. Starch is the primary polymer used for ethanol production in the United States [19]. First-generation biofuels such as bioethanol and biodiesel reduce CO2 emissions compared to emissions produced by fossil fuels. However, first-generation biofuels production's primary limitations are the supply of raw materials and the negative impact on biodiversity [20]. A disadvantage of first-generation biofuels is the competition for raw materials with food production. As an alternative to first-generation fuels, second-generation biofuels arise. These biofuels could be produced from biomass obtained from trees, agroforestry residues, pastures, and aquatic plants [21].
Lignocellulosic biomass is mainly composed of cellulose (36-61 %), hemicellulose (13-39%), and lignin (6-29 %) [18]. This biomass could be transformed into bioethanol through two routes: biochemistry and thermochemistry. Both ways involve the degradation of lignocellulose's structure in polysaccharides hydrolyzed into simple sugars (pentoses and hexoses) [22].
An alternative to second-generation ethanol is the integration with conventional first-generation ethanol. [23] suggested in their study a potential scenario to produce of cellulosic ethanol in Brazil. In this scenario, first-generation ethanol is produced with sugarcane, and bagasse and waste such as cane leaf is transformed into ethanol using hydrolysis and fermentation.
Ethanol produced from lignocellulosic raw material has become an essential biofuel in the United States and European countries. This situation is due to the growing demand for ethanol fuel and the need to use low-cost raw materials while avoiding direct and indirect competition with human and animal feed [24]. According to [18], the first-generation ethanol production process integrated with cane bagasse could deliver between 0.116 m3 and 0.122 m3 of ethanol for each ton of cane. Investigations in lignocellulosic ethanol are being developed worldwide. Companies such as Abengoa in Spain, Biogasol and Inbicon in Denmark, M&G in Italy, Porcethol in France, Praj Industries in India, Sekab in Sweden, and Novozymes Brazil are developing research projects to produce second-generation ethanol. These companies work on biochemical production technology, either with enzymatic hydrolysis or acid hydrolysis [24].
According to [25], it is essential to reduce the transformation costs for the second-generation ethanol production technology to be competitive. Future biorefineries could produce many products and use biomass from different sources as raw materials. The decision to use specific raw materials and develop a product portfolio depends on the economic, environmental, and social benefits of implementing the production processes. Currently, evaluations of raw materials, methods, and products in biorefineries design are carried out using optimization models, aiming to maximize economic benefits and, in some cases, reduce the environmental impact.
The strategic planning of integrated bioethanol-sugar supply chains (SC) under uncertainty has been considered [26]. A multi-scenario mixed-integer linear programming (MILP) problem to calculate the capacity expansions of the network's production and storage facilities over time, along with the associated planning decisions, is proposed. The capabilities of the proposed approaches are demonstrated in a real case of the Argentinean sugarcane industry. Finally, [27] present state-of-the-art optimization techniques and tools based on Life Cycle Analysis, focused on process engineering. A multiobjective optimization approach is used based on the s-constraint method for generating the Pareto set.
METHODOLOGY
The proposed approach considers two stages. First, a deterministic multiobjective mathematical model combining an optimization scheme based on epsilon constraint techniques is developed. Then, several variations of the parameters are calculated, and a multiobjective stochastic model is proposed using simulation and optimization approaches. In the following sections, each component is explained.
MULTIOBJECTIVE DETERMINISTIC MATHEMATICAL MODEL (MODM)
The MODM considers two objective functions: maximizing the gross margin and minimizing the environmental impact. Both objectives conflict and they are defined as follows.
GROSS PROFIT
The gross margin for a company indicates the proportionality of gross profit over the sales revenue.
For a company, the gross margin is the net sales revenue minus its cost of sold goods [28]. In other words, it is defined as the retained sales revenue after incurring the direct cost associated with the operation of a company (the process of selling products or providing services). A higher gross margin allows a company to cover other costs or satisfy debt obligations. Net sales are gross revenue, less returns, allowances, and discounts.
ENVIRONMENTAL IMPACT
The environmental impact is based on the methodology proposed by Institute of Chemical Engineers [29] given by (1):
Where EB i = Environmental load of the category i, W N = Quantity of the substance N emitted and PF UN = Potential factor of the substance N in the category i. A substance could have a different potential impact for different categories; for example, nitrogen dioxide (NO2) has an impact factor of 0.7 for the Air Acidification category, 40 for the Global Warming category, and 0.2 for the Eutrophication category. [30] proposed a methodology for calculating the environmental load of a process (2):
Where TEB = Total environmental load for a process (tons) and EB i = Environmental load for the category i (tons). Replacing EB i in (2), the equation for obtaining the total load for a process is obtained by (3):
DETERMINISTIC MATHEMATICAL MODEL
The multiobjective model considers the mass and energy balances for determining the process flows. Then, the sets, variables, objective functions, and constraints are defined. The solution of the mathematical model is performed by the epsilon-constraint method.
A determined quantity of sugar juice and bagasse of cane are obtained in the cane crushing process. The juice is transformed into sugar, and part of the bagasse is sent to the boiler as fuel. The cogeneration of electricity supplies steam and energy to sugar and ethanol production, and sugarcane crushing. The process of sugar production allows delivering sugary materials to obtain anhydrous ethanol. The surplus of produced energy, i.e., that which is not consumed in the production processes, is sold to the public network. The product obtained in the clarification stage of sugar syrup has two uses: i) production of sugar by crystallization and centrifugation and ii) ethanol production. After obtaining sugar, the product honey "b" is also directed to alcohol production. Sugar syrup and honey "b" contain fermentable sugars like sucrose, glucose, and fructose.
We have considered two new stages added to the current processes: PHB production and bagasse conversion into fermentable sugar. A portion of honey "b" is directed to produce PHB in the new proposed scheme. Bagasse leaving the mill is used: i) as fuel for the boiler, ii) for sales, iii) for startups, and iv) as raw material for converting into glucose. The glucose obtained by bagasse hydrolysis is sent to the ethanol production plant to be mixed with sugar syrup and honey "b."
MULTIOBJECTIVE DETERMINISTIC MODEL (MODM)
The MODM considers the following assumptions:
1) The production process is in a steady state.
2) There is no final inventory of sugar, ethanol, and PHB because all the products are sold.
3) The electrical power available for sale exceeds the quantity consumed in the production process.
4) The emission is measured at the border of each process without considering treatment to minimize or mitigate impacts in later stages (e.g., treatment plants wastewater).
5) Solid wastes are not included in the inventory of emissions.
Only emissions to the air and the water are considered. The notation for the MODM is the following:
Sets
The sets consider the products, impact environment the production process and the substances. We have considered a general set that could be adapted to any sugarcane company.
Products: Types of products indexed by j, where j = 1 (sugar), j = 2 (ethanol), j = 3 (energy), j = 4 (bagasse), j = 5 (PHB)
Impact Category: Category of the impact indexed by i, where i = 1 (atmospheric acidification), i = 2 (global warming), i = 3 (carcinogenic effect), i = 4 (stratospheric ozone depletion), i = 5 (formation of "Smog" photochemical), i = 6 (aquatic acidification), i = 7 (demand of chemical oxygen in water), i = 8 (aquatic ecotoxicity), i = 9 (eutrophication).
Process: Production process indexed by k, where k = 1 (production of sugar), k = 2 (production ethanol), k = 3 (cogeneration of energy and steam), k = 4 (transformation of bagasse), k = 5 (production of PHB).
Substance: Emitted substance of the process indexed by n, where = 1 (SO2), n = 2 (residual water), n = 3 (Acetic acid), n = 4 (Nitrogen), n = 5 (Phosphorus), n = 6 (Copper), n = 7 (Cadmium), n = 8 (Chromium), n = 9 (Nickel), n = 10 (Zinc), n = 11 (CO2), n = 12 (Stillage), n = 13 (Lactic acid), n = 14 (Chlorides), n = 15 (Fle-maza), n = 16 (Butyric acid), n = 17 (Propionic acid), n = 18 (Ethanol), n = 19 (Isobutanol), n = 20 (Amyl alcohol), n = 21 (Isoamyl Alcohol), n = 22 (Butanol), n = 23 (CO), n = 24 (NOX).
Parameters
The following parameters are related to the capacities, demands, production cost and different emissions related to each product.
CV j = Variable cost of the production process of the product j ($/units). The units for j = 1 ($/ton), j = 2 j = 3 ($/kWh), j = 4 ($/ ton bagasse), and j = 5 ($/ton).
Cf j = Fixed cost of the production process of the product j ($/month).
Cc = Cost of the sugar cane for the company ($/ton).
Cm = Cost of the conversion of sugar cane into syrup for making ethanol ($/ton).
P j = Sale price of the product j ($/unit).
Cap j = Capacity of production of the product j (j = 1 in ton/h, j = 2 in m3/h, j = 3 in kWh, j = 4 in ton/h and j = 5 in ton/h).
Cap v = Capacity of production of steam (ton/h).
Cap m = Capacity of cane crushing (ton/h).
Cap b = Capacity for obtaining ethanol from bagasse (ton/h).
Dem j = Demand of the product j (j = 1 in ton/ month, j = 2 in m3/month, j = 3 in kWh/ month, j = 4 in ton/month and j = 5 in ton/ month)
HourS j = Available hours for each month for the product j.
PF = Impact factor of the substance n in the category i.
W nj = Quantity of the substance n emitted in the process j (ton/ units of product)
Variables
The variables are related to the quantities of the products to be transformed between ethanol, sugar, PHB and energy. All these variables are continuous. Note that the production process is continuous.
Objective Functions
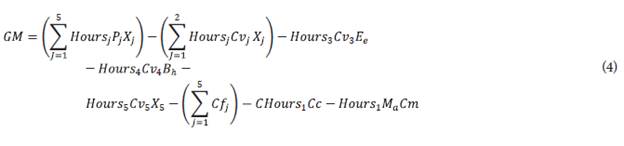
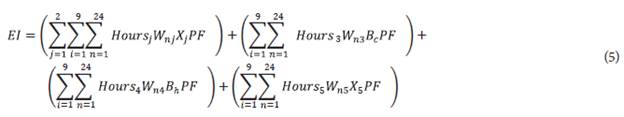
The objective functions are described by (4)-(5):
Maximization of Gross Margin (GM):
X j = Quantity of product j to be produced (i = 1 in ton /h, i = 2 ethanol in m3/h, i = 3 in kW, i = 4 in ton/h, i = 5 in ton/h)
C = Quantity of crushed sugar cane (ton/h)
M e = Quantity of purified sugar syrup for producing ethanol (ton/h)
V g = Quantity of steam to be generated in the boiler (ton/h)
E c = Quantity of electrical energy to be consumed in the process (kW)
E e = Quantity of electrical energy to be produced (kW)
B c = Quantity of bagasse to be considered in the boiler (ton/h)
B m = Quantity of bagasse in the mill (ton/h)
B a = Quantity of bagasse to be stored (ton /h)
B h = Quantity of bagasse to be transformed into glucose (ton/h)
M a = Quantity of syrup sugar to produce sugar (ton/h)
M e = Quantity of syrup sugar to produce ethanol (ton/h)
M b = Quantity of honey "b" to be produced (ton/h)
M be = Quantity of honey "b" to produce ethanol (ton/h)
M bp = Quantity of honey "b" to produce PHB (ton/h)


Nonnegative constraints

The objective function (4) considers the maximization of the Gross Margin calculated as follow: sales revenue of all the products minus the sum of the variable costs of production of sugar and ethanol, of the variable costs of generated energy, of the variable costs of the transformation of bagasse into glucose, of the variable costs of production of PHB, of the fixed costs, of the cost of the raw material and of the cost for transforming the cane into syrup cane. Te objective function (5) considers minimizing the environmental impact generated by sugar, ethanol, steam, energy, and PHB and transforming bagasse into glucose.
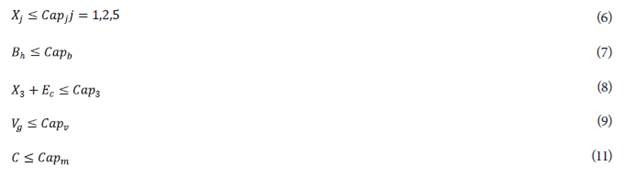
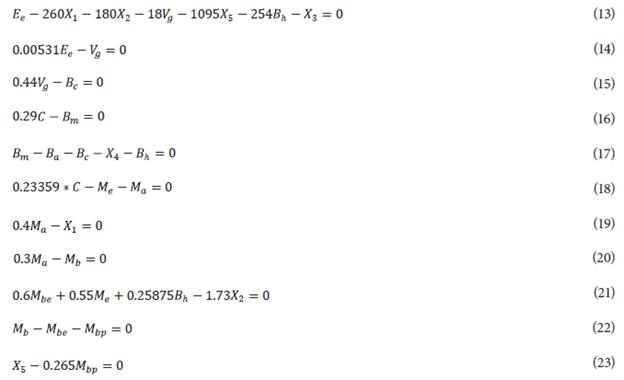
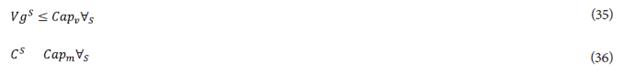
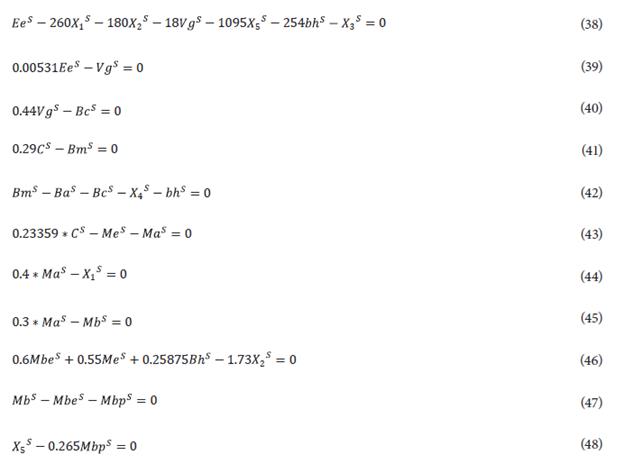
Constraints (6)-(11) are related to the capacity of the production processes for each considered product. Equations (12) allow satisfying the total demand for products of the company. Equations (13)- (23) corresponds to the balance of mass and energy for producing and generation of energy, steam, bagasse, cane syrup, sugar, honey "b," ethanol, and PHB. Equations (24) and (25) are related to the minimum generation of steam and bagasse. The minimum generation of steam is that required to supply the production processes of sugar, ethanol, PHB, and the transformation of bagasse. The minimum quantity of bagasse allows keeping the generation of steam and energy stable even when the cane is not crushed. Finally, equations (26) are the nonnegative constraints for the proposed model.
SOLUTION STRATEGY FOR THE MODM
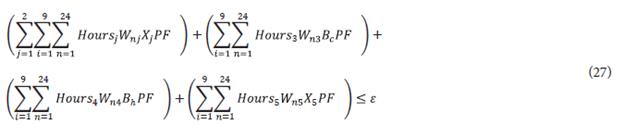
The solution scheme adopted for solving the MODM is the ε-constraint method studied in [31]- [33]. This method considers a set of optimal Pareto solutions found by considering the objective function (5) as a new constraint (27):
Where:

In particular, , λs is the environmental load corresponding to the maximum gross margin model found by the mathematical model considering only the objective function (4). On the other hand, λm corresponds to the environmental load obtained by the mathematical model considering only the objective function (5). Note that, for each value of e a set of optimal Pareto solutions are obtained.
Finally, stochastic elements (i.e., prices of products, demands, costs) are considered within the MODM obtaining an MOSM.
GENERAL FRAMEWORK OF THE MULTIOBJECTIVE STOCHASTIC MODEL (MOSM)
The mathematical model MODM considers the average values of the parameters for each product. However, we have evaluated the statistical performance of the following parameters' behavior to consider realistic aspects into a MOSM: Demand of Electricity, Demand of Sugar, Demand of Ethanol, Price of Electricity, Price of Sugar and Price of Ethanol (source obtained from company case study).
The formulation of the deterministic model has been modified to take into account scenarios by considering the uncertainty of the established parameters. The methodology used to generate scenarios is based on the idea introduced by [34], [35], and [36].
Variables and parameters used in the MODM have been modified by adding a new index (set) for each scenario s. For example, in the MODM the variables and parameters Xj (amount of product j), P } (Price of product j) and Denij (demand of product j) are replaced by the following variables in the formulation of the MOSM: Xsj = amount of product j in the scenario s, Psj = Price of the product j in the scenario s, and Demsj = demand of the product j in the scenario s.
MULTIOBJECTIVE STOCHASTIC MODEL (MOSM)
The objective function considers a valid optimization of the sum of the probability of the scenarios, which must be equal to 1. Therefore, the sum of the probability for all the scenarios must satisfy the equation (29):
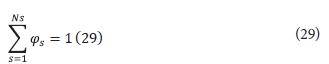
Where φs is the probability of the scenario s and N s is the number of scenarios. In the proposed MOSM three scenarios are considered by the methodology proposed in [31]:
■ Worst scenario: The value of demands and prices of sugar, ethanol and energy obtains the lowest value.
■ Average scenario: The value of demands and prices of sugar, ethanol and energy acquires the average value, i.e., the values of the deterministic model (MODM).
■ Best scenario: The value of demands and prices of sugar, ethanol and energy acquires the higher value of the parameters.
The probability for each scenario and φ
1
 (Worstscenario),
 (Averagescenario) and
 (Bestscenario) is obtained by considering a beta distribution probability. This distribution is commonly used to model the probability of scenarios [37]. The density function probability beta has positive skewness representing the three scenarios: Worst (a), Average (m) and Best (b), with a higher probability of occurrence of the average scenario (2/3) than the worst and the best scenarios (1/6 for each one) [38].
The values of the demands and prices of sugar, energy, and ethanol are obtained by considering the confidence interval. In particular, the lower limit of the interval for each parameter is equal to the worst scenario's value. The upper limit of the interval is equivalent to the best scenario, and the average values correspond to the values for the average scenario. The confidence interval is calculated by (30).
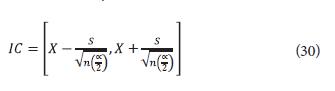
Where X = mean, s = standard deviation of the sample, ∝ = level of rejection for a confidence level of 95%, α = 5%, n = number of data.
The notation for the MOSM is describe below. This describes only the additional and changed sets and parameters from the previously described.
Additional sets
Scenarios = types of scenarios indexed by s, where s = 1 (worst), s = 2 (average), s = 3 (best).
Changed Variables
Xsj = Quantity of product j to be produced for the scenario s (i = 1 in ton /h, i = 2 ethanol in m3/h, i = 3 in kW, i = 4 in ton/h, i = 5 in ton/h)
C s = Quantity of crushed sugar cane in the scenario s (ton/h)
M s e = Quantity of purified sugar syrup for producing ethanol in the scenario s (ton/h)
V s g = Quantity of steam to be generated in the boiler in the scenario s (ton/h)
E 5 C = Quantity of electrical energy to be consumed in the process in the scenario s (kW)
E s e = Quantity of electrical energy to be produced in the scenario s (kW)
B s c = Quantity of bagasse to be considered in the boiler in the scenario s (ton/h)
B s m = Quantity of bagasse in the mill in the scenario s (ton/h)
B s a = Quantity of bagasse to be stored in the scenario s (ton /h)
B s h = Quantity of bagasse to be transformed into glucose in the scenario s (ton/h)
M s a = Quantity of syrup sugar to produce sugar in the scenario s (ton/h)
M s e = Quantity of syrup sugar to produce ethanol in the scenario s (ton/h)
M s b = Quantity of honey "b" to be produced in the scenario s (ton/h)
M s be = Quantity of honey "b" to produce ethanol in the scenario s (ton/h)
M s bp = Quantity of honey "b" to produce PHB in the scenario s (ton/h)
Note that all the described variables in above. are changed by adding them the subindex s.
Objective Function
Subject to
■ Capacity constraints
■ Demand constraints

■ Balance constraints
■ Minimum generation of steam

■ Minimum generation of bagasse

■ Nonnegative constraints

■ Parametric environmental load constraint
Where:

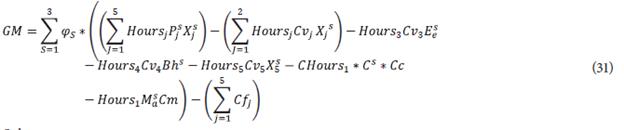
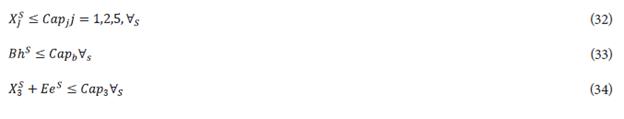
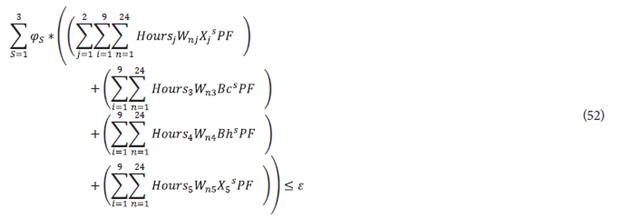
The stochastic objective function (31) considers the average value of the gross margin considering the three different scenarios. Note that constraints (32)-(51) are similar to those described above by (6)-(26). All these constraints consider the additional set of scenarios keeping the above description of their use for the considered problem. Finally, constraints (52) and (53) describe the average value of the objective function (5) by considering scenarios, and the epsilon constraint limits ([39]-[41]), respectively.
RESULTS AND DISCUSSION
The proposed multiobjective optimization scheme has been solved by using CPLEX 12.3. In the used real-world case, the computing time of the proposed scheme is irrelevant to be considered a support decision tool for a long-term period.
SOLUTION OF THE MODM
The optimization scheme for the MODM is performed by varying the value of parameter V of the environmental load constraint between the range (34.856, 39.980) and by determining optimal values of the gross margin for each given value of "s." The range of "s" is obtained from the minimum and maximum values of the allowed environmental impact. The multiobjective deterministic scheme consists of finding a solution considering the same fill rate for each objective. The fill rate for each objective is calculated by (54) and (55).
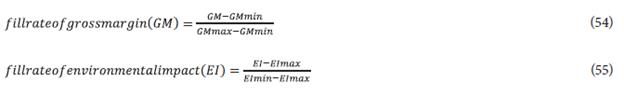
GMmin and EImin are the minimum values of the Gross Margin and the Environmental Impact, respectively. GMmax and GMmin are the maximum values of the both objective functions. Finally, GM and EI are the values for each evaluated fill rate point.
The best solution satisfying the criterion of equal fill rate to the considered objectives (GM and EI) in the MODM is: environmental impact of 37.230 ton/month and a gross margin of $ 20,304,030,737 per month. Table 1 shows the result to the problem of maximizing gross margin and minimizing the environmental impact for the production of sugar, energy, ethanol and PHB, i.e., the solution of MODM.
Table 1 Optimal Solution of the MODM
| Variable | Units | Optimal Value |
|---|---|---|
| X1 | ton/h | 31.8 |
| X2 | m3/h | 11.4 |
| X3 | kW | 12384 |
| X4 | ton/h | 34.5 |
| X5 | ton/h | 3.6 |
| C | ton/h | 445.6 |
| Ee | kW | 29461 |
| Ec | kW | 17077 |
| Vg | ton/h | 156.4 |
| Bm | ton/h | 129.2 |
| Bc | ton/h | 68.8 |
| Ba | ton/h | 25.8 |
| Bh | ton/h | 0.0 |
| Ma | ton/h | 79.6 |
| Me | ton/h | 24.5 |
| Mb | ton/h | 23.9 |
| Mbe | ton/h | 10.3 |
| Mbp | ton/h | 13.6 |
Source: Own elaboration
Te composition of the environmental load by category is the following:
■ Air acidification: 17.9 tons of SO2 equivalent per month
■ Photochemical smog: 32.2 tons of ethylene per month
■ Aquatic demand: 4009.2 tons of oxygen per month
■ Eutrophication: 461.3 tons of phosphate per month
■ Aquatic acidification: 4.0 tons of H+ ion per month
■ Aquatic ecotoxicity: 31.8 tons of copper per month
■ Global warming: 32673.6 tons of CO2
SOLUTION OF THE MOSM
We have considered these parameters' historical data for January 2010 and June 2018 to establish the probability distribution function using Stat Fit Software. Table 2 shows the distribution function providing the best-fit parameters for the considered parameters. The stochastic approach best represents the problem because it considers the variability and enables a better decision-making process.
Table 3 shows the optimal solution of the MOSM for each scenario by considering the epsilon constraint method. The higher gross margin is obtained in the best scenario, but an environmental impact is also generated. In the best scenarios, the product prices and the demands are higher than the other scenarios by improving the gross margin and increasing the emissions of environmental load.
Table 3 Solution of the MOSM for each scenario
| Objective Function | Units | Worst Scenario | Average Scenario | Best Scenario |
|---|---|---|---|---|
| Gross margin | $/month | 15.474.075.117 (29.3% of sales) | 20.304.030.737 (34.7% of sales) | 25.478.087.205 (39.5% of sales) |
| Environmental Impact | Ton/month | 36200 | 37230 | 38310 |
Source: Own elaboration
The results of the variables for each scenario are shown in Table 4. Note that sugar production is increased when its price is higher, and the production of PHB is the same in all three scenarios since this product improves the gross margin due to its high price. In all three scenarios, the bagasse is used to produce glucose because the demand for ethanol is covered with the produced honey with sugar cane. The payoff matrix for each scenario is described in Table 6.
Table 4 Optimal solution of the MOSM
| Variable | Units | Worst Scenario | Average Scenario | Best Scenario |
|---|---|---|---|---|
| X1 | t/h | 26.9 | 31.8 | 33.0 |
| X2 | m3/h | 13.0 | 11.4 | 11.8 |
| X3 | kW | 11361 | 12384 | 12853 |
| X4 | t/h | 36.9 | 34.5 | 35.6 |
| X5 | t/h | 3.6 | 3.6 | 3.6 |
| C | t/h | 385.3 | 445.6 | 459.5 |
| Ee | kW | 27240 | 29461 | 30396 |
| Ec | kW | 15879 | 17077 | 17543 |
| Vg | t/h | 144.6 | 156.4 | 161.4 |
| Bm | t/h | 125.3 | 129.2 | 133.3 |
| Bc | t/h | 63.6 | 68.8 | 71.0 |
| Ba | t/h | 25.1 | 25.8 | 26.7 |
| Bh | t/h | 0 | 0 | 0 |
| Ma | t/h | 67.2 | 79.6 | 82.5 |
| Me | t/h | 33.7 | 24.5 | 24.9 |
| Mb | t/h | 20.2 | 23.9 | 24.7 |
| Mbe | t/h | 6.6 | 10.3 | 11.2 |
| Mbp | t/h | 13.6 | 13.6 | 13.6 |
Source: Own elaboration
Finally, Table 5 shows the comparison of the results obtained by the MODM and the MOSM. The gross margin for the MOSM is higher than the value obtained for the MODM by 0.3%. Besides, the environmental impact is also higher by 0.02% in the stochastic model. These results show that evaluating the multiobjective model by using the confidence intervals and the probability of occurrence of the scenarios according to beta distribution gives similar results for both models. Finally, Table 5 shows the payoff matrix for each scenario. To our knowledge, no similar works has proposed this comparison for sugarcane companies.
Table 5 Results of the MODM and MOSM
| Objective Function | Units | MODM | MOSM I |
|---|---|---|---|
| Gross margin | $/month | 20.304.030.737 | 20.361.380.878 |
| (34.7% of sales) | (34.7% of sales) | ||
| Environmental Impact | t/month | 37230 | 37238 |
Source: Own elaboration
Table 3 Probability distribution function
| Variables | Variables Probability Function | Parameters of the function | Best Fit Result | Graphic |
|---|---|---|---|---|
| Demand For Electricity | Johnson SB | minimum = 4.7859e+006 lamda = 7.89507e+006 gamma = 0.862535 delta = 1.69522 | Kolmogorov-Smirnov data points 42 ks stat 8.3e-002 alpha 5.e-002 ks stat(42,5.e-002) 0.205 p-value 0.911 result DO NOT REJECT |
|
| Demand of Sugar | Weibull | minimum = 14655 [fixed] alpha = 1.7403 beta = 3835.62 | Kolmogorov-Smirnov data points 42 ks stat 9.25e-002 alpha 5.e-002 ks stat (42,5.e-002) 0.205 p-value 0.833 result DO NOT REJECT |
|
| Demand of Ethanol | Weibull | minimum = 6.954e+006 alpha = 2.148 beta =626849 | Kolmogorov-Smirnov data points 42 ks stat 7.72e-002 alpha 5.e-002 ks stat(42,5.e-002) 0.205 p-value 0.947 result DO NOT REJECT |
|
| Price of Electricity | Triangular | minimum = 133. [fixed] maximum = 141.441 mode = 139.632 | Kolmogorov-Smirnov data points 42 ks stat 7.73e-002 alpha 5.e-002 ks stat(42,5.e-002) 0.205 p-value 0.947 result DO NOT REJECT |
|
| Price of Sugar | Johnson SB | minimum = 920174 [fixed] lamda = 672952 gamma = 0.353944 delta = 0.896862 | Kolmogorov-Smirnov data points 42 ks stat 9.03e-002 alpha 5.e-002 ks stat(42,5.e-002) 0.205 p-value 0.853 result DO NOT REJECT |
|
| Price of Ethanol | Power Function | minimum = 6824. [fixed] maximum = 8817.48 alpha = 1.33379 | Kolmogorov-Smirnov data points 38 ks stat 8.34e-002 alpha 5.e-002 ks stat(38,5.e-002) 0.215 p-value 0.934 result DO NOT REJECT |
|
Source: Own elaboration
Table 6 Payoff matrix for each scenario
| Worst Scenario | Average Scenario | Best Scenario | |||||||
|---|---|---|---|---|---|---|---|---|---|
| Gross Margin ($/month) | Environmental Load (ton/m) | Products | Gross Margin ($/month) | Environmental Load (ton/m) | Products | Gross Margin ($/month) | Environmental Load (Ton/m) | Products | |
| Maximization of the Gross Margin | 17.109.594.161 (30.1% of sales) | 39980 | Sugar 33.3 t/h | 21.768.093.894 (35.4% of sales) | 39980 | Sugar 33.3 t/h | 26.351.926.009 (40% of sales) | 40100 | Sugar 35.0 t/h |
| Ethanol 13.0 m3/h | Ethanol 13.0 m3/h | Ethanol 11.8 m3/h | |||||||
| Electricity 11263 kW | Electricity 11263 kW | Electricity 12364 kW | |||||||
| Bagasse 24.2 t/h | Bagasse 24.2 t/h | Bagasse 24.2 t/h | |||||||
| PHB 3.6 t/h | PHB 3.6 t/h | PHB 3.6 t/h | |||||||
| Minimization of the Environmental Load | 13.752.322.379 (28.6% of sales) | 32631 | Sugar 24.3 t/h | 18.611.482.809 (34.0 % of sales) | 34856 | Sugar 27.3 t/h | 24.211.741.502 (39% of sales) | 37085 | Sugar 30.3 t/h |
| Ethanol 11.0 m3/h | Ethanol 11.4 m3/h | Ethanol 11.8 m3/h | |||||||
| Electricity 10061 kW | Electricity 11212 kW | Electricity 12364 kW | |||||||
| Bagasse 31.9 t/h | Bagasse 33.0 t/h | Bagasse 34.2 t/h | |||||||
| PHB 3.6 t/h | PHB 3.6 t/h | PHB 3.6 t/h | |||||||
Source: Own elaboration
CONCLUSIONS
We propose an effective multiobjective stochastic optimization scheme for sugar, bioethanol, bio-plastics, and electricity production planning for a Colombian sugarcane company. In this approach, two mathematical models are proposed. The first model considers the formulation of a multiobjective deterministic model (MODM) by considering two objective functions: maximizing the gross margin and minimizing the environmental impact. A set of three scenarios then considers a stochastic version of the MODM, so the MOSM is obtained. The proposed scheme considers stochastic elements such as prices of products, demands, and costs. A case study's computational results based on the Colombian sugarcane industry show the proposed scheme's effectiveness. The results suggest that the proposed framework could be applied to other real problems for different sectors.
As future works, we consider that other stochastic methods such as the Sample Average Approximation could be considered to deal with the uncertainty [42]-[45]. Other multiobjective approaches could be applied to verify the efficiency of the proposed approach [46]-[47]. Finally, decisions related to the scheduling of the production planning must be considered within the proposed scheme.

