


 Inglés (pdf)
 Articulo en XML
 Referencias del artículo
 Enviar articulo por email
 Citado por SciELO
  Citado por Google
  Similares en
SciELO
Similares en
SciELO  Similares en Google
 Permalink
Introduction
A fragmented Health System (HS) has shortcomings due to access difficulties, inequity, intermittent care, and not meeting the needs of users [1] - [3]. The literature reports collaboration policies between health service providers (HSP). Thus, the system's efficiency and continuity of care can be improved [4] - [5]. Integrated HS networks in Brazil, Chile, Costa Rica, and Cuba have produced satisfactory experiences [6]. The National Health System was reorganized in Colombia in the 1990s [7]. The government can establish health, complexity, and institutional responsibilities to provide the use of the HS, particularly in emergencies [8]. The Departmental Secretariat of Health of Valle del Cauca (SDSVC) must adopt and apply norms and programs to articulate HS providers. The following are considered providers: hospitals, national state enterprises (NSES), and primary health care (PHC) [9].
The NSES of Valle, in their optimization process, decreased health promoters and nurses and closed centers and health posts [10]. In addition, Valle needs more resources for its facilities. Therefore, the provision of hospital services in urban areas contributes to the fragmentation of services [4]. A model of care based on limiting spending lowers the quality of care, and high competitiveness increases the cost of quality of life [11]. Currently, the public network of HS providers in Valle del Cauca has 59 institutions, with 56 NSEs and three hospitals. The provision of services is segmented by geographical regions where the population's social, cultural, and economic characteristics are similar.
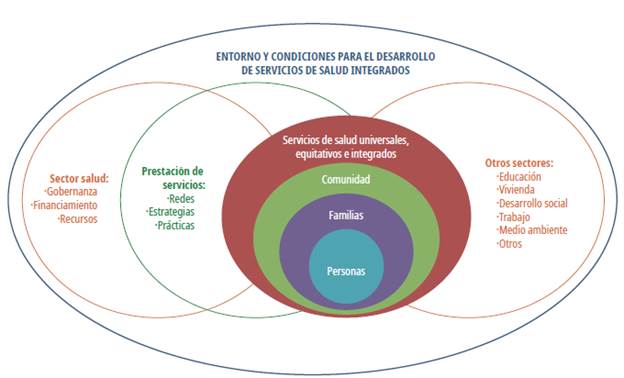
Source: WHO CHSN Document [6]
Figure 1 Environment and conditions for the development of integrated HS
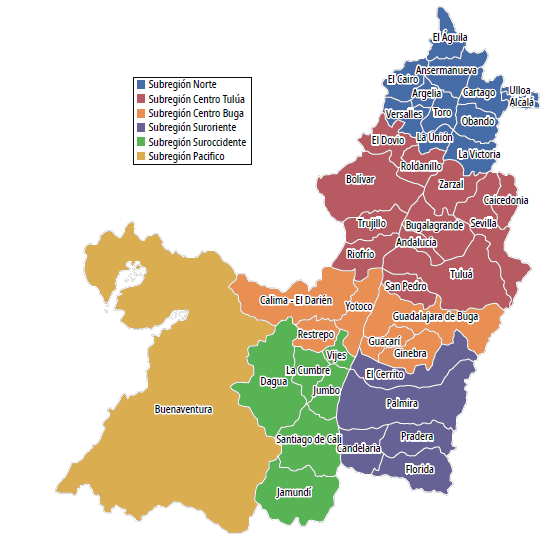
The 56 institutions at high risk increased to 83%, from 8 in 2011 to 13 in 2012. In addition, 63% of the NSES are categorized as medium risk, from 6 in 2011 to 11 the following year [12]. Regarding low complexity centers, of 33 institutions without risk, five became high-risk, five became medium-risk, five became low-risk, and only 18 remained without risk [12]. Once the calculation for 2013 had been performed for all institutions, financial deterioration occurred. In 2012, the Hospital Universitario del Valle (HUV) went from medium to high risk. Three medium-complex NSEs were the same: Mario Correa Rengifo, San Antonio de Roldanillo, and San Rafael de Zarzal [12]. SDSVC should identify the current situation of HS in each zone. The design should incorporate low-complexity services for all citizens at work, school, home, and region. In addition, the services of high, medium, and low complexity performed by NSEs must maintain a long-term financial balance [8]. The extension of the valley and subregions is worth noting, as shown in Figure 2.
Generally, decisions related to the Health Network Design are performed by intuitive methods based on the experience of the managers. Therefore, the executed decisions are far from reality, making sub-optimal solutions to the general problem. Therefore, this work proposes a multiobjective mathematical model to contribute to more informed decision-making within the Colombian context. Given its demographic index and geographic complexity, the SDSVC is considered relevant at the country level. The paper presents a relevant literature review of the case study, considering the concepts of HS, mathematical and stochastic models, and how to model the localization of HS. In the third section, the multiobjective model developed is presented. The fourth section considers the validation and results of the model, which leads to the conclusions of this exploratory study.
Literature review
The concept of the HS networks is reported by [13] and [14]. However, since complex systems are considered, there has yet to be a consensus on their scope [15]. However, structural problems limit the development of health technology and research [16]. A structured pluralism is established by law for the administrators of benefit plans with financing to organize, manage suppliers, and attend to affiliates [17].
Literature and public health policies show a need for comprehensive health service networks (CHSNS). Therefore, there are proposals for reorganizing networks to minimize access and care problems and discontinuity of care processes [6]. Besides, consistent services are sought, reducing the population's expectations and coordinating between the different levels and care points to have resolution capacity at the first level of care [13].
The organizational structure and management of the CHSNS are highly complex [18]. It must safeguard the guidelines to provide access, continuity, and coordination of user care from PHC to specialized units. Therefore, it is required that the network responds to the health needs of a population circumscribed to a specific geographical area and epidemiological profile to objectively evaluate the risk(s) of disease(s).
Multiobjective and stochastic mathematical models
Stochastic programming provides a practical framework to address decisions on problems with high uncertainty for various fields of knowledge [19] - [20]. In this context, contingencies are incorporated based on the input data; robust software and scalable and efficient solutions are required [21].
Defining a network requires mathematical programming [22] - [23]. However, given the characteristics of the problem, techniques based on complex multiobjective system mathematical programming (MOMP) are required since there are several criteria, and there is not only a single solution to find the global optimum for the considered objectives [24].
MOMP is classified into three categories according to the level of decision [25] - [26]: a priori, interactive, and generation methods. The multi-criteria decision-making stage includes updating the solutions and selecting a design alternative. In addition, analyzing a Pareto front of 4 or more objectives requires a multidimensional analysis of solutions [27] - [28].
Modeling of the location of medical services for large-scale emergencies
The literature formulates and solves various location problems [29] - [30]. However, published works consider particularities for the case of a large-scale emergency [31]. An emergency scenario requires modifying the definition of the coverage facility by incorporating redundancy and referral of services to other facilities in the affected areas. The priority of one solution must be monitored [32] - [33]. Another aspect is identifying nearby feasible areas for grouping against a need.
For the location models, three essential elements are distinguished: facilities considered the objects to be located to provide services or products; locations, which are the set of candidate points for the sites of the facilities; and customers, who demand a specific service or product [34]. The most basic location problem considers only one installation, and the problem is classified as deterministic and static. Generally, the transportation cost and the point volume are the only determining factors [35] - [36].
In the median p problem, the location is determined by minimizing the distance traveled between each node's "demand weights" and the facilities [37]. The literature reports cases of success applying techniques based on p measurements for location [38] - [44]. [45] propose two new formulations for the p median problem. The authors consider an exact and approximate mode called BEAMR and condensed Balinski constraints reducing the number of variables. Finally, the location issue with p-median models has been extended to studies based on dynamic model scenarios, where demand is a time-dependent variable, and studies of the uncertainty associated with future events [41] - [42].
An HS seeks to meet all demands within a specific time window. The literature distinguishes two types of problems: the coverage location and the maximum coverage problem [46]. The strategic nature of location problems requires incorporating uncertainty. One solution technique uses dynamic location models, where the network facilities' location varies over time. In this sense, it is not a question of selecting robust areas meeting the changes demand, expansion time of the facilities, and the predisposition of the network in the long term.
Dynamic location models could be classified into the following categories: single installation, multiple installations, multiobjective and stochastic models [47]. [48] proposes modeling and solving a system with exact models and analyzing multicriteria techniques. Besides, [46] proposes mathematical modeling and their solutions with detailed models and scenario planning analysis. Additionally, a sensitivity analysis is performed by changing the inputs of the published model.
Proposed multiobjective mathematical model
The multiobjective mathematical model (MMPMO) seeks to characterize the public network of Valle del Cauca. Thus, we identify the distribution of services by the municipality to minimize the cost and maximize the coverage. The opening of services is suggested according to the complexity level concerning the demand and patient transportation between institutions. We have used a multiobjective methodology due to the problem of considering two objectives in conflict (cost and coverage).
Characteristics and assumptions
The following characteristics and assumptions are established, described as follows:
■ The network of HS providers in Valle del Cauca comprises geographical areas. It has second and third-level hospitals as the central nodes in the intermediate cities of the department. The model seeks to maximize installed capacity and access to technology and qualified personnel and to distribute services of greater complexity to medium towns.
■ The model is determined by something other than the installed capacity or the services currently enabled for each hospital. Instead, the allocation of each service depends on the factors of demand, opening costs, care, and transport of patients (referrals).
■ The costs of opening a service include qualified personnel, biomedical equipment, investment in infrastructure, and whether the hospital un-der-investment has the installed capacity.
■ The model considers a fixed cost for opening and involves the minimum investment to operate. In addition, it adjusts to the standards of infrastructure and equipment provision.
■ The transportation cost between hospitals in rural areas is based on the approximate distance from each municipal centroid. Also, the distance traveled fee, the operating cost of an ambulance and the approximate consumption of fuel, and the payment of tolls, are added.
■ The cost of biomedical equipment is consolidated with data from project quotes from the Government Programs and Projects Bank, consultations via email to suppliers, and prices in e-commerce.
■ Infrastructure costs are estimated with unit work prices published by the Government's Bank of Programs and Projects. They correspond to the definition of a standard value per square meter.
■ The estimated costs of qualified personnel correspond to the average salary of the health sector.
■ The demand data are calculated according to the region's reports of the Information System of the Health Providers.
■ The model considers intramural health services: outpatient and hospital care performed in the same health structure.
■ The model assumes that all hospitals have an ambulance service for transfers.
■ The planning horizon of the model is one year.
■ Patients demanding health services are assumed to go to the nearest hospital initially. Therefore, the variable determining the demand for patients corresponds to the number of patients requiring the services at hospital h, where the hospital h is the municipal seat associated with the patient.
Parameters
■ CostOpening sh = Opening cost of the standard service s ∈ S in the hospital h ∈ H (including implementation and purchase of biomedical equipment).
■ CostReferral hh' = Referring cost of a patient by transportation from hospital h ∈ H to hospital h, ∈ H, where h ≠ h,.
■ CostCare sh = Treating cost of a patient with the service type s ∈ S in hospital h ∈ H (including hospital supplies).
■ MinService sh = Minimum demand to provide different types of services s ∈ S at hospital h ∈ H (minimum number of services that must be guaranteed)
■ MaxPatient sh = Maximum monthly capacity of patients to be treated with service type s ∈ S in hospital h ∈ H.
■ MinPatient sh = Minimum monthly capacity of patients to be treated with service type s ∈ S in hospital h ∈ H.
■ DemPatients sh = Monthly demand of patients for the type service s ∈ S in the hospital h ∈ H.
Decision variables
◾ W
sh
=
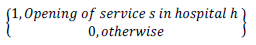
◾ A sh = Integer variable indicating the number of patients treated with the service s in hospital h ∈ H.
◾ R hh’s = Integer variable indicating the number of transferred patients from hospital h ∈ H to hospital h’ ∈ H for service s ∈ S.
Constraints
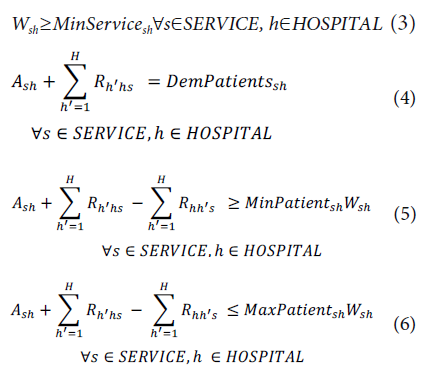
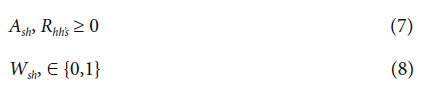
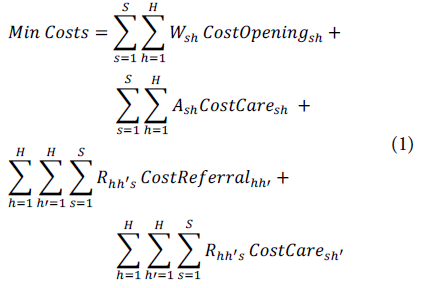
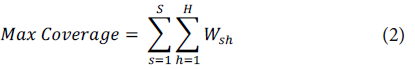
Equation (1) considers the objective function (OF) to minimize the operating costs of the HS, with the costs of opening services, transfer, and patient care. Equation (2) considers the opening of the most significant number of services for a given region to favor the HS coverage. In addition, low-complexity services should be provided for each region (Equation (3)). Constraint (4) seeks to care for patients arriving, those who have been referred, and those who have been transferred. Equation (5) shows that the optimal solution represents an efficient and viable path for the hospitals of the public network, which forces the model to open services whose cost is sustainable according to the demand of patients. Constraint (6) guarantees patient care according to the installed capacity of each hospital, ensuring that the sum of patients transferred and treated does not exceed the response capacity of each service per hospital. Finally, constraints (7) and (8) guarantee the integrality of the model's variables.
Obtained results
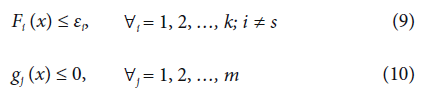
The volume of information handled determines the prioritization of 9 hospitals and 34 services. The model is coded in CPLEX in the C ++ environment. It is run on a computer with a 500 GB hard disk, 4 GB RAM, and a 64-bit processor at 2.10 GHZ. The parameter CostReferral hh is increased with a variable M to adjust the actual cost and the patient's risk when transported without being stabilized. The model converges satisfactorily, and the points of the Pareto front are sought through epsilon restrictions. Thus, the dominant points and the Pareto set are determined [49]. The general formulation of the method for x ∈ E n minimizes F s (X), subject to Equations (9) and (10).
The OF for maximizing coverage is considered a constraint. Thus, the minimum cost of the network is obtained and yields a coefficient of performance (COP) of 1.55989e+11. Next, the OF for minimizing costs is entered as a restriction and is limited to the maximum value found in the previous step, 1.55989e+11 COP. Then, the model considers the OF to maximize coverage, which provides 40 open services.
The Pareto set can be identified when the points are plotted, as described in Figure 3.
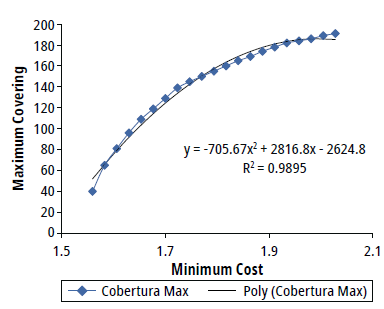
Finally, to determine the optimal solution, the MinMax methodology is applied, which seeks to find an equidistant point between all the Pareto points and obeys Eq. (11), where each OF is shown in Table 1[50].
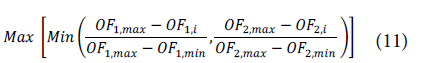
where:
OF 1,max : Maximum value of objective function 1
OF 1,min : Minimumvalue ofobjectivefunction 1
OF 2, max : Maximumvalueofobjectivefunction 2
OF 2, max : Minimumvalue ofobjectivefunction 2
OF 1,t : Value of objective function 1 in te solution i
OF 2, min : Value of objective function 2 in te solution i
A point is chosen from the table to find the equidistant point, according to Equation (12).
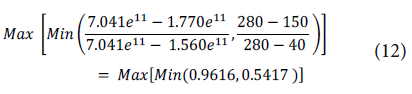
This value is multiplied by the maximum of the Pareto set to obtain the following points that correspond to the best solution of all the dominant points, defined as:
■ Minimum Cost of the Hospital Network: 0.9616 x 2.028e11 = 1.950 e11 COP
■ Maximum Coverage of the Hospital Network: 0.5417 x 191 = 103
For the recorded and obtained data, with their different assumptions, the above points are the most balanced for the two OFS.
From a social perspective, the best solution has more excellent coverage. Therefore, the closest result to the equivalent solution is obtained in iteration 5, where the open services number 109 at a budget increase of only 6%.
Also, we have studied scenarios by considering the uncertainty of patients' monthly demand values. According to historical data, we observed that the demand could vary monthly. This situation allowed generation demand scenarios (sensitivity analysis). The methodology used to generate scenarios is based on the idea introduced by [51]. The parameter of the demand has been modified for each scenario. In particular, we have considered three scenarios executing three times the proposed approach. The description of the scenarios is the following:
■ Worst Scenario (WS): the value of demands is set to the higher value parameters. In this case, the Cost objective obtains the worse results.
■ Average Scenario (AS): The demand value is set to the average value of patients monthly. These results are the basis of the optimal Pareto solution (Table 1).
■ Best Scenario (BS): the value of demands obtains their lowest value. In this case, the Coverage objective obtains the worse results.
Table 1 First 5 iterations to the equidistant point
| Iteration | % Increase | OF Min cost x e11 | OF Max Coverage |
|---|---|---|---|
| 1 | 0 | 1.55989 | 40 |
| 2 | 1.5 | 1.58329 | 65 |
| 3 | 3 | 1.60669 | 81 |
| 4 | 4.5 | 1.63009 | 96 |
| 5 | 6 | 1.65348 | 109 |
Source: Authors
The values of the demands are obtained by considering the confidence interval within a normal distribution. In particular, the lower limit of the interval for each parameter is equal to the worst scenario's value. The upper limit of the interval is equivalent to the best scenario, and the average values correspond to the values for the average scenario. Note that we have used a weighted method for generating the sensitivity analysis. In particular, we have varied the values of W 1 (weight of the cost function) and W2 (weight of the coverage function). Note that W 1 and W2 define the importance of the objective function. Table 2 shows the obtained results for the considered scenarios.
Table 2 Obtained results for the considered scenarios
| Scenarios | W 1(%) | W2 (%) | Cost (COP x e11) | Coverage |
|---|---|---|---|---|
| WS | 0.0 - 2.0 | 100.0 - 98.0 | 1.42122 | 36 |
| 2.0 - 2.7 | 98.0 - 97.3 | 1.54038 | 39 | |
| 2.7 - 4.0 | 97.3 - 96.0 | 1.45870 | 40 | |
| 4.0 - 40.0 | 96.0 - 60.0 | 1.41662 | 36 | |
| 40.0 - 60.0 | 60.0 - 40.0 | 1.44727 | 36 | |
| 60.0 - 100.0 | 40.0 - 0.0 | 1.41168 | 35 | |
| AS | 0.0 - 2.0 | 100.0 - 98.0 | 1.59002 | 49 |
| 2.0 - 2.7 | 98.0 - 97.3 | 1.59277 | 99 | |
| 2.7 - 4.0 | 97.3 - 96.0 | 1.64662 | 53 | |
| 4.0 - 40.0 | 96.0 - 60.0 | 1.58652 | 89 | |
| 40.0 - 60.0 | 60.0 - 40.0 | 1.61769 | 102 | |
| 60.0 - 100.0 | 40.0 - 0.0 | 1.60842 | 76 | |
| BS | 0.0 - 2.0 | 100.0 - 98.0 | 1.73078 | 124 |
| 2.0 - 2.7 | 98.0 - 97.3 | 1.89513 | 117 | |
| 2.7 - 4.0 | 97.3 - 96.0 | 1.93517 | 110 | |
| 4.0 - 40.0 | 96.0 - 60.0 | 1.85392 | 123 | |
| 40.0 - 60.0 | 60.0 - 40.0 | 1.94355 | 128 | |
| 60.0 - 100.0 | 40.0 - 0.0 | 1.74393 | 129 |
Source: Authors
We note that evaluating the multiobjective model using the confidence intervals, the shape of the Pareto front indicates the preliminary robustness of the proposed approach.
Analysis of results
It can be inferred that the network design provided by the model prioritizes coverage and timely care, impacts development policies and competitiveness, and improves the quality of life. In addition, it contributes to the provision of HS and user satisfaction. A comparison of the data from iterations 1 and 5 shows that timely attention increases by 173%, open services increase from 40 to 109, and referrals decrease by 13%, increasing the costs constraint by only 6%, as presented in Table 1.
A decrease in referrals can improve the levels of care, early detection of diseases, risks associated with transportation, and impacts of patients being referred to receive timely care. In developed countries, implementing actions for detection is based on providing universal services for all people based on health needs and not the ability to pay [52]. This action implies more excellent regional coverage to access HS [53].
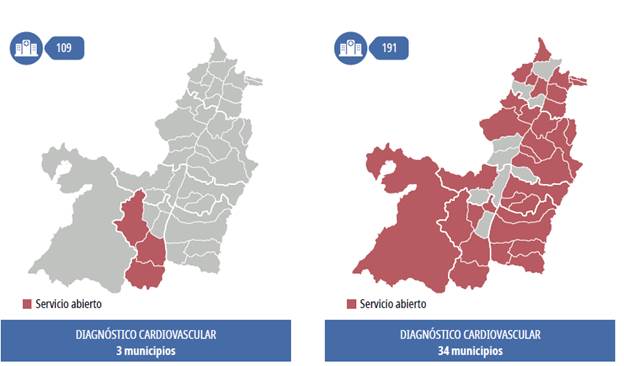
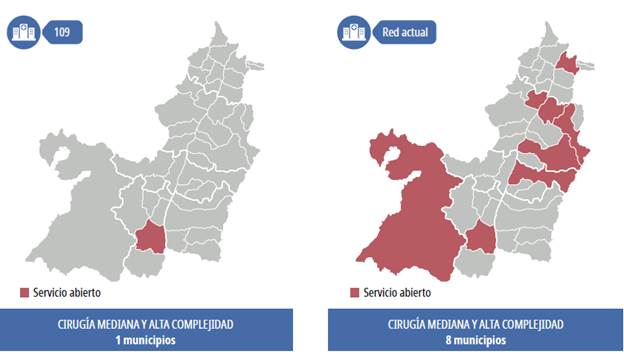
In the case of medium- and high-complexity surgeries, the system does not show changes when the investment is increased by 6% due to the cost of biomedical equipment, facilities (infrastructure), and qualified personnel. Additionally, with the cardiovascular diagnosis service, there is an increase in open services from 1 to 3 between iterations 1 and 5, as presented in Table 1.
A comparison of iterations 5 and 21 (Table 3) shows that a growing open service from 3 to 34 is observed (Figure 4). The direct relationship between open services and the cost of the opening is validated. With a higher budget, the model prioritizes open services and not referrals.
Table 3 Results obtained by the model
Source: Authors
The services that show a direct relationship between the cost and the opening of services are low-, medium- and high-complexity clinical laboratories (Figure 5) and blood transfusions due to the volume of demand and relatively low costs. This scenario is reflected in Table 3.
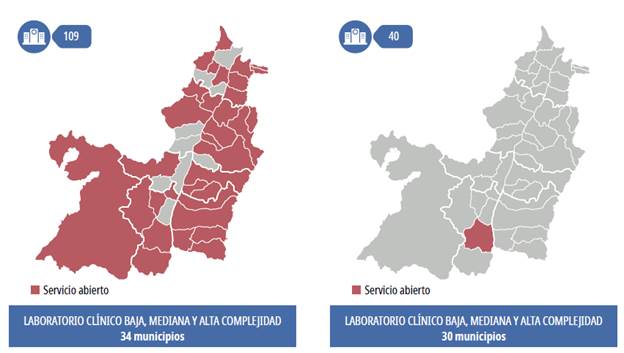
Source: Authors
Figure 5 Low-, medium- and high-complexity clinical laboratories, iteration 5 and current
The medium- and high-complexity obstetric gynecology services are another example of the opening cost's direct effect on coverage, as observed in 6. Although 86% of the municipalities require the service of obstetrics and gynecology, the model prioritizes opening the service in 3 of them. However, with an increase in the budget of 30%, in iteration 21, the level of coverage goes from 3 to 11.
Comparison with the current system
The results of each service are compared with the current reality of the network and demographic conditions. The optimal points equivalent to the opening of 109 services are data where the existing network has greater coverage and others where coverage should improve according to the demand data (Figure 6).
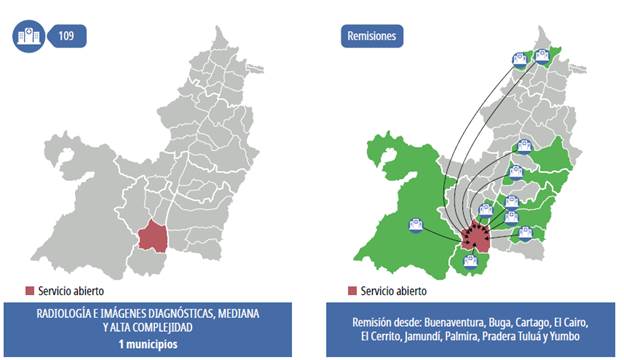
Where coverage is reduced for surgery and radiology services and medium and high complexity diagnostic images, the demand levels must be analyzed to make decisions. In particular, 26% of the municipalities under study require these services, while the model opens these services only in the Municipality of Santiago de Cali. Therefore, referring to these services is more economical than incurring opening costs. However, Figure 7 illustrates the dynamics of referrals for this service, where patients would have to travel an average of 93.45 km to be treated. The shortest route would be between Jamundi and Cali, with a travel time of approximately 26 km, and the longest would be between Cairo and Cali, with an approximate trip of 246 km.
With test iterations to reduce costs by 50% in both services, the result of the model is different from an increase in the coverage of surgery or radiology services. The model maximizes opening services with high demand and lower opening costs by releasing the budget. The model maximizes range and minimizes costs. The distribution should be evaluated from social and medical aspects to prevent the care and access system from becoming solely economic.
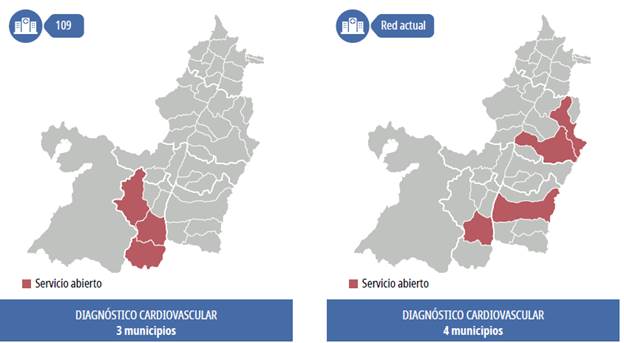
In the case of cardiovascular diagnostic services, the results of the equivalent optimal points are closer to the current ones. It presents open services in the four municipalities of Cali, Palmira, Tuluá, and Seville. The network design proposes to open services in only the three municipalities of Cali, Jamundi, and Dágua. Cali appears as a coincident municipality, a fact expected according to the population and economic distribution. However, the proposal to open municipalities in Jamundi and Dagua, as described in Figure 8, is striking.
The Hospital Network of Valle del Cauca development must obey an integrated HS network project. According to the model, the southern zone refers to open services of certain complexities. Therefore, public policy should strengthen Cali and its neighboring municipalities. In addition, the model proposes strengthening peripheral municipalities, decongesting a university hospital, and providing timely responses at lower costs, as shown in Figure 9.
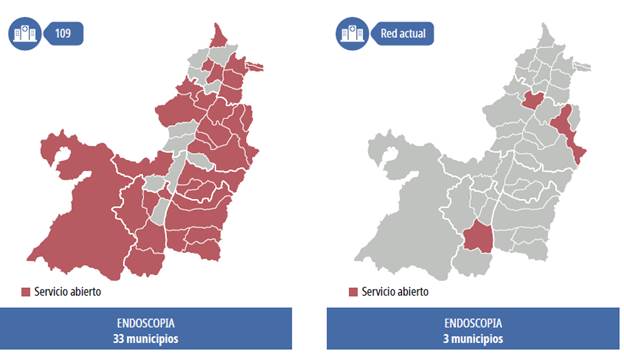
In the case of endoscopy and blood transfusion services, there are differences between the proposal and the current network. The model against the number of recent referrals determines the services opening by minimizing costs and maximizing coverage. The difference is understood when considering that the price of opening the endoscopy service is only 24% and 8% lower than that of the high-complexity surgery service.
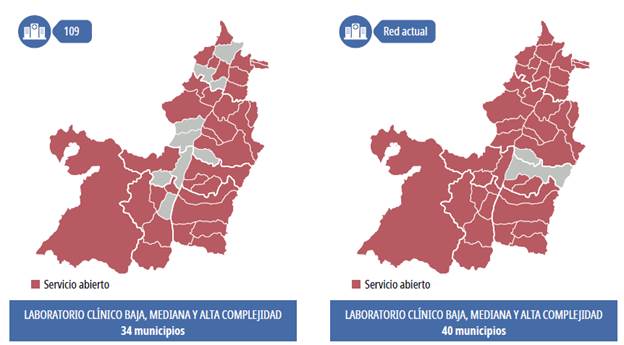
The coverage is broad in the case of low-, medium- and high-complexity clinical laboratory services, where there are demand and low costs compared to other investments. It is similar to the current network, as shown in Figure 10.
Source: Authors
Figure 10 Low-, medium- and high-complexity clinical laboratories, iteration 5 and current network
Once the results of the model and the distribution of services of the current network are analyzed, the service proposal is based on improving access and quality in the provision of services, avoiding duplication of supply, and generating an impact on the network's sustainability of Valle del Cauca. In Table 4, a set of recommendations obtained from the model is presented.
Table 4 Opening of services in municipalities
| Municipalities for which the services should be provided | Observations |
|---|---|
| Medium- and high-complexity surgery | In the case of specialized surgery services, it is suggested to remain with the current distribution of the network, understanding that emergencies should be supported with certain surgical services. |
| New Openings: Buenaventura, Cali, Cartago, Palmira, Roldanillo, Sevilla, Tuluá, Zarzal | |
| Cardiovascular diagnosis | It is recommended to maintain the services currently enabled and to add services in Jamundí and Dagua to maximize coverage. |
| Maintain Operation: Cali, Palmira, Seville, Tuluá New Openings: Dagua, Jamundí | |
| Municipalities for which the services should be provided | Observations |
| Endoscopy | |
| Maintain Operation: Alcalá, Andalucía, Ansermanuevo, Algeria, Bolívar, Buenaventura, Bugalagrande, Caicedonia, Cali, Calima, Candelaria, Cartago, Dagua, El Águila, El Cerrito, El Dovio, Florida, Geneva, Guacarí, Guadalajara de Buga, Jamundí, La Cumbre, La Victoria, Obando, Palmira, Pradera, Roldanillo, Sevilla, Toro, Tuluá, Vijes, Yumbo, Zarzal | It is recommended to open services in the municipalities mentioned by the model. |
| Obstetrics and gynecology | It is recommended to maintain the services currently enabled and to add services in Jamundi and Dagua to maximize coverage. |
| Maintain Operation: Caicedonia, Cali, Cartago, Jamundí, Palmira, Roldanillo, Sevilla, Tuluá, Yumbo, Zarzal New Openings: Dagua, Jamundí | |
| Low-, medium-, and high-complexity clinical laboratories | It is recommended to open services in the municipalities mentioned by the model. |
| Maintain Operation: Alcalá, Andalucía, Ansermanuevo, Algeria, Bolívar, Buenaventura, Bugalagrande, Caicedonia, Cali, Calima, Candelaria, Cartago, Dagua, El Águila, El Cairo, El Cerrito, El Dovio, Florida, Geneva, Guacarí, Guadalajara De Buga, Jamundí, La Cumbre, La Victoria, Obando, Palmira, Pradera, Roldanillo, Sevilla, Toro, Tuluá, Vijes, Yumbo, Zarzal. | |
| Pathology laboratories | It is recommended to keep the services |
| Maintain Operation: Cali, Jamundí, Cartago, Tuluá. | currently open that coincide with those of the model. |
| Nuclear medicine | It is recommended to keep the services |
| Maintain Operation: Cali | currently open that coincide with those of the model. |
| Medium- and high-complexity radiology and diagnostic imaging | It is recommended to maintain the services currently enabled. |
| Maintain Operation: Buenaventura, Cali, Cartago, Palmira, Roldanillo, Sevilla, Tuluá, Zarzal | |
| Blood transfusion | It is recommended to open services in the municipalities mentioned by the model. |
| Maintain Operation: Alcalá, Andalucía, Ansermanuevo, Algeria, Bolívar, Buenaventura, Bugalagrande, Caicedonia, Cali, Calima, Candelaria, Cartago, Dagua, El Águila, El Cairo, El Cerrito, El Dovio, Florida, Geneva, Guacarí, Guadalajara De Buga, Jamundí, La Cumbre, La Victoria, Obando, Palmira, Pradera, Roldanillo, Sevilla, Toro, Tuluá, Vijes, Yumbo, Zarzal. |
Source: Authors
The proposed approach has some limitations, which are described as follows:
■ First, the stochastic nature of a health system is ignored due to the proposed method is deterministic. Therefore, a two-stage stochastic approach must be offered to deal with some changing parameters.
■ Second, the maximum coverage could be improved not only considering the patients assigned to another hospital. Population coverage for health care is the share of the population eligible for a core set of health care services through public programs or primary private health insurance.
■ Third, some additional rich constraints could be added considering the patients' specific situations, such as the impossibility of moving a city to be treated.
Concluding remarks
This paper proposes and validates a multiobjective mathematical model for designing a service network that minimizes operation and opening costs to maximize coverage. The results should be analyzed from a medical, legal, and economic perspective to obtain a balance between the benefit of care and access to timely and quality of the HS.
The model results draw attention to how expensive it can be to create the HS network, where the current network is determined more by population development, the economies of cities, and local demands, compared to a regional design and organization where the general care of a region prevails.

